The proposed Keystone XL pipeline has stirred considerable debate about the future of American energy policy. While the Senate’s recent vote to block its construction tables the discussion for the time being, it does not resolve major questions about how the U.S. transports oil today.
With the ongoing shale gas boom, the U.S. is set to pass Saudi Arabia as the world’s top oil producer. Looking beyond KXL, such a rapid rise in production means American transportation networks are straining under new pressures to safely and efficiently move all this energy between different markets.
The following figures show how Keystone XL might fit into America’s energy future by illustrating the complex, changing way we transport oil today:
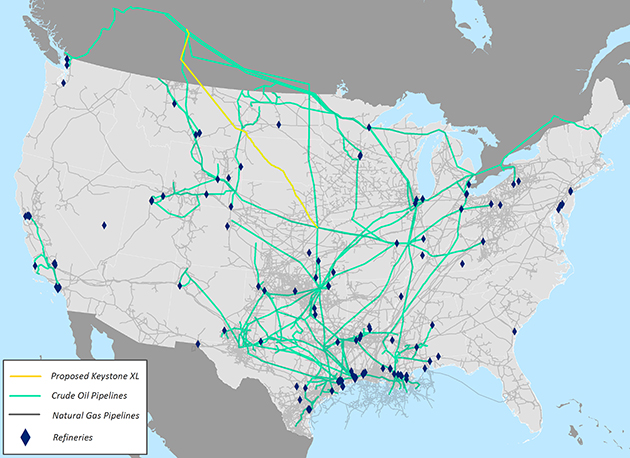
A Web of Oil and Natural Gas Pipelines Already Crisscross America Linking Up Customers and Refineries
Source: Brookings analysis of Energy Information Administration (EIA) data
Running nearly 1,200 miles from Alberta, Canada, to Nebraska, the KXL would be a sizable structure. But it would account for under 0.8 percent of the 150,000 miles of oil pipelines already spread throughout the country. In addition, there are 2.5 million miles of natural gas pipelines, along with more than 100 major refineries, further supporting the distribution of the nation’s various petroleum products.
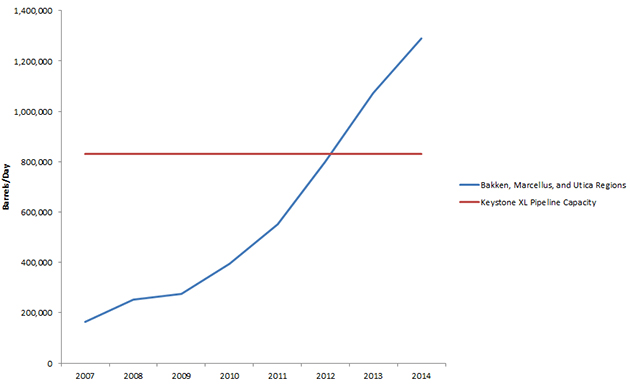
U.S. Shale Production Currently Dwarfs What the Keystone XL Could Ultimately Carry
Source: Brookings analysis of EIA and TransCanada data
If built, the KXL could handle up to nearly 830,000 barrels of oil per day. But in many regions with large shale reserves—such as Bakken, Marcellus, and Utica—levels of output already far exceed this capacity. At the same time, since the KXL largely focuses on moving increasing volumes of Canadian oil, the United States has all the more reason to explore alternate ways to move its domestic energy sources, regardless of where it’s refined.
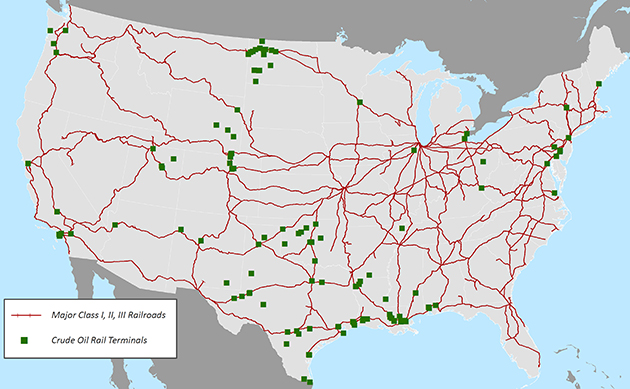
Railroads, in Particular, Are Increasingly Filling the Gap for Oil Movement
Source: Brookings analysis of EIA and BTS data
As pipelines reach capacity, U.S. railroads have seen a spike in crude oil shipments, with the number of carloads increasing from 9,500 in 2008 to 407,000 in 2013 on Class I lines alone. In North Dakota, upwards of 70 percent of its oil now travels by rail. Canadian rail firms are also looking to move more of the profitable oil cargo, despite a recent spate of derailments.
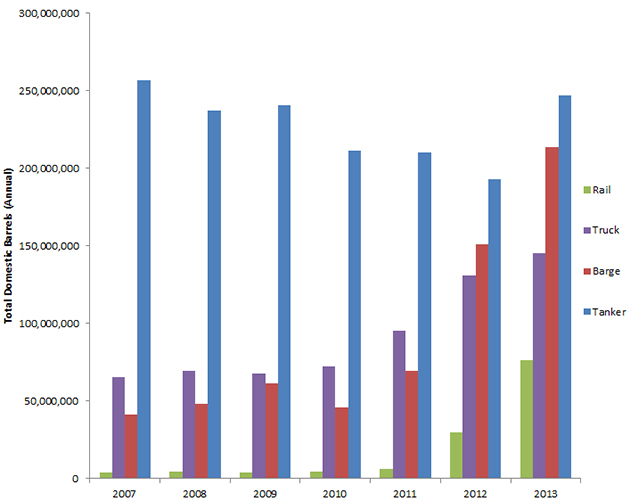
In Addition to Rail, More Domestic Crude Oil Moves by Trucks, Barges, and Tankers*
Source: Brookings analysis of EIA data
Pipelines carry the most oil by far each year—nearly 2.2 billion barrels in the United States alone—but other domestic transportation modes are growing in importance. For example, railroads saw a 382 percent increase in the number of barrels of oil they moved from 2011 to 2012, while pipelines only experienced a 6.3 percent jump. Combined, railroads, trucks, barges, and tankers moved almost 314 million more barrels in 2013 than they did in 2007.
The KXL Does Not Directly Involve Many Metro Economies Closer to Other Shale Reserves
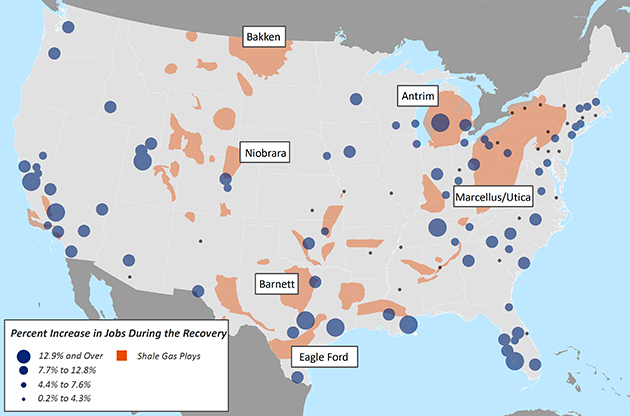
Source: Brookings analysis of Moody’s Analytics jobs data and EIA data
While the KXL would help transport more oil from the Upper Midwest to Gulf Coast refineries and elsewhere, many U.S. shale reserves are found near metro areas still muddling through the economic recovery. Places like Youngstown, for instance, benefit from nearby oil to recharge their industries and create new jobs, regardless of the KXL.
* Note that oil shipments by mode are calculated by EIA based on refinery receipts for domestic movement.
** Note that total job gains are determined based on the latest 2014 Quarter 2 version of the Brookings Metro Monitor, available here.

Commentary
Keystone XL or Not: How Does America Move Oil Now?
December 3, 2014