Some of the most interesting trends in global development––the emergence of world markets, the lag in Africa’s local civil works capacity, and the increasing presence of China and India in this space––are buried in a World Bank dataset called the Summary and Detailed Borrower Procurement Reports. These World Bank reports tell us which firms are winning contracts, which countries they are from, and how these trends have changed over time (from 1995 to 2013). In this way, they are a powerful indicator of how a country’s local firms have become more globally competitive––it’s a wonder so few people have looked through them before now!
Motivated by the relative lack of research on international procurement, we used World Bank contracts data to examine the linkages between countries’ economic development trajectories and their domestic firms’ competitiveness in our recent paper, Aid procurement and the development of local industry: A question for Africa.
Here are four key points we uncovered:
1. Identifying who wins Bank-financed contracts is a powerful way of showing the emergence of markets. (For example: China from 1995-2013.)
Whenever a country’s government uses Bank loans to help finance major purchases (“procurement”), it must agree to certain rules, including in many cases an internationally competitive bidding (ICB) procedure. Under international bidding, the borrower country puts out a contract for the work it wants done and has to accept bids from firms around the world. The most competitive firm “wins” the contract and carries out the project.
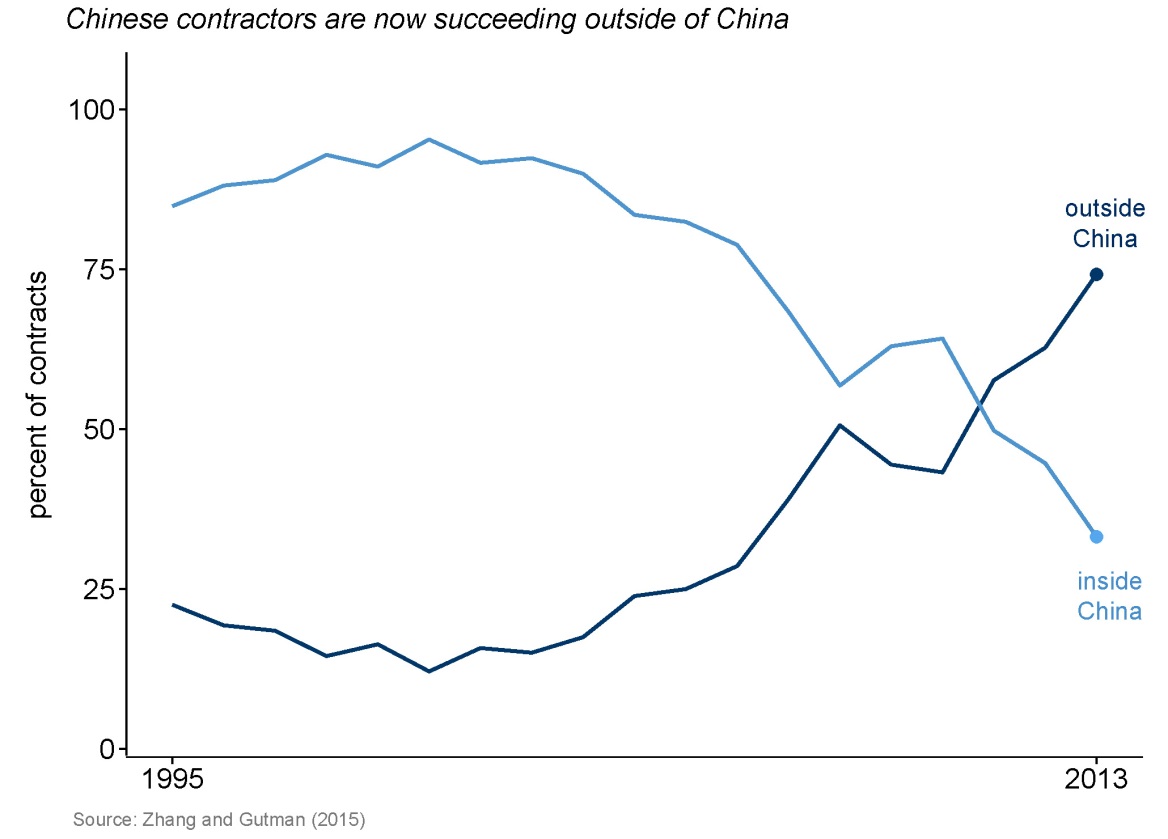
China is a powerful example of what it means to “emerge” on the global market: In 1995, Chinese firms were winning contracts inside China, but they weren’t doing much abroad. Of the Bank contracts it bid for and won under international competition, only 20 percent were for projects outside of China (Figure 1). However, by 2013, this number had increased to 70 percent. Thus, the data show that as China has emerged as a major global player, its firms have also been competing––and succeeding––on a bigger and more international playing field.
Figure 1. Percent of goods and civil works contracts won by China under World Bank ICB, FY 1995-2013
2. On the other hand, looking at who doesn’t win Bank-financed contracts can be a key indicator of lags in local capacity development. (For example: African firms are winning fewer contracts in African civil works.)
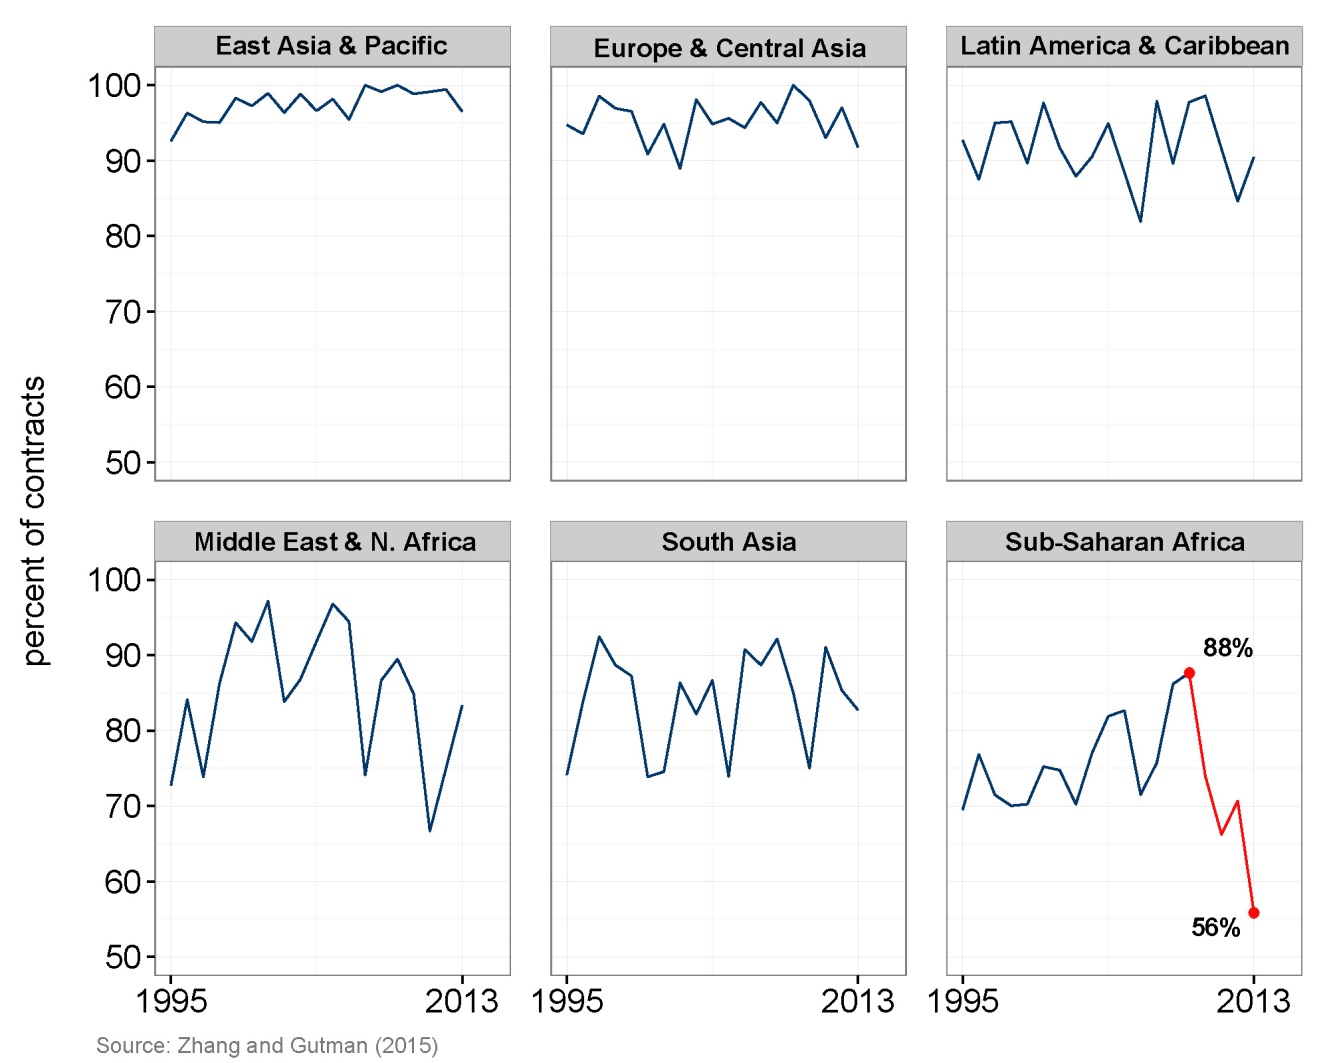
In our paper, we find that in contracts for civil works projects, local and regional firms in sub-Saharan Africa have actually lost ground between 1995 and 2013. In terms of the percentage of contracts that are won by local and regional firms, there has been a marked decline from 2009 onwards (Figure 2).
Sub-Saharan Africa is the only region for which the percentage of contracts that are locally or regionally supplied is significantly lower in 2013 than in 1995. In addition, when compared with all other regions, this percentage is the lowest in sub-Saharan Africa.
Figure 2. Percent of regionally supplied civil works contracts, by number of contracts
, FY 1995-2013
3. When it comes to explaining Africa’s civil works “lag,” there is a “China factor”…
The growth of China’s construction sector has been remarkable. And China’s investment in African infrastructure has been part of its model of engagement with the region since day one.
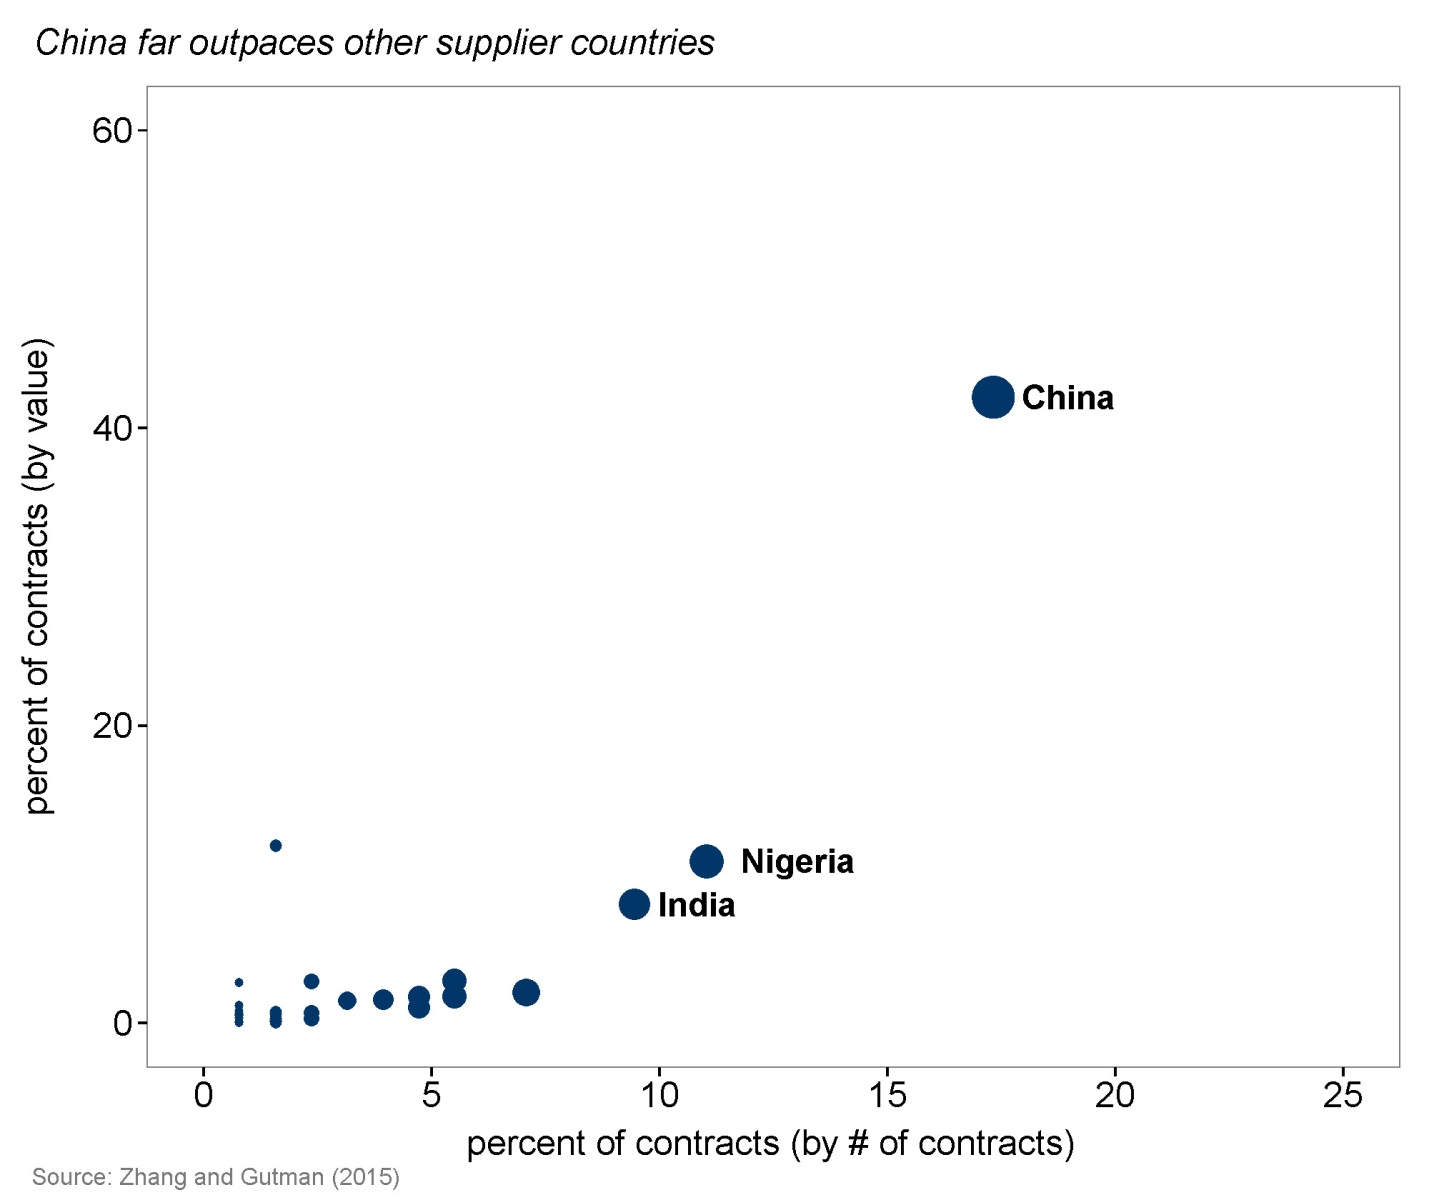
Figure 3 shows the percentage of contracts won by Chinese firms in sub-Saharan Africa, by number of contracts and by value of contracts. In 2013, China is the clear leader in the region, supplying 17 percent of civil works contracts by number, and 42 percent by value. The next largest supplier countries are Nigeria and India.
Figure 3. World Bank-financed African civil works contracts under ICB, FY 2013
4. And, more recently, an “India factor”…
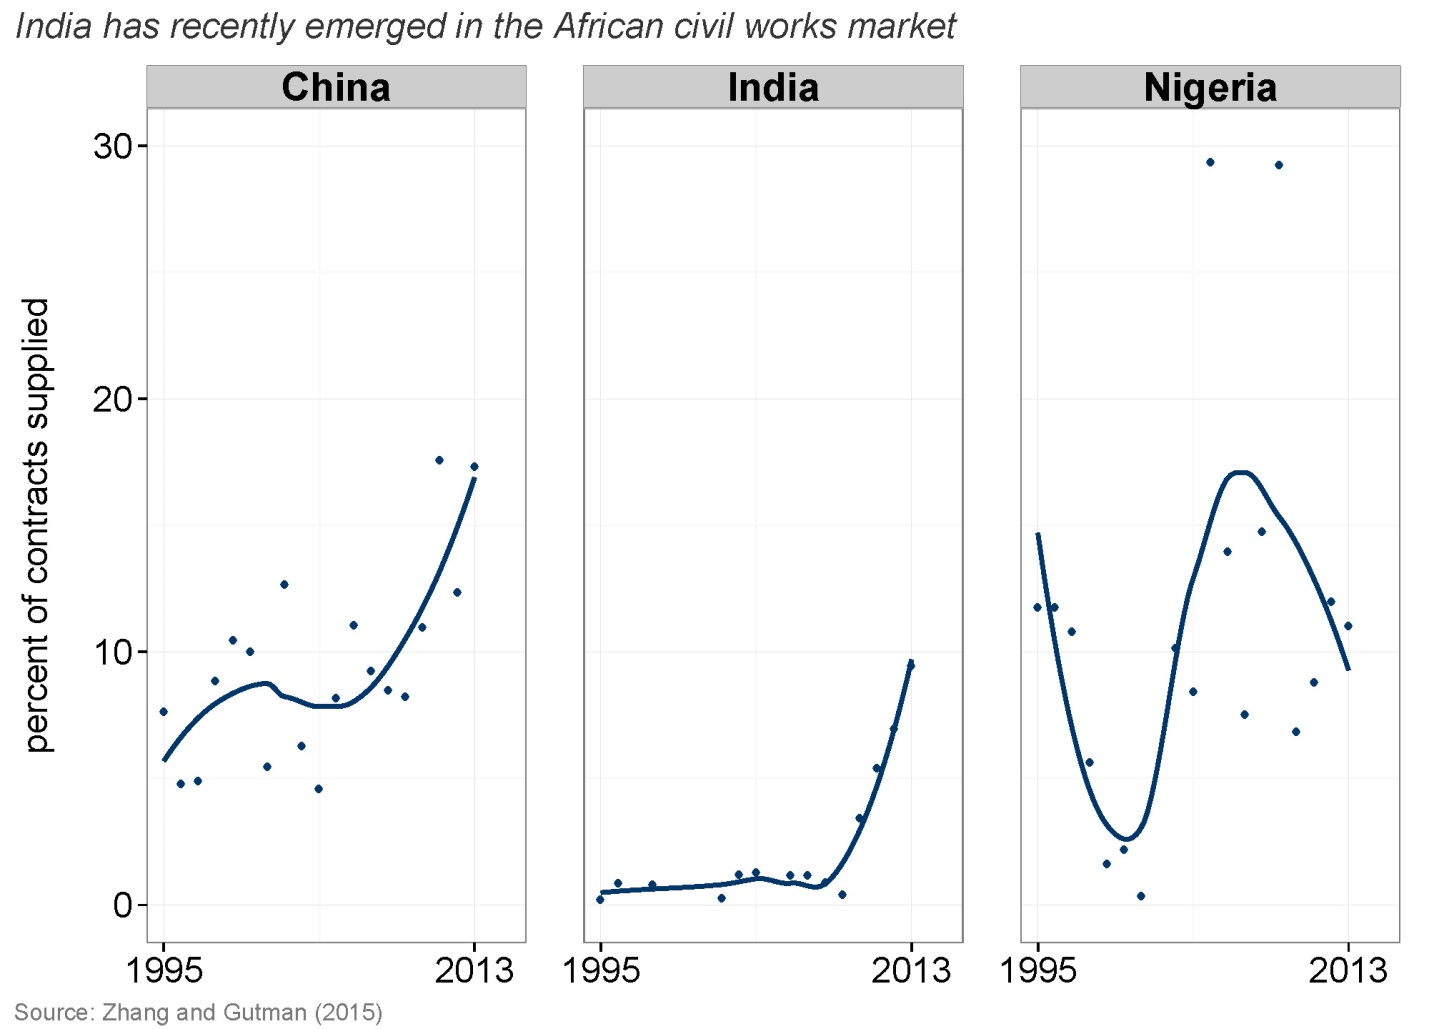
The relative positions of China, India, and Nigeria in African civil works have shifted considerably in terms of contracts supplied to the region. Chinese and Indian firms have captured an increasing share of African contracts between 1995 and 2013, while the Nigerian share has—volatility notwithstanding—remained flat.
Figure 4. China, India, and Nigeria’s share of World Bank-financed African civil works contracts under ICB, FY 1995-2013 (fitted lines)
So it’s easy to see why external competition, not faced by other regions at the time of their development, is often mentioned as an underlying cause for sub-Saharan Africa’s “civil works lag.” To the extent that the data allow, our paper offers some insight into these factors.
+1. But ultimately, how to create a local construction industry and mobilize a skilled workforce is a question for Africa itself: We need a “gap analysis” for the region.
The main observation from our analysis is that sub-Saharan Africa is not competing well for World Bank-supported civil works projects compared with the record in other regions. This is a troubling trend.
Does local civil works capacity in the region exist? If so, why is this not reflected in the data on Bank-funded projects? If not, where, and why this is the case? This type of systematic “gap analysis” is critically needed and unfortunately lacking.
We hope that our paper will encourage increased analysis of World Bank (and other multilateral development bank) financed contracts data. The World Bank information is publicly available, and we have made our source file for the paper downloadable, too. So go explore the data!


Commentary
Who wins World Bank-financed government contracts? Four things we learned from the data (+ 1 lingering question)
June 24, 2015