

President Obama’s plan to rate colleges based on student outcomes has provoked a largely positive reaction centered around the phrase “the devil is in the details.” That platitude is certainly true, and a key detail that will bedevil the creators of the new ratings is how to adjust each institution’s results to take into account the characteristics of the student body. Some kind of adjustment is critical to ensure fair comparisons between institutions—for example, to avoid penalizing institutions that enroll students who arrive with weak academic preparation.
Beth Akers and I have argued that regression adjustment is a promising strategy to make such comparisons. Regression analysis allows for the creation of metrics that show how well an institution does relative to what one would expect based on the characteristics of its student body. For example, such an analysis might indicate that colleges where students enter with average SAT/ACT scores of 1050 and where 35 percent of students are eligible for Pell grants tend to have six-year graduation rates of about 50 percent. One would then infer that a college with these characteristics but a 65 percent graduation rate is doing a pretty good job. Another college with the same graduation rates, but with characteristics that would predict a 75 percent graduation rate, would be judged to be doing quite poorly.
A simpler way to compare broadly similar institutions is to use “comparison groups” or “peer groups.” For example, the U.S. Department of Education allows institutions to select the members of the comparison group to which they will be compared in IPEDS Data Feedback Reports. In the government’s new ratings system, one could imagine selecting comparison groups based on a set of student characteristics such as academic preparation and socioeconomic status.
The comparison group approach is easier to understand, but unfortunately has significant limitations. First, comparison groups necessarily throw away potentially useful information. For example, one might define a comparison group as institutions with average SAT/ACT scores between 1000 and 1100 where 30-40 percent of students receive Pell grants. But of course this group includes institutions throughout those ranges. Is it really fair to compare an institution with an average test score of 1000 that’s 40 percent Pell to one with stats of 1100 and 30 percent?
Figure 1 compares the ratings of all four-year public universities in the U.S. calculated in two different ways. The comparison group method puts institutions into five categories based on SAT/ACT scores and five categories based on Pell enrollment, for a total of 25 possible categories. Then the rating is calculated as the difference between each institution’s graduation rate and the average of the comparison group. The regression adjustment method calculates a rating that is the difference between the actual graduation rate and the predicted rate for a typical college with exactly the same characteristics. Figure 1 shows a clear relationship between the two ratings, but plenty of differences. In particular, colleges with the same rating based on comparison groups vary noticeably in their ratings based on regression adjustment.
Figure 1. Comparison of Ratings Based on Comparison Groups and Regression Adjustment
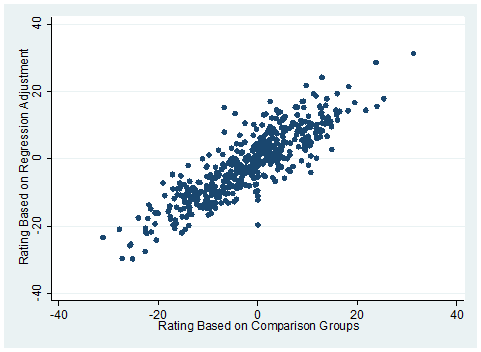
Source: Author’s calculations from IPEDS.
The second problem with comparison groups is that it is impossible to define them based on more than a very small set of characteristics. Table 1 illustrates this by showing the number of four-year public institutions in each of 25 different comparison groups, defined based on five categories of each of two characteristics: average SAT/ACT score and percent with a Pell grant. More than half of the comparison groups contain fewer than 10 institutions, and four groups contain exactly one institution. In the latter case, comparisons aren’t even possible.
Table 1. Number of Four-Year Public Institutions, By SAT/ACT Score and Percent Pell
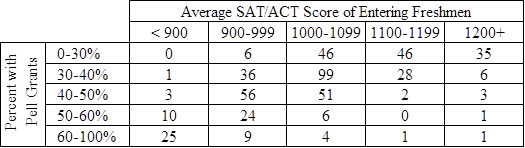
Source: Author’s calculations from IPEDS.
A credible ratings system would clearly be based on more than just two characteristics, which would only make this problem worse. Adding one more characteristic with five categories would mean 125 groups, and adding a fourth would increase it to 625—more than the number of four-year public institutions in the country! This problem could be addressed by having fewer categories, but that would make the first problem worse by lumping together institutions with quite different characteristics.
It is important to note that credible ratings could not be calculated today, even with the most careful regression adjustments, due to limitations in the existing data on colleges and universities. Many institutions, especially community colleges, do not collect data on SAT/ACT scores. Data on student demographics are limited to a handful of characteristics such as Pell eligibility, race, and gender. And outcomes are limited to graduation rates for a narrowly defined group of students across the entire institution, when there may be important variation across different programs within a college. A radical revision of the federal IPEDS data collection effort will be needed for the new college ratings system to be successful.
Regression adjustment is not a perfect solution to leveling the playing field for institutions serving different kinds of students. The regression method makes some assumptions that may not be true in order to come up with a rating for every institution regardless of whether there are actually any similar institutions (consider the groups in Table 1 that only have one member). And although the method produces results that appear to be comparable across a wide range of institutions, in reality such comparisons may be inappropriate. It makes the most sense to compare regression-adjusted ratings within general comparison groups (such as four-year private research universities, or four-year public comprehensive institutions). In other words, any single regression-adjusted metric should be part of a broader system that includes several measures in order to mitigate attempts to focus too much on (or try to game) any one measure.
A common objection to regression adjustment is that it is too complicated to explain to policymakers, colleges, and potential students. Transparency in the government’s methodology will of course be important, but it is not as important that the details of the method be readily understood by every consumer of the ratings. Most restaurant goers in New York City probably do not understand how the health department comes up with letter grades, but still take them seriously. In higher education, it’s more important that ratings be an accurate indicator of quality than that the underlying methodology be easily understood by the masses.