
Contents
- Introduction
- Measuring the metro middle class
- The middle class is largest in small/middle-sized metro areas
- Metro middle class sizes reflect local demographic and industrial patterns
- Small/mid-sized metro areas have experienced larger changes in the size of their middle classes
- Changes in metro middle class size usually reflected expanding high-income populations
- What the middle class in metro areas tells (and doesn’t tell) us
- Interactive dashboard: Share of metro area households by income category
Efforts to improve the quality of life for the American middle class, and to help more people join its ranks, require local insight. After all, many local economic factors likely shape the size of the middle class: the types of industries that are present and the jobs that are available; the education and skills that workers and entrepreneurs possess; and the spatial and social dynamics that enable (or inhibit) access to regional economic opportunity.
By the same token, many public policies and institutions that affect the size and stability of the middle class are also local in nature, such as economic and workforce development, transportation and housing, and K-12 schools and community colleges.
This report examines the presence of the middle class in America’s metropolitan areas, the collections of cities and surrounding suburbs that represent the nation’s regional economies. While there are few truly metropolitan governments in the United States, actors in many of the policy areas noted above work to influence economic opportunity at that scale. Looking across 382 metro areas, this analysis spotlights variation in the size of the middle class, factors associated with that variation, and trends in middle-class representation over time. It concludes with observations on the value of measuring middle-class size and status locally.
Click here to explore the interactive dashboard: Share of metro area households by income category »
Measuring the metro middle class
One could measure the size of the middle class in metro areas in at least two ways:
- Apply a uniform national definition of the middle class to data for metro areas. For instance, define the middle class as the middle 20 percent of the U.S. income distribution, then calculate the share of households in each metropolitan area who have incomes between the thresholds implied by that quintile.
- Vary the definition of middle class for each metropolitan area based on its own middle, i.e., median. Many federal programs use 60 percent or 80 percent of a metropolitan area’s median income as a dividing line between low/moderate and middle income. One could calculate specific thresholds for each metro area based on its median income, then calculate the share of households with incomes between those thresholds.
Each of these approaches (and others) has advantages and disadvantages. The former provides a more apples-to-apples comparison of incomes across metro areas, but may fail to take sufficient account of the differences in what it takes to be “middle class” (i.e., costs of living) in different regional settings. The latter may offer a clearer picture of the shape of the income distribution within a regional economy, but may produce large differences in the definition of “middle class” across metro areas that obscure true variation in the share of households that have what most observers would consider to be a middle-class income.
Ultimately, this analysis adopts a middle ground. It defines the middle class as occupying the middle three quintiles of the national income distribution (based on the 2017 American Community Survey), following a definition adopted by the Brookings Future of the Middle Class Initiative. By that definition, middle-class U.S. households had incomes between about $25,000 and $120,000 in 2017. The analysis then adjusts those national thresholds based on two characteristics for each metropolitan area: (a) Bureau of Economic Analysis regional price parities, which measure the differences in price levels across metro areas and vary from a U.S. baseline of 100, from 79 (in Beckley, W.Va.) to 127 (in San Jose, Calif.); and (b) average household size, which influences the resources available per person, and varies from 2.11 (in The Villages, Fla.) to 3.89 (in El Centro, Calif.).1 The analysis likewise uses “low-income households” to refer to metropolitan residents with incomes below the locally-defined middle class; and “high-income households” to refer to those with incomes above that middle class definition.
The middle class is largest in small/middle-sized metro areas
The nation’s 382 metropolitan areas had 280 million residents in 2017, representing six in seven Americans. Across those areas, the middle class varies in size from just over half of all households in Bloomington, Ill., to nearly three-quarters of households in Jacksonville, N.C.2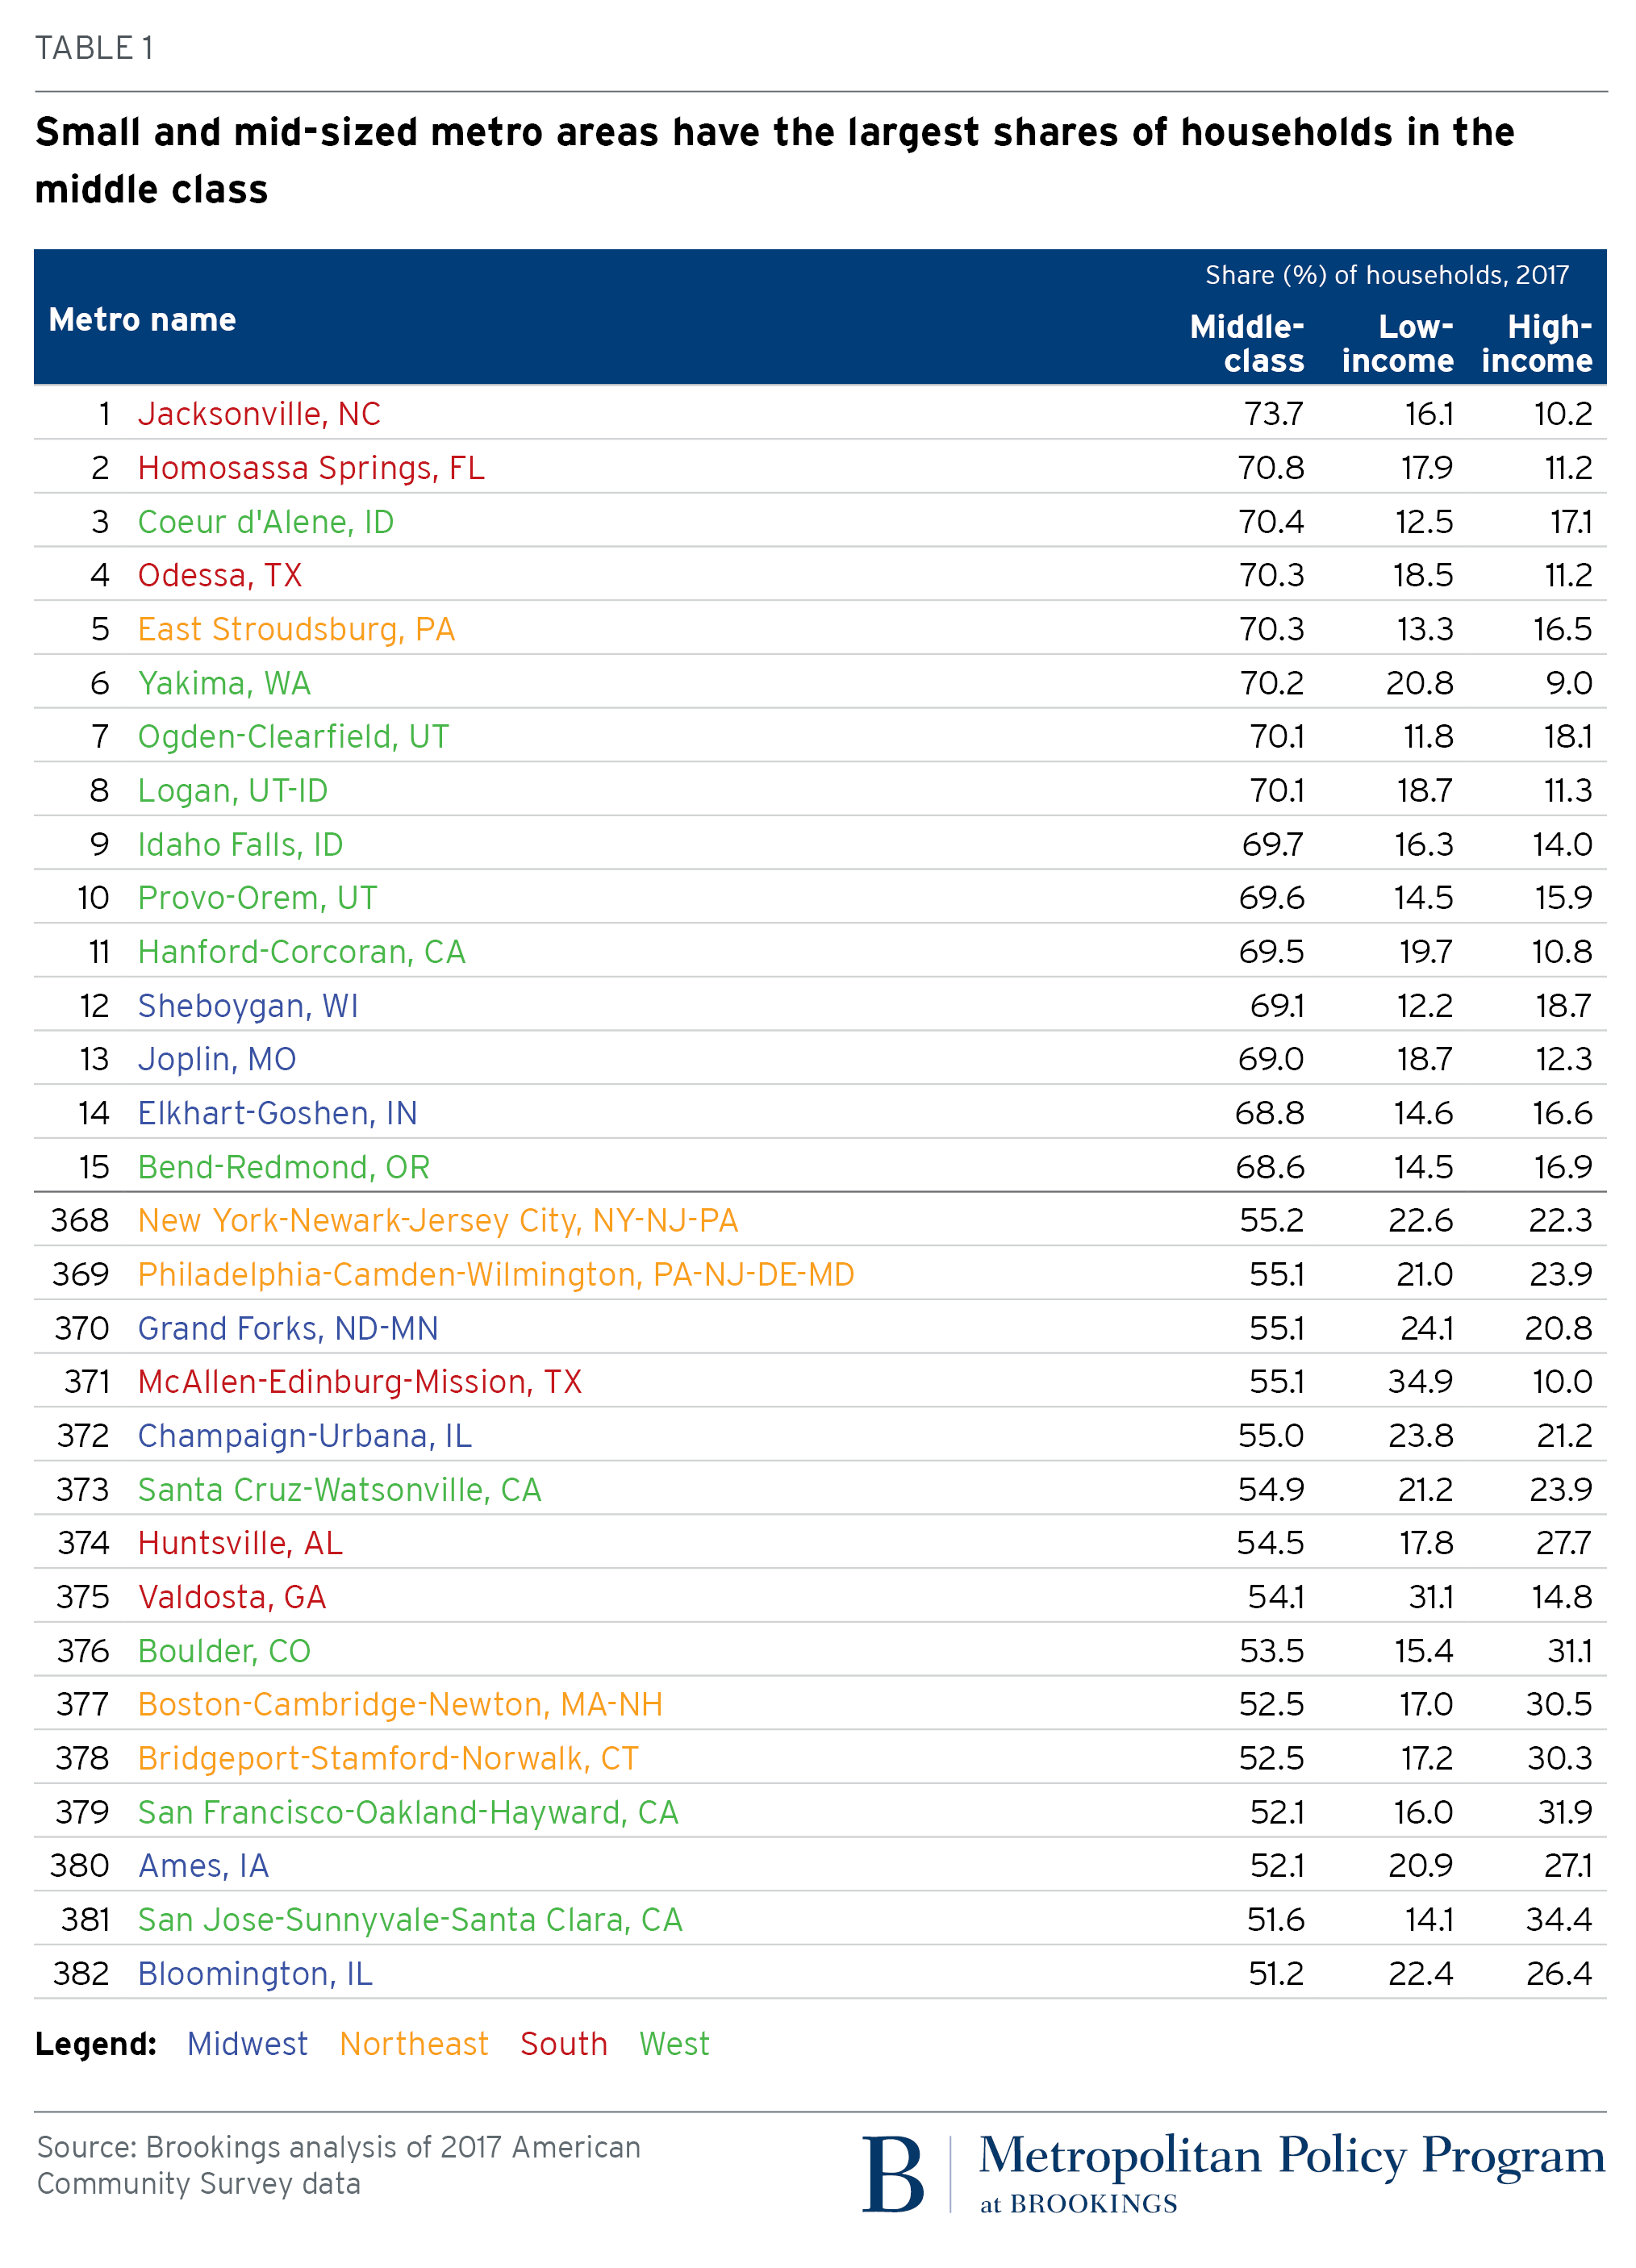
Metropolitan areas with the largest middle classes are almost exclusively small and mid-sized. Many are one of three “M’s.” Manufacturing centers like Elkhart, Ind., Joplin, Mo., and Sheboygan, Wisc. boast significant numbers of middle-paying jobs in that sector. Military towns like Hanford, Calif., and Jacksonville, N.C. have uniformed service members and contractors who predominantly earn middle incomes. Mormon communities (Logan, Ogden, and Provo, Utah) tend to have good-paying jobs and larger family sizes that place most of their households in the middle class. Region matters, too. States in the South and West account for 11 of the 15 metro areas with the largest middle classes. With a few exceptions (e.g., Yakima, Wash.), most have comparably sized low-income and high-income populations.3
Although small and mid-sized metro areas tend to have the largest shares of their households in the middle class, the bulk of the middle class across all metro areas lives in big places. Indeed, 59 percent of metropolitan middle-class households live in a very large metro area, one of 42 nationwide that have at least 500,000 households (Figure 1). Small and mid-sized metro areas account for similar shares of the remainder.

The metro areas with the smallest middle classes include a few college towns (e.g., Ames, Iowa; Champaign-Urbana, Ill.; Santa Cruz, Calif.) where large, temporarily low-income student populations and high-paid faculty and administrators leave relatively few earners in the middle. They also include tech capitals like the San Francisco Bay Area; Boston; Boulder, Colo.; and Huntsville, Ala. where high-paying jobs support relatively large high-income populations (and commensurately smaller middle classes). New York and Philadelphia, two very large and diverse metropolitan economies, have small middle classes as well. Metro areas with the smallest middle classes are more geographically diverse than those with the largest middle classes.
Although small and mid-sized metro areas tend to have the largest shares of their households in the middle class, the bulk of the middle class across all metro areas lives in big places.
Focusing on the 100 largest metropolitan areas makes some of these geographic patterns clearer (Map 1). Beyond those in Utah, other large metro areas with large middle classes include Cape Coral, Deltona, and Lakeland in Florida; Boise, Idaho; Honolulu, and Las Vegas. Many of these metro areas are largely suburban in form, with neither very high-paying industries, nor the subsidized housing and transit found in most older cities, on which low-income populations often depend. Large metro areas with relatively small middle classes, by contrast, tend to have older cities and suburbs, and thus many are located in the Northeast, such as Boston; Bridgeport, Conn.; Philadelphia; Providence, R.I.; and New York. New Orleans ranks among this group as well. All of these metro areas have significant numbers of high-paying technology and professional services jobs, while they also house significant low-income populations in and around their central cities. These characteristics, in turn, leave them with fewer households in the middle of the income distribution.

Metro middle class sizes reflect local demographic and industrial patterns
Looking across all metropolitan areas suggests common local factors associated with having a larger—or smaller—middle class.
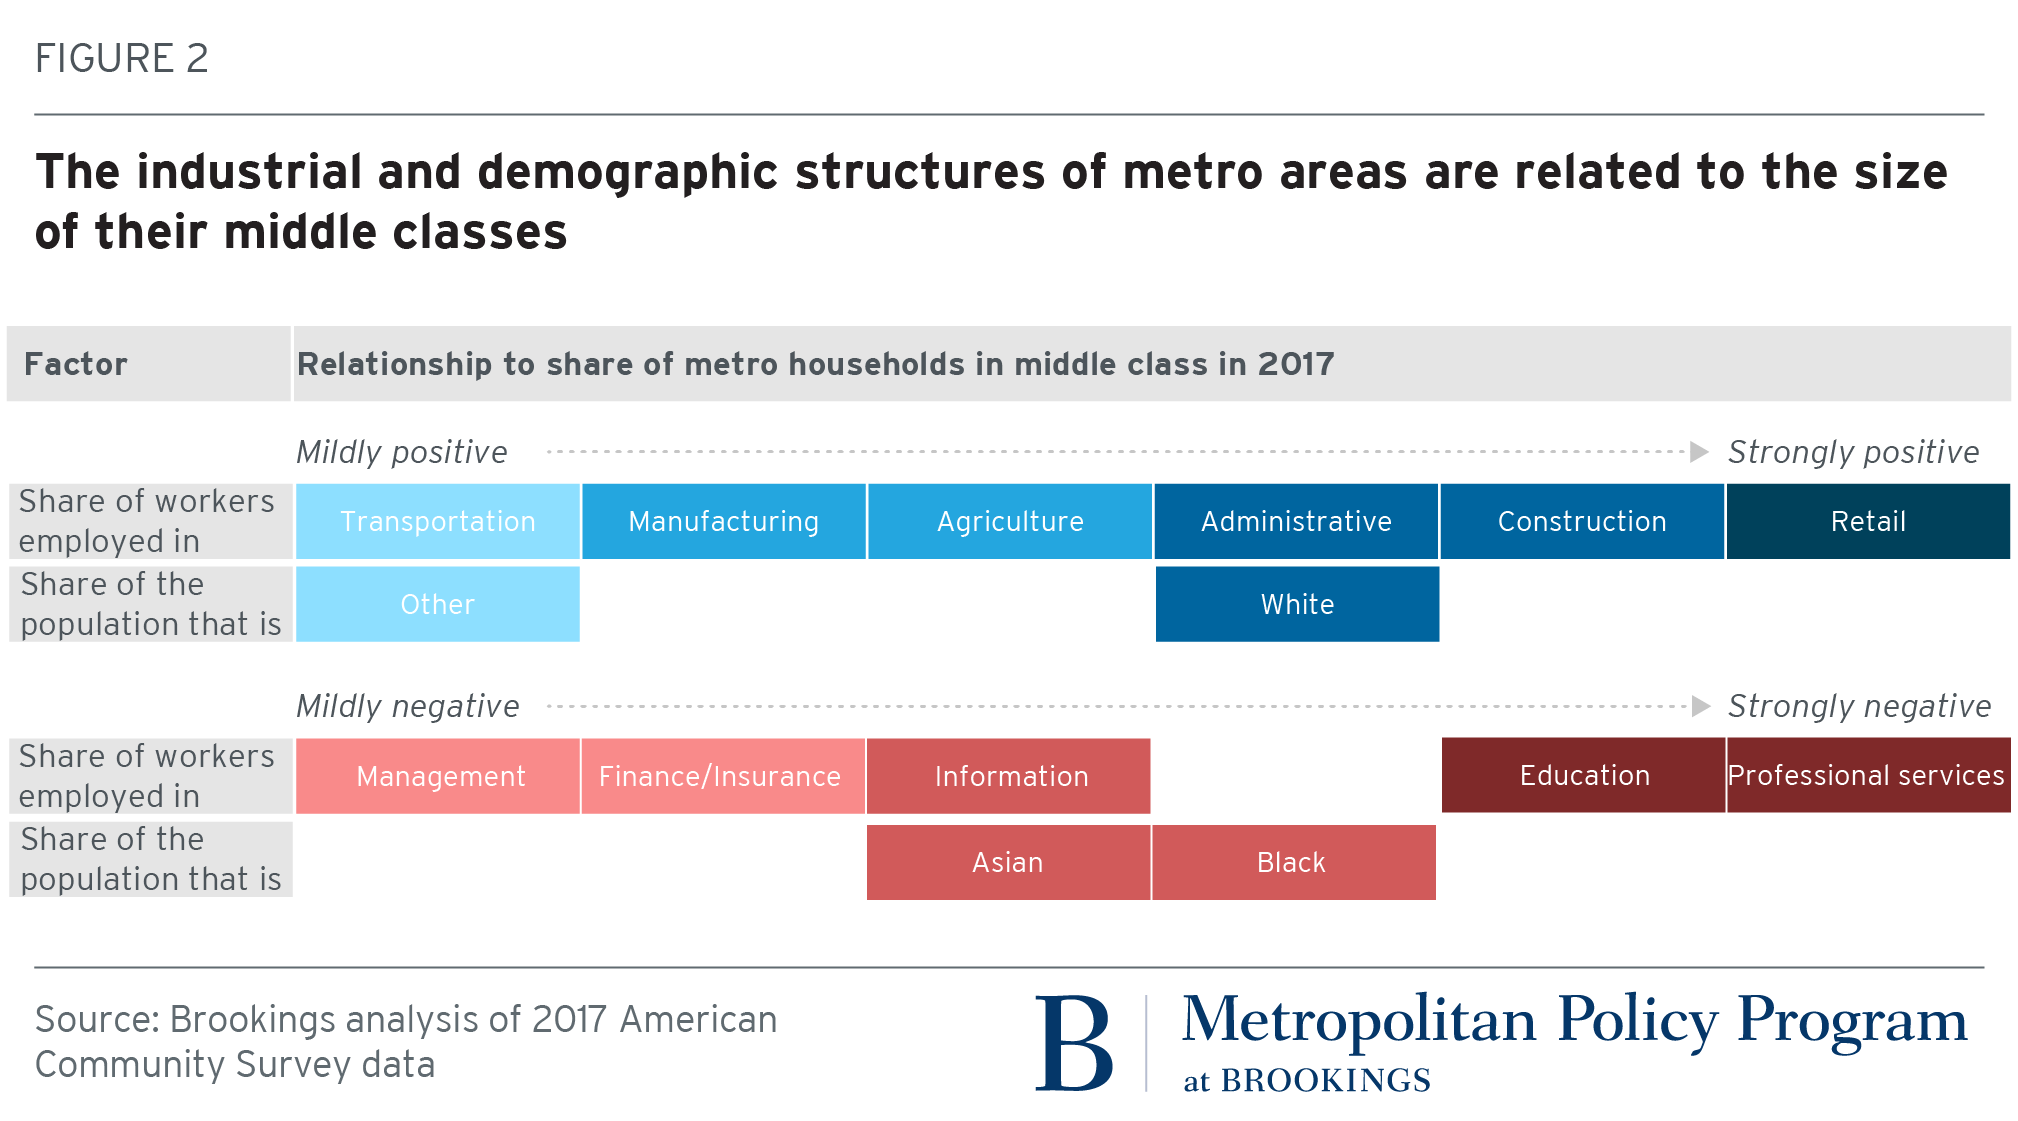
First, racial makeup relates to middle class size. Metro areas in which non-Hispanic whites account for a larger share of population tend to have larger middle classes (Figure 2). Such metro areas also have, on average, smaller low-income populations, and larger high-income populations. By contrast, metro areas with larger black populations tend to have smaller middle classes, and larger low-income populations. These patterns make sense given the strong, longstanding relationship between race and income in America. Notably, metro areas with larger Hispanic populations also have larger low-income populations, but middle classes of about the same size as other metro areas. Metro areas with large Asian populations, most of which are in California, have smaller middle classes and larger high-income household shares.
Second, the types of industries that are prominent in a metro area are strongly associated with the size of its middle class. Metro areas where a larger share of the population works in retail, construction, administrative services, agriculture, manufacturing, and transportation have larger middle classes on average (Figure 2). These industries tend to provide decent-paying jobs for individuals who may not possess a four-year college degree, and who represent the bulk of the workforce in most metro areas. Conversely, metro areas where professional services, information, finance, and management industries predominate have relatively small middle classes, and considerably larger high-income populations. These are mostly large places like the San Francisco Bay Area, Washington, Boston, and Seattle, with significant numbers of highly paid workers. Consistent with the observation above about college towns, metro areas where more people work in higher education tend to have smaller middle classes, and larger low-income and high-income populations.
Notably, not all industries that appear to support larger metro middle classes are created equal. For instance, metro areas with relatively more retail jobs tend not only to have larger middle classes, but also to have larger low-income populations. Retail supports many middle-paying managerial jobs, but even more low-paying front-line jobs. By contrast, metro areas with more manufacturing jobs have on average larger middle classes and smaller low-income populations. Relative to retail, manufacturing supports more jobs in the middle of the pay distribution, and fewer at the low end. These patterns may change in the future, of course, as automation alters the number of jobs and their skills demands in these and other industries.
Of course, demographic and economic factors interrelate at the metropolitan scale. For instance, manufacturing metro areas tend to have larger white populations, and construction metro areas tend to have larger Hispanic populations. While a full statistical analysis of what determines metro middle class size is beyond the scope of this piece, these findings strongly indicate that factors beyond size and geography significantly influence the shape of metro areas’ income distributions.
Small/mid-sized metro areas have experienced larger changes in the size of their middle classes
Under the definition employed here, the relative size of the U.S. middle class does not change over time; 60 percent of all households always have incomes in the middle three quintiles of the income distribution. Because about 86 percent of Americans live in metropolitan areas, the collective size of their middle class also does not change much over time. The share of all households in metro areas classified as middle class was 60.2 percent in 2017, down just slightly from 60.7 percent in 2000.
The middle-class share in metro areas dropped slightly because they gained somewhat more high-income households over the past decade and a half. The 382 U.S. metro areas added (on net) roughly 13.5 million households from 2000 to 2017. Of those, 8.0 million (57 percent) had middle-class incomes, 3.4 million (25 percent) had incomes in the adjusted top national quintile, and 2.6 million (18 percent) had incomes in the adjusted bottom national quintile. Put another way, metro areas overall became a little bit wealthier compared to the rest of the country.
Many individual metropolitan areas, of course, experienced more significant changes in the size of their middle classes, from an 11 percentage-point drop (Grand Forks, N.D.) to an 8.1 percentage-point increase (Auburn, Ala.) (Table 2).
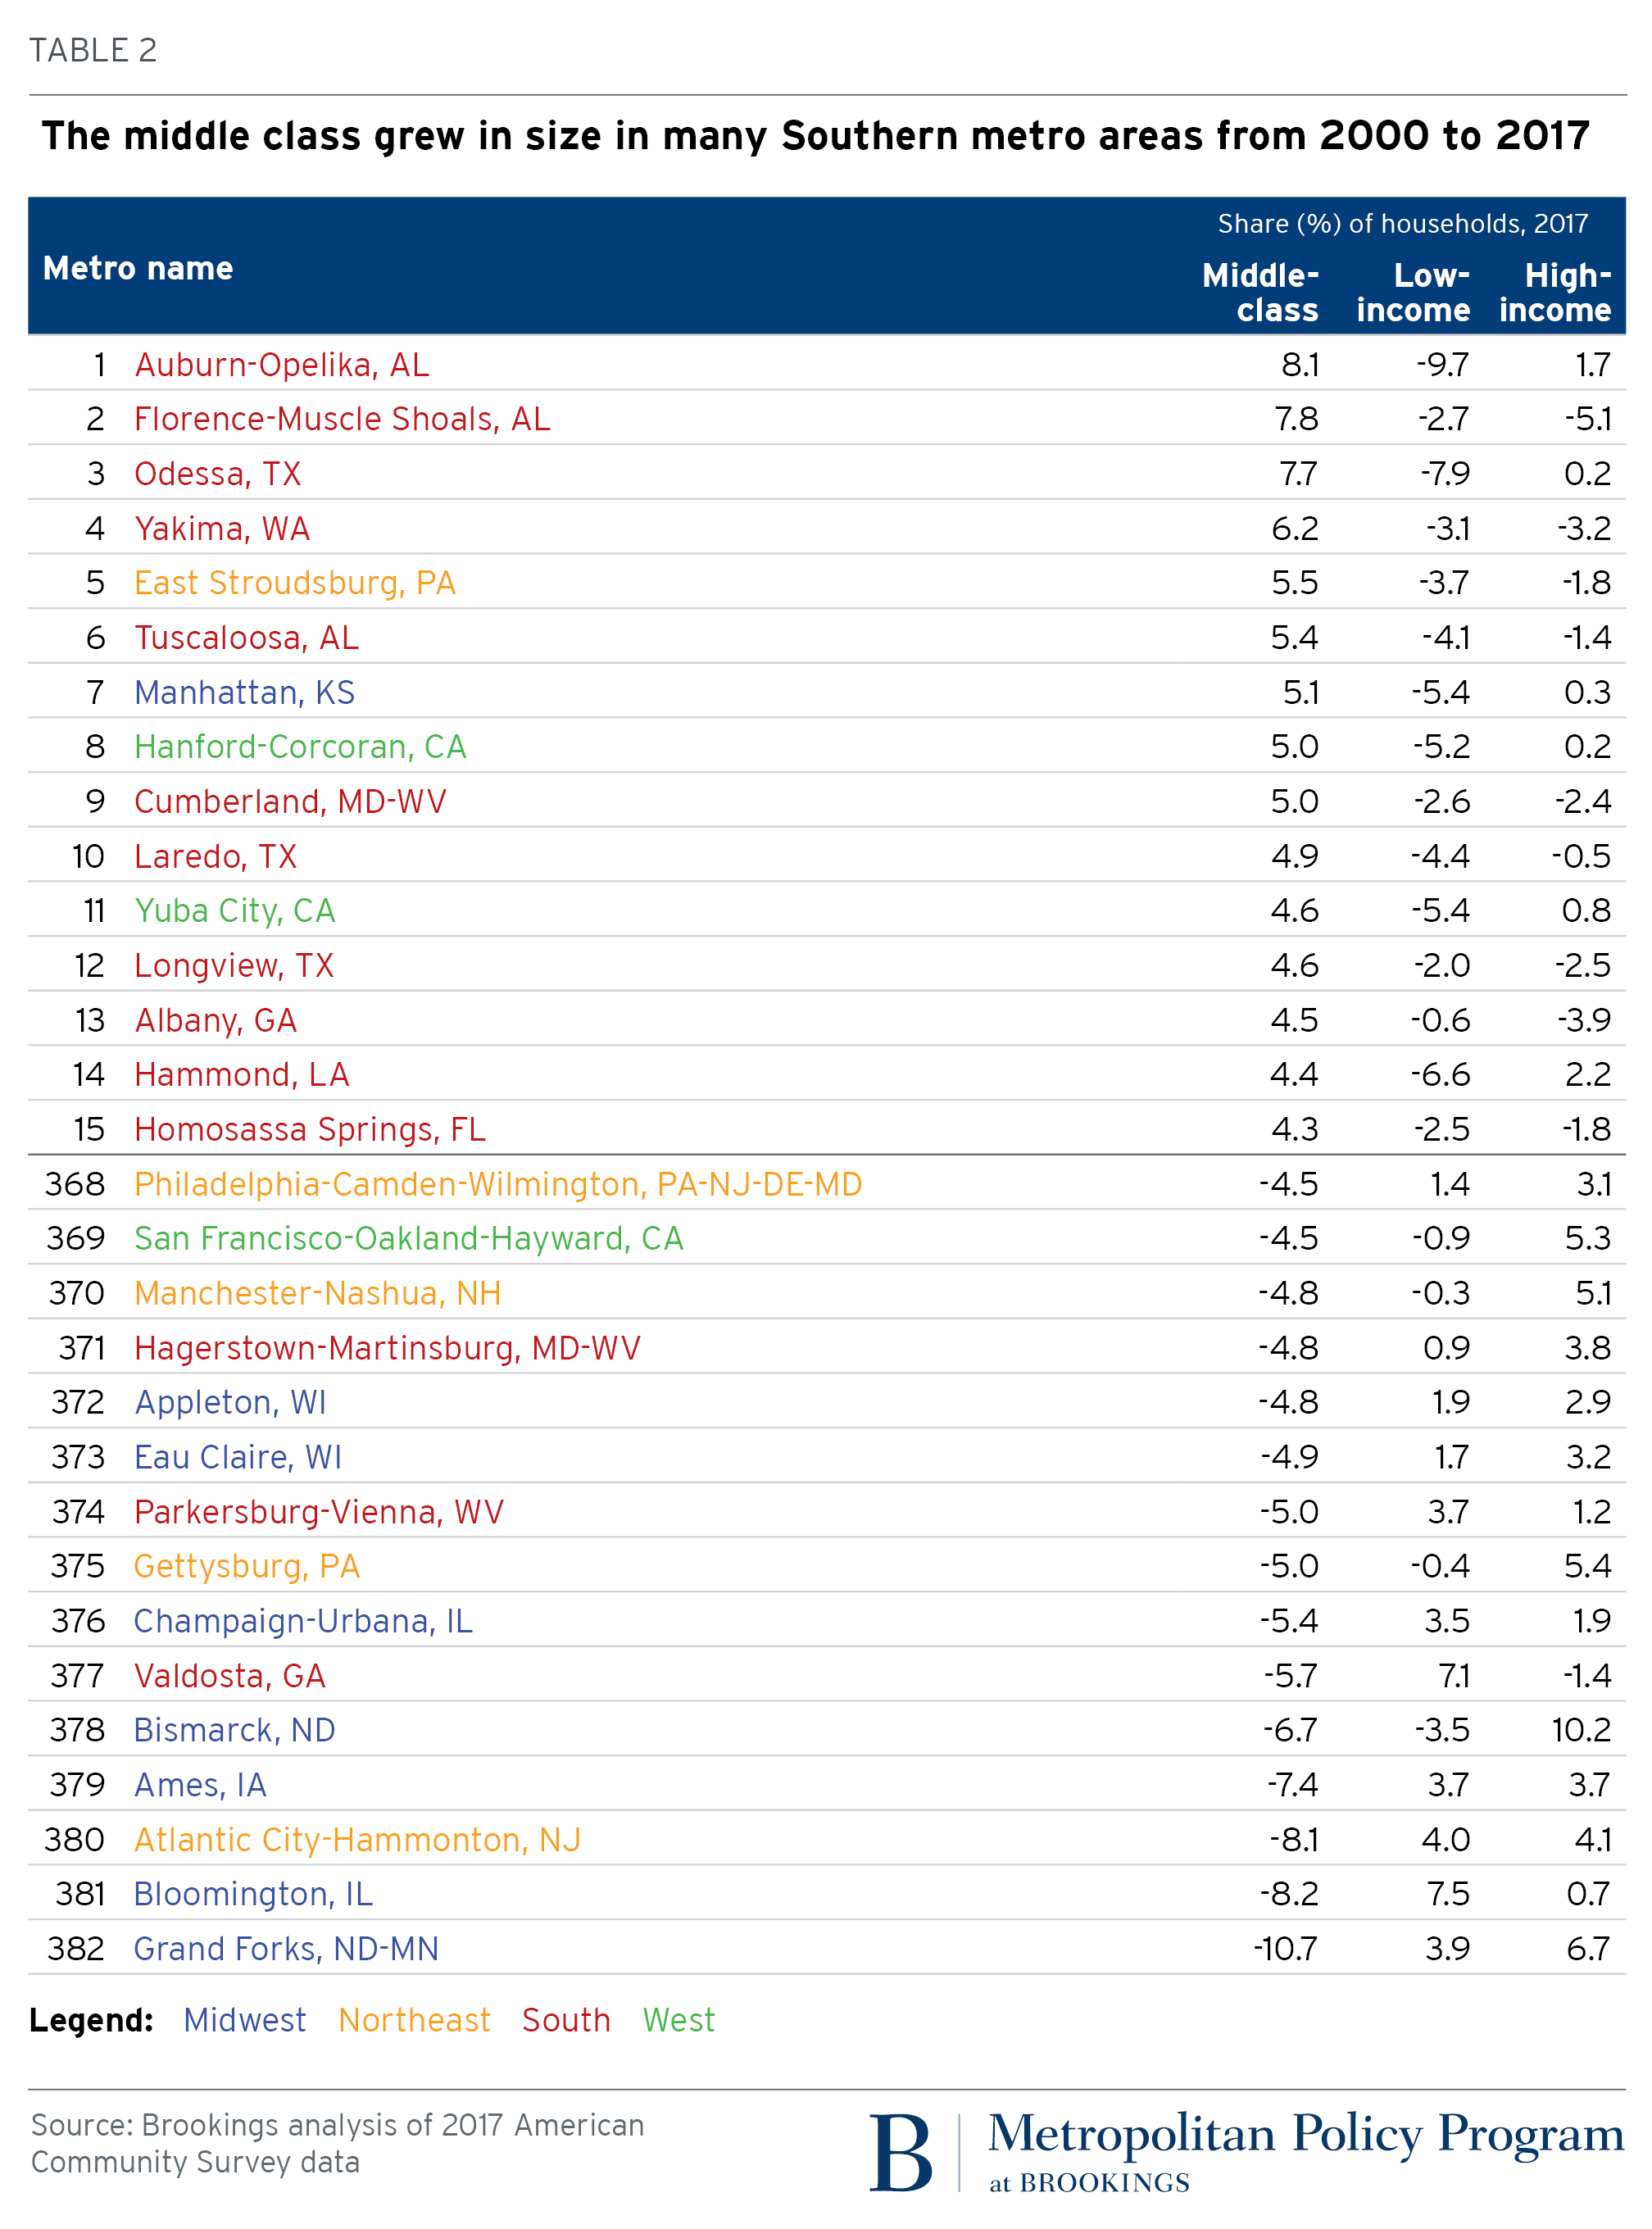
Just as most metro areas with the largest middle classes were small and mid-sized, so too were the metro areas that experienced the sharpest increases in the size of their middle classes from 2000 to 2017. These metro areas followed one of three patterns. Some grew a larger middle class because they became wealthier overall, with most households earning more. This was the pattern in a few college towns (Auburn and Tuscaloosa, Ala. and Manhattan, Kan.) and oil and gas hubs benefiting from a resource boom (Hammond, La. and Odessa, Texas). Communities experiencing manufacturing job decline like Albany, Ga., and Florence-Muscle Shoals, Ala., saw their middle classes grow as their high-income household shares shrank, suggesting a pattern of downward mobility into the middle class. A third set of metro areas experienced a growing middle class amid declining extremes—Cumberland, Md.; Longview, Texas; Yakima, Wash.—possibly because they preserved existing jobs or grew jobs in middle-paying industries (e.g., health care, manufacturing, transportation/logistics).
Metro areas where the middle class declined most in size from 2000 to 2017 were also mostly small and mid-sized, with a couple notable exceptions in Philadelphia and San Francisco. Like San Francisco, several of these metro areas saw their high-income household shares grow as their middle-income shares shrank. Some of these may have attracted in-migrants from large, adjacent, prosperous metro areas (e.g., Gettysburg, Pa. near Baltimore; Hagerstown, Md. near Washington; Manchester, N.H. near Boston). Others like Bismarck and Grand Forks, N.D. benefited from the shale gas boom. In Bloomington, Ill. and Valdosta, Ga., by contrast, low-income households replaced middle-income households, likely the result of faltering or restructuring local manufacturing sectors and downward mobility for their workers.
Among large metro areas, changes in the size of the middle class were somewhat less extreme than those occurring in small and mid-sized metro areas. Outcomes ranged from a 3.5 percentage-point increase in Jackson, Miss., to the 4.5 percentage-point drop in San Francisco. Geographically, metro areas with an expanding middle class tended to be in the South and West, while those with a shrinking middle class were located in the Northeast, along the West Coast, and in portions of the Midwest (Map 2).

Changes in metro middle class size usually reflected expanding high-income populations
As the above examples suggest, metro areas that experienced the largest expansions or contractions in their middle classes had mixed fortunes. In some, a gain in middle-class size seemed to reflect upward mobility for previously low-income households, while in others it reflected downward mobility for once-high-income workers. Similarly mixed dynamics characterized metro areas in which the middle class shrank.
In general, however, patterns of growth and decline in metro areas’ middle classes from 2000 to 2017 seemed more likely to reflect positive than negative momentum for local households. To illustrate this, Figure 3 sorts the 382 metro areas into four quadrants. In the quadrant with the largest number of metro areas (124), the middle class shrank, but the change in share of households with high incomes exceeded the change in the share with low incomes. This was the pattern noted above for San Francisco and Bismarck, N.D. In the quadrant with the second-highest number of metro areas (99), the middle class grew, while again the change in high-income share exceeded the change in low-income share. Auburn, Ala. and Odessa, Texas fit this pattern. The quadrant with the fewest number of metro areas (68) represented places in which the middle class shrank and low-income household growth predominated—economically struggling metro areas like Bloomington, Ill. and Valdosta, Ga.
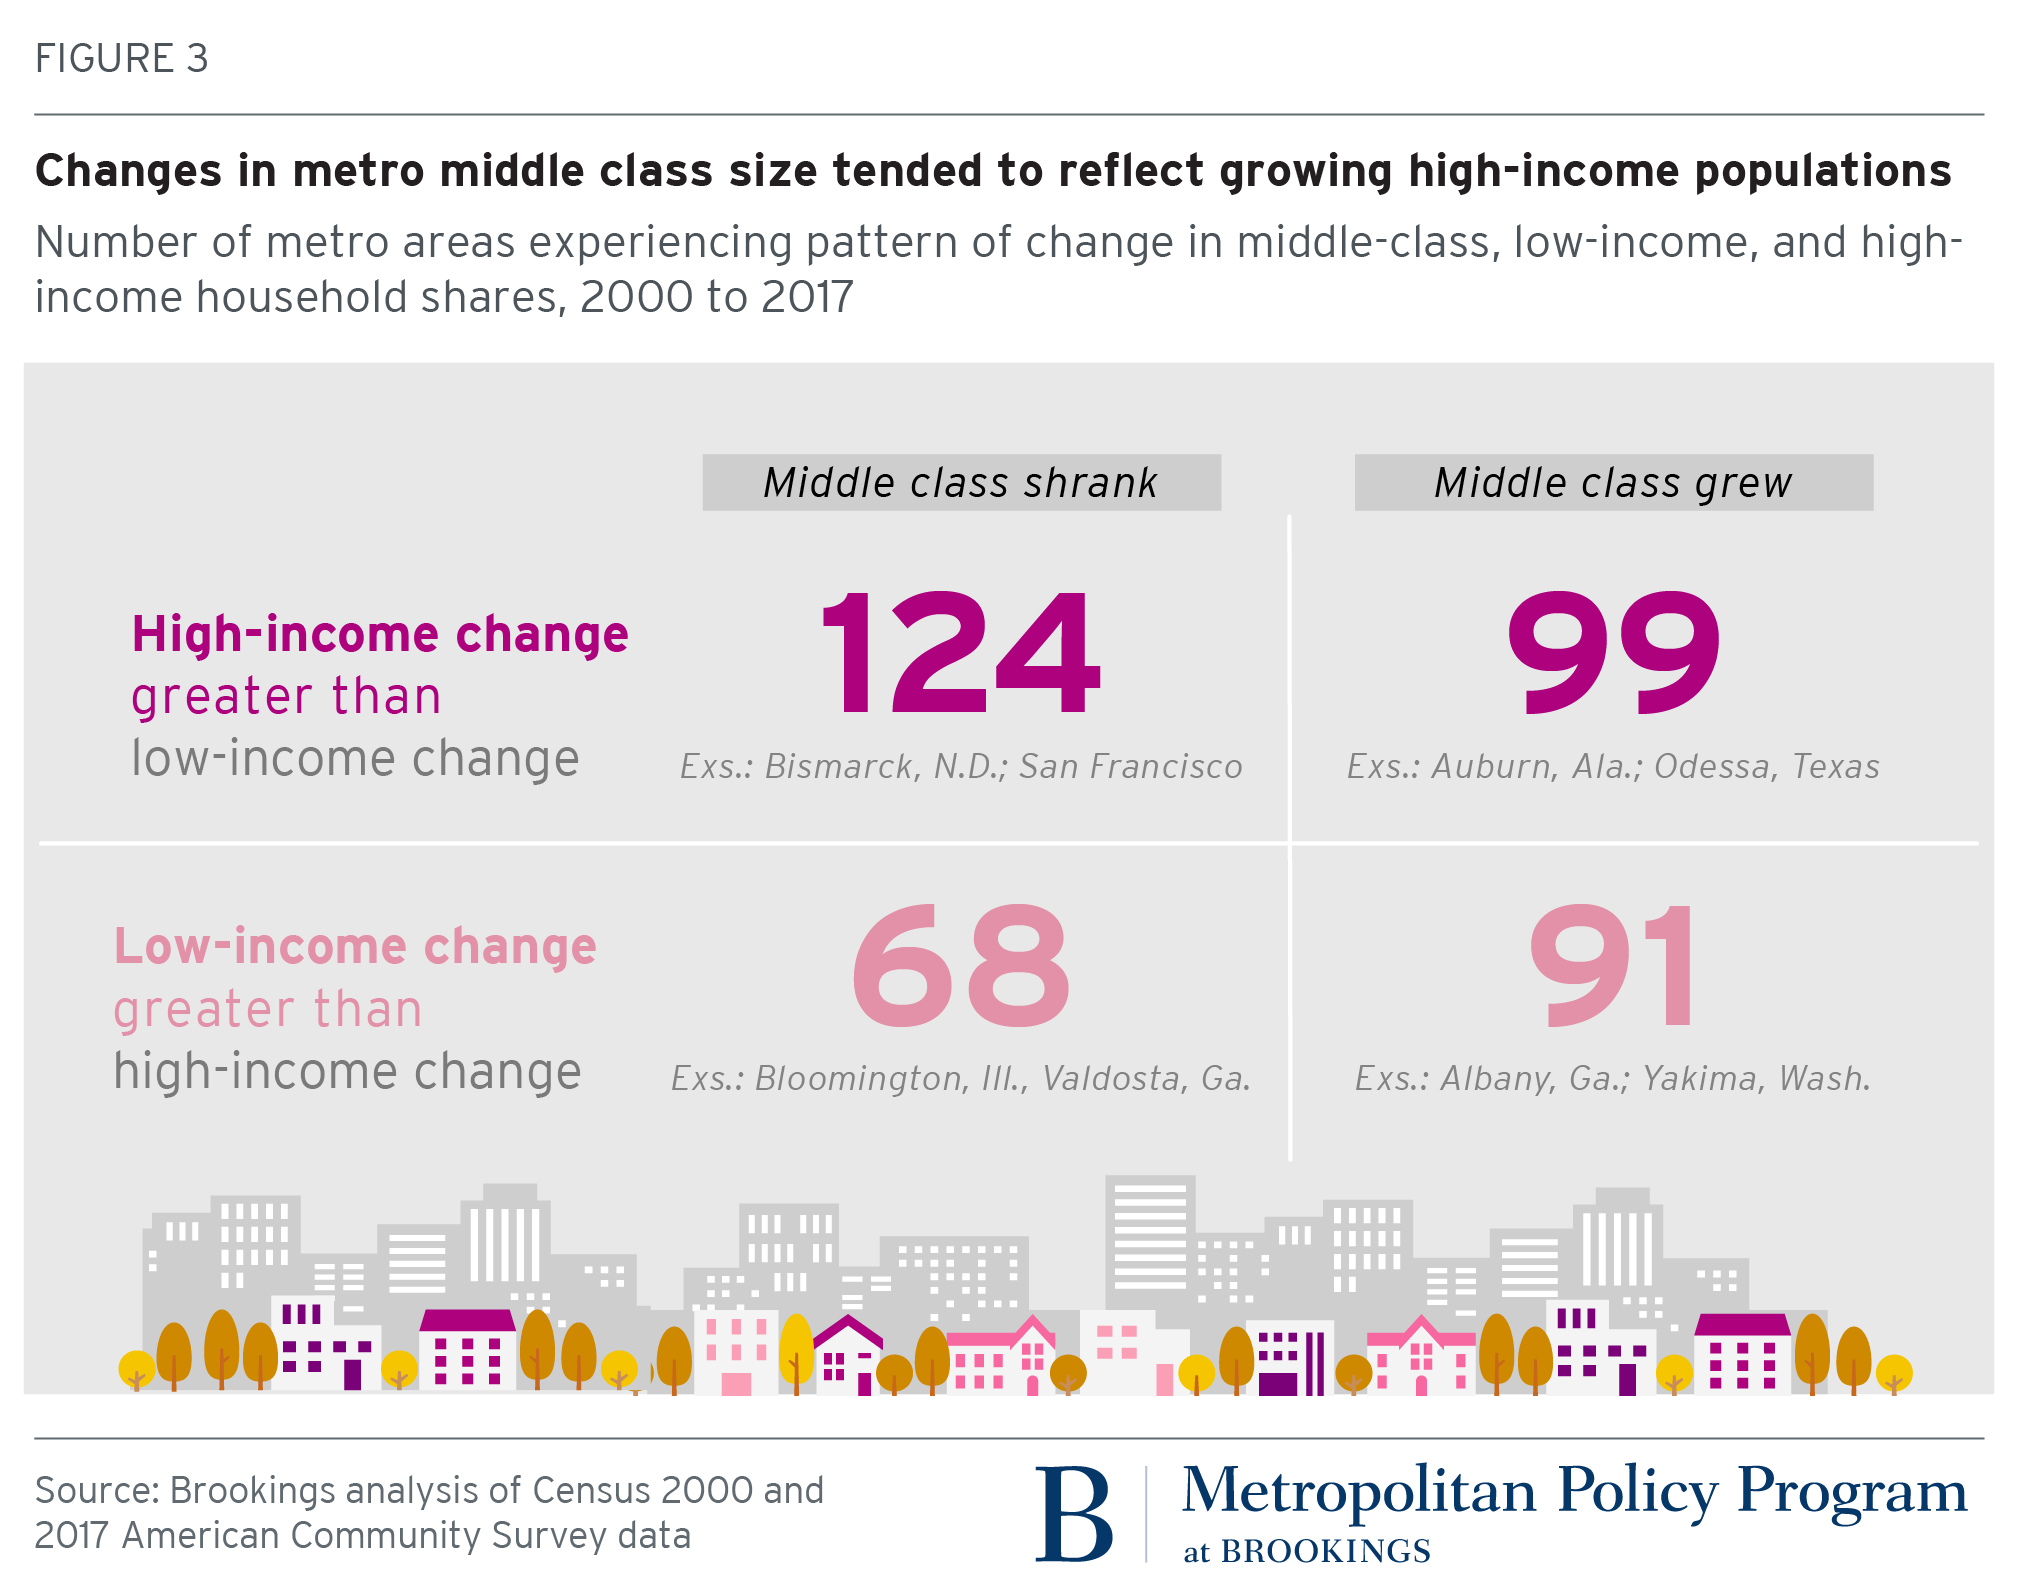
This middle-class rubric suggests a positive story overall for metro areas. Still, it provides a somewhat incomplete view of metropolitan economic change. A more frequently used measure of local economic progress is change in median household income, or the income earned by a household in the exact middle of the income distribution for that place. From 2000 to 2017, only one-third of metro areas posted increases in median income. Nearly all of these (120 of 124) were in the top two quadrants of Figure 3. Relative to other metro areas, those places in which high-income household change exceeded low-income household change did better.
How could a metro area’s median income decline while its income distribution appears to trend upward? The definition of middle class used here represents a large share of the overall income distribution (60 percent nationally). If incomes in the middle of the distribution decline over time, but not to the extent that more households fall into the bottom 20 percent, the middle class may not change in size even as its economic health deteriorates.
Patterns of growth and decline in metro areas’ middle classes from 2000 to 2017 seemed more likely to reflect positive than negative momentum for local households.
Consider the Appleton, Wisc. metro area. The share of its households in the middle class declined by about 5 percent from 2000 to 2017, while its high-income household share expanded by more than its low-income household share (3 percent versus 2 percent). Yet Appleton’s median household income dropped by 11 percent during that period. It could be that the region lost jobs that paid upper-middle-class wages (e.g., in manufacturing), and gained jobs that paid lower-middle-class wages (e.g., in administrative services).
Changes in the distribution of income within a metro area, and in the size of the middle class specifically, shed important light on local economic health. But within that distribution, changes in the economic status of middle-class households themselves are critical markers of well-being, too.
What the middle class in metro areas tells (and doesn’t tell) us
As is true with most socioeconomic phenomena, how we choose to define the middle class has important implications for what we conclude about it. The definition employed here is an expansive one; it includes three in five households nationwide. A narrower definition, one anchored more strongly to local conditions, or one based on a concept other than income (e.g., occupation or educational attainment) might yield a different geography of the American middle class. This approach nonetheless suggests a few important takeaways about where the middle class lives, how that may be changing, and what it means:
- The presence of the middle class varies considerably across U.S. metro areas. National policies aimed at improving the conditions of the middle class, and helping more people rise to join its ranks, will thus impact metropolitan areas differently. In this way, “people-based” interventions (like the Earned Income Tax Credit or Medicaid) have important placed-based effects.
- Some factors associated with the local size of the middle class are relatively fixed. For instance, newer metropolitan areas in the South and West developed as larger, more suburban places that incorporate more middle-class communities than older metro areas in the Northeast and Midwest. Regional benchmarks could be more useful than national ones in assessing the size of a given metro area’s middle class.
- As other local factors change over time, they may change the size of the middle class with them. Certain aspects of metro areas’ demographic and industrial structures are closely associated with the presence—or absence—of the middle class. These associations may help local policymakers better understand the sectors most likely to provide middle-class jobs, or the population groups most likely to hold them.
- Middle classes have grown and declined in metro areas over time—often by considerable degrees—but have done so for very different reasons. To the extent the American middle class possesses a common set of assets, and faces a common set of challenges, changes in the size of the middle class locally over time may bring those assets and challenges into sharper or weaker focus. Yet researchers and policymakers should more deeply examine middle-class conditions at the local level to truly understand and improve middle-class resilience.
Rhetorical references to the American middle class, and particularly its economic plight, tend to evoke small towns characterized by a homogeneous economy and monochromatic demography. This analysis makes clear that the geography of the middle class, and the factors associated with its local presence and well-being, are as diverse and complex as the American landscape itself.
Related Content


Author

-
Footnotes
- Following other researchers (see, e.g., this Pew report), the analysis adjusts national thresholds based on the ratio of the inverse of the square root of average household size at the national level to that at the metropolitan level. This reduces the income thresholds for the middle class by as much as 11 percent in The Villages, Fla., and raises them by as much as 21 percent in El Centro, Calif.
- This analysis does not report margins of error for the middle class estimates provided, nor does it test the statistical significance of changes across time. As such, readers should not regard small reported differences among places, and modest reported changes in middle class size over time, as particularly salient. This is one reason the analysis focuses on metro areas at the extremes of the distribution.
- This list of metropolitan areas with the largest and smallest middle classes closely mirrors results from the Pew Research Center’s recent analysis of the middle class, which defines middle-class households as those with incomes between two-thirds and twice national median income, adjusted for regional price differences and household size.
The Brookings Institution is committed to quality, independence, and impact.
We are supported by a diverse array of funders. In line with our values and policies, each Brookings publication represents the sole views of its author(s).