
The following brief is part of Brookings Big Ideas For America—an institution-wide initiative in which Brookings scholars have identified the biggest issues facing the country and provide ideas for how to address them. (Updated January 27, 2017)

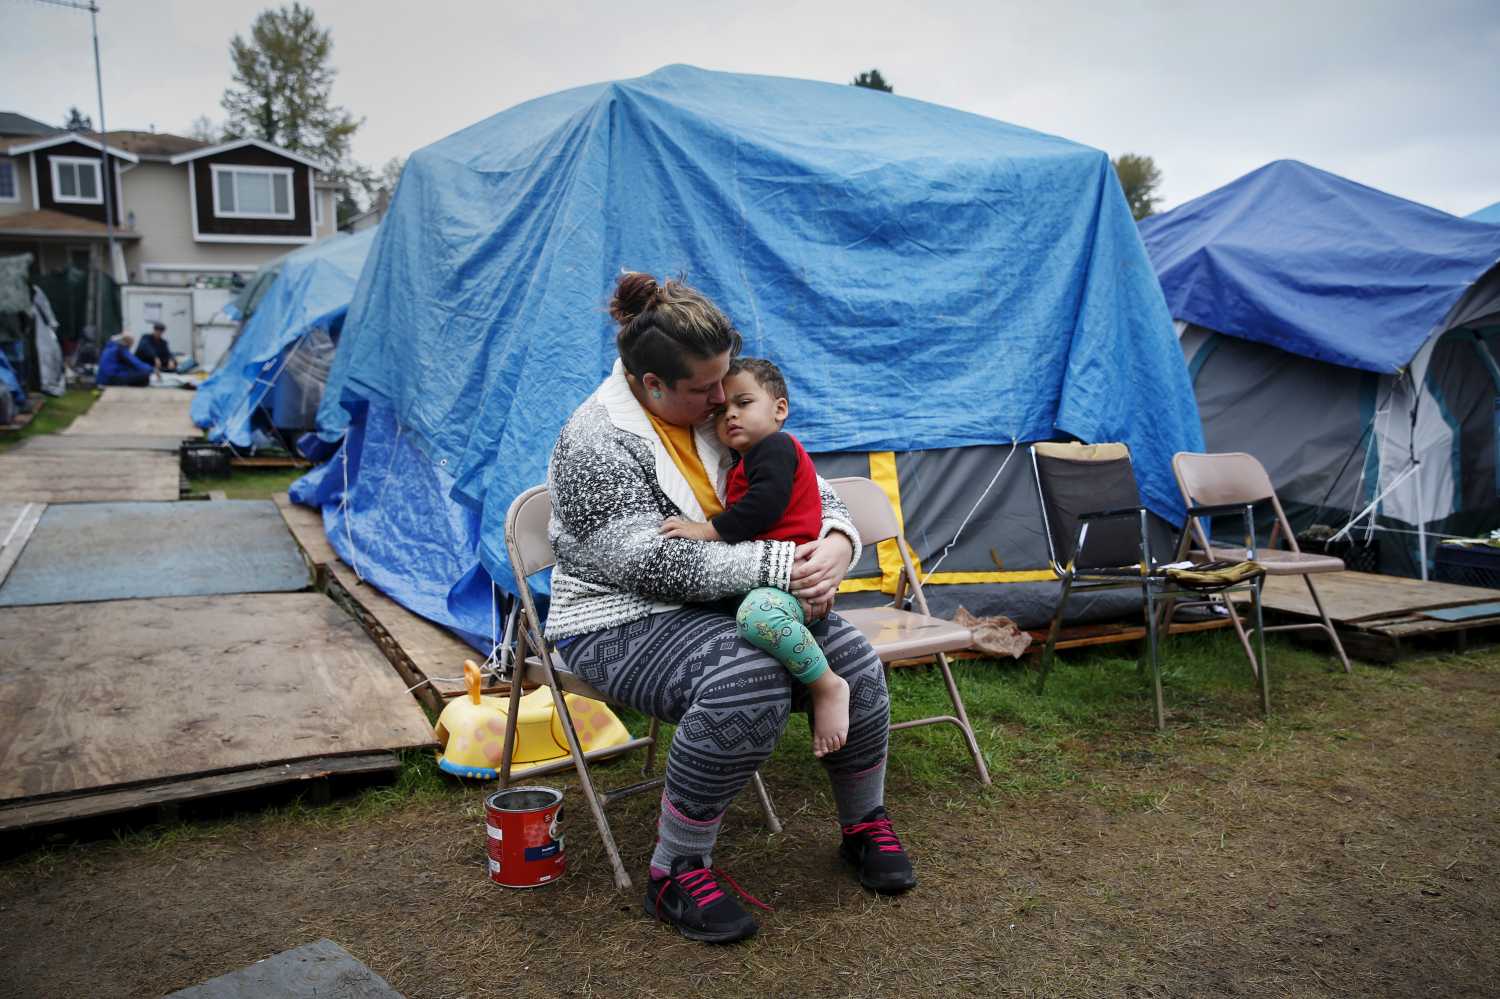
According to most observers, the 2016 election is one of the most unusual in decades. In large part this is due to the anti-establishment and unpredictable nature of the Republican president-elect, which has wreaked havoc within the party. More fundamentally, though, the surprising level of political support for a populist platform rife with nativism, racism, and unrealistic proposals has exposed deep divisions in our society, as well as pockets of extreme desperation. Most notably, it is not minorities who have traditionally been discriminated against who are unhappy, but rather poor and uneducated whites who live primarily in suburban and rural areas in the heartland. This desperation is most starkly reflected in rising mortality rates among middle-aged uneducated whites, driven by preventable deaths such as suicides and opioid poisoning.
This is a social crisis with multiple and complex causes, not all of which we fully understand. We do know that it is dividing our society and polity in damaging ways. The next president must find ways to address it. There are no magic bullet solutions, which makes it more difficult to attract limited resources and craft policies to solve the problem. An important first step will be to document the extent of the crisis and to strive to better understand its causes. Our research—based on metrics of well-being, such as life satisfaction and hope for the future on the one hand, and stress, worry, and pain on the other—could be a useful starting point.
We found marked differences in life satisfaction, hope for the future, and stress across poor blacks, Hispanics, and whites living in metropolitan areas.
In November 2015 Anne Case and Angus Deaton published a study showing a marked increase in the all-cause mortality of high school (and below) educated white middle-aged non-Hispanic men and women between 1999 and 2013.1 The change reversed decades of progress in mortality; it is unique to the United States and to non-Hispanic whites in particular. The change in the mortality rate trajectory was driven by drug and alcohol poisoning, suicide, chronic liver diseases, and cirrhosis. Those respondents with the least education saw the greatest increases in these diseases. Self-reported health, mental health, and ability to conduct activities of daily living in this group also saw a marked decrease and also suggest growing stress in this cohort.
At the same time that the mortality data were released, our research, based on extensive Gallup data for approximately 600,000 respondents in American metropolitan statistical areas (MSAs), exposed some stark trends and markers. We found marked differences in life satisfaction, hope for the future, and stress across poor blacks, Hispanics, and whites living in metropolitan areas.2 Our econometric analysis included an array of widely used socioeconomic and demographic controls. These include age, gender, education, income, and employment status, as well as religion and place of residence, among other things. Among the poor, controlling for sociodemographic factors, blacks are by far the most optimistic cohort, and are close to three times more likely to be higher up on the optimism scale than poor whites (figure 2.1). Poor Hispanics also fared better than poor whites although the differences are less marked.

Large differences exist across races in stress, an important marker of ill-being (figure 2.2). Poor whites are the most stressed group and are 9 percent more likely to experience stress in the previous day than middle-class whites. Poor blacks are 47 percent less likely to experience stress than poor whites (that is, their odds of experiencing stress are roughly half those of poor whites), a difference between blacks and whites that remains constant over the other income groups as well.

There are many explanations for these findings. One is gradual, hard-fought progress by minorities, accepting that challenges remain. Meanwhile poor whites have fallen in status in relative terms, as competition for low-skilled jobs has intensified. Blacks in general have improved their status and well-being, and wage and education gaps have narrowed. Black males earned 69 percent of the median wage for white males in 1970 and 75 percent by 2013.3 And while the gaps in education achievement and proficiency have widened across income groups, they have narrowed between blacks (and Hispanics) and whites at the same time. Fifty years ago, the proficiency gap between black and white children was one and a half to two times as large as the gap between a child from a family at the top 90th percentile of the income distribution and a child from a family at the 10th percentile. Today that has reversed, and the proficiency gap between poor and rich children is nearly twice as large as that between black and white children.4
Gaps in health status and life expectancy between blacks and whites, while still significant, have also narrowed. The gap in life expectancy between whites and blacks was seven years in 1990 (69.1 years for blacks versus 76.1 years for whites); by 2014 it had narrowed to three years (75.6 versus 79.0 years). Servin Assari and colleagues show that while black Americans have worse health indicators than white Americans on average, they (and minority groups in general) are better off in terms of mental health. Depression, anxiety, and suicide are all more common among whites than blacks.5

Assari and colleagues highlight higher levels of “resilience” among blacks and other minorities as an explanation. Resilience—defined as maintaining health in spite of a range of psychosocial risk factors—may be higher among blacks and minorities as they have had more experience with adversity. Community and religious factors may also be at play; a simple cross-tabulation of our data shows that blacks are the most likely of all racial groups to report that religion is important in their lives. This is corroborated by any number of accounts of the role of religion and community in African Americans’ lives. While we control for religion in our analysis, so that it is not driving the optimism scores of our respondents, there are likely a number of indirect ways in which it still affects the lives—and optimism—of African Americans more generally.
A recent study by Andrew Cherlin (2016) found that poor and middle-class blacks are more likely to compare themselves to parents who were worse off than they are when they are assessing their status.
These trends contrast sharply with the past experiences of whites in general. Paul Krugman notes that the economic setbacks of this group have been particularly bad because they expected better: “We’re looking at people who were raised to believe in the American Dream, and are coping badly with its failure to come true.” A recent study by Andrew Cherlin found that poor and middle-class blacks are more likely to compare themselves to parents who were worse off than they are when they are assessing their status. In contrast, poor and blue-collar whites, on average, have more precarious lives and employment stature than their parents did.6
Raj Chetty and colleagues, meanwhile, find that there are very strong geographic markers associated with these trends.7 Mortality rates and the associated behaviors are particularly prevalent in rural areas in the Midwest and much less in cities. In part this is due to healthier behaviors associated with living in cities, such as more walking, and in part it is due to the combination of social isolation and economic stagnation that characterizes many of these rural locales. Krugman also notes the regional dimension to these trends: life expectancy is high and rising in the Northeast and California, where social benefits are highest and traditional values weakest, while low and stagnant life expectancy is concentrated in the Bible Belt (where economies are more stagnant as well).7
Ongoing Research
The mortality data and our well-being metrics highlight a paradox of rising well-being and improving health among minorities juxtaposed against the opposite trend among uneducated whites. We are exploring the extent to which our markers of well- and ill-being have a statistically robust association with the trends in mortality. We are doing this by matching our metrics with MSA data on mortality from the Centers for Disease Control and Prevention (CDC). Our preliminary results suggest that in addition to the differences across races, there are also important differences across place, which are reflected in differences in racial diversity and in health behaviors such as exercising and smoking.
Related Content


We focus primarily on 103 MSAs for which sampling weights are available in all years of the Gallup data (2010–14) and which broadly correspond to the above 600,000 inhabitants. MSAs include relatively large urban and suburban areas; rural and micropolitan areas are comparatively sparser (there are approximately 800,000 observations for the MSAs, with over 600,000 corresponding to the 103 MSAs mentioned above, and just over 200,000 for rural and micropolitan areas).8 We do not yet have the fully disaggregated CDC data, but were able to compute a composite measure that includes suicides, liver disease, accidental poisoning, and indeterminate deaths, and aggregate it up to the MSA level.9 Our regressions include the usual controls for age, income, gender, education, employment, religion, and health status; we also include race and then race and income interaction terms, as above
When we look at individual level well-being (and ill-being) markers and include MSA-level variables alongside the controls indicated above, we find that MSA-level mortality rates for those 45 to 54 years old are negatively correlated (for example, negatively associated) with optimism about the future. In addition, our regressions include a variable measuring reported pain, which Case and Deaton found to be correlated with suicide rates at the state and county level.10 Pain is, not surprisingly, negatively correlated with life satisfaction and with optimism about the future, and positively correlated with stress. Our general results, though, hold whether or not we include pain. When comparing MSA with non-MSA areas, a simple cross-tabulation of our Gallup data for white low-income individuals is suggestive. We find that reported pain is higher in rural areas than in MSAs, and optimism about future life satisfaction is significantly lower (figure 2.3).
We also looked at average level MSA trends, with a focus on the role of place. When we looked at average levels of life satisfaction, future life satisfaction, and stress across MSAs, we find that all-cause mortality rates for 45–54-year-olds are negatively correlated with life satisfaction and positively correlated with stress. We find that percent of smokers per MSA is negatively correlated with life satisfaction and positively correlated with stress, while percentage of respondents who exercise is positively correlated with future life satisfaction and negatively correlated with stress. Our markers for overweight and obesity were insignificant, likely due to the inclusion of the exercise variable.
We also explored racial diversity as a characteristic of place, positing that there may be more social interactions in more diverse places. We find that the share of Hispanics per MSA is positively correlated with life satisfaction, while the share of blacks is positively correlated with future life satisfaction/optimism.11
Our research is still in progress, and we are hoping to have more fine-grained cohort and zip code level findings going forward. Yet even at this juncture, in addition to our strong findings on poor black and Hispanic optimism juxtaposed against poor white desperation, our data link robustly to patterns in mortality rates. It is not just a question of race and income, but also about place, with those places that are more racially diverse and where respondents engaged in healthier behaviors are also happier, more optimistic, and less stressed, all of which are markers of longevity and productivity in most places where well-being has been studied.12Policies? Solutions?
What can be done in terms of policy? There is a clear need to restore hope and sense of purpose to places characterized by desperation and premature death, but it is not obvious how to do so. The solution will be multifaceted and should include a major effort to introduce healthier behaviors, focusing attention on premature mortality within those places. We also need to revisit the nature and reach of our safety nets. It is notable that when comparing the United States to other rich countries, those at the median and top of the U.S. distribution score higher in terms of absolute income, but the poor score worse than the poor in other rich countries.13
There has been some progress in recent years, and the new Census data, released in September 2016, showed that median incomes rose by 5 percent on average across the country, and that poverty rates fell.
There has been some progress in recent years, and the new census data, released in September 2016, showed that median incomes rose by 5 percent on average across the country, and that poverty rates fell. Safety net programs such as the Earned Income Tax Credit (EITC) played an important role on the latter front.14 While the EITC is very effective for working families, it is less so in isolated areas where employment opportunities have hollowed out—in other words, in the deepest pockets of desperation where mortality trends are most troubling. Anecdotal evidence suggests that these same places have low rates of Internet access, precisely at a time that the Internet is an increasingly important means to access safety net programs. This is an additional barrier for those who live in remote towns far from program administrative locales.
The reach of safety net programs across states is highly uneven. While the EITC has grown in importance in past decades, Temporary Assistance for Needy Families (TANF), the program that provides cash assistance to needy families, has been cut in many states, particularly Republican ones.15 In the United States, continued reliance on food stamps as a means to assist the poor, while providing material assistance to the poor, is of questionable effectiveness on other fronts. Not only do food stamps stigmatize the poor, but obesity rates are higher among Supplemental Nutrition Assistance Program (SNAP) recipients than among non-SNAP recipients.16 This stands in sharp contrast to the progress many countries—particularly in Latin America—have made in reducing poverty and improving health indicators with conditional cash transfer programs, which provide the poor with non-marginal cash transfers on condition that they send their children to school and to the health center.17 Much of U.S. political dialogue stigmatizes recipients of welfare assistance, meanwhile, and the bureaucracies that administer it are particularly unfriendly and difficult to navigate, in sharp contrast to the efficient, semi-private bureaucracies that administer universal programs like Social Security and Medicare.
Related Books
There are, no doubt, many other possible solutions, many of which are complex and long term in nature. Among these are improvements in education, vocational training, and possible incentives to relocate for some cohorts. The increasing number of 25–54-year-old men without work, which Nicholas Eberstadt projects will reach 25 percent of that cohort by mid-century, requires particular focus.18 The men-without-work trend is in large part driven by the shrinking pool of low-skilled jobs and technology-driven growth and is likely to add to the growing unhappiness of uneducated, low-skilled citizens. There are also medical aspects to the solution. In addition to introducing healthier behaviors, we must address the manner in which opioids and other drugs are made easily available. And while the starkest trends in terms of lack of hope and mortality incidence are among poor whites, policies directed at improving opportunities and well-being of low-skilled workers should also benefit poor minorities whose challenges continue to merit sustained attention.
An immediate priority is to get a better handle on the causes of the problem. This will include listening to what desperate people themselves have to say, as well as learning from those who have shown more resilience when coping with crisis. Well-being metrics can play a role in this effort, for example by undertaking regular polling to gauge life satisfaction, optimism, pain, stress, and worry across people and places. Other countries such as the United Kingdom are already collecting these metrics annually. Reporting on the patterns and trends more regularly in public and policy discussions would be a simple and inexpensive way to monitor the well-being and ill-being of our society. It certainly seems a better path than waiting for mortality rates to sound the alarm bells.
Authors

-
Footnotes
- A. Case A. and Deaton, “Rising Morbidity and Mortality in Midlife among White Non-Hispanic Americans in the 21st Century,” Proceedings of the National Academy of Sciences 112, no. 49 (2015): 15078–83. Some recent work by Gelman and Auerbach suggests that these trends are driven in part by aggregation bias at the older ages of the 45–54 cohort, driven by the baby boomers, and that they are mainly driven by white women. See A. Gelman and J. Auerbach, “Age Aggregation Bias in Mortality Trends,” Proceedings of the National Academy of Sciences 113, no. 7 (2016): E816–E817.
- These initial findings are in Carol Graham, Happiness for All? Unequal Hopes and Lives in Pursuit of the American Dream (Princeton University Press, forthcoming). Graham is an academic adviser to Gallup and as such has access to the data. Our measure of optimism is a question that asks respondents where on a 0–10 scale they think their life satisfaction will be in five years.
- A notable caveat is that most of the gains were made in the earlier decades. “Current Population Survey,” 2014, U.S. Census Bureau (www.census.gov/people/households/currentpopulationsurvey).
- E. Porter, “Education Gap Widens between Rich and Poor,” New York Times, September 23, 2015: B1.
- S. Assari and M. Lankarani, “Depressive Symptoms Are Associated with More Hopelessness among White than Black Older Adults,” Frontiers in Public Health 2016 (April 4): 82.
- P. Krugman, “Despair, American Style,” New York Times, November 9, 2015: A19; and A. Cherlin, “Why Are White Death Rates Rising?” New York Times, February 22, 2016.
- Krugman, “Despair, American Style.”
- In practice, the smallest MSA has 12,000 people and the largest has just over 200,000. As such there is some overlap with the smaller MSAs (about 40 percent with less than 200,000 people). The number of observations for MSAs and rural and micropolitan areas indicated refer to those without missing observations for any of our variables of interest.
- We used the publicly available CDC data, which impose significant limitations. For a substantial number of less populated counties, data are unavailable (due to privacy restrictions), which can introduce a bias into our composite measure. Similarly, we are unable to introduce the corrections suggested by Gelman and Auerbach, “Age Aggregation Bias in Mortality Trends.”
- A. Case and A. Deaton, “Suicide, Age, and Wellbeing: An Empirical Investigation,” Center for Health and Wellbeing, Princeton University (June 2015).
- Our population shares by race here are based on the percent of respondents in the Gallup survey; we will benchmark these against the population distribution in the American Community Survey (ACS) going forward.
- C. Graham, “Happiness and Health: Lessons—and Questions—for Policy,” Health Affairs 27, no. 2 (2008): 72–87; C. Graham, A. Eggers, and S. Sukhtankar, “Does Happiness Pay? An Initial Exploration Based on Panel Data from Russia, Journal of Economic Behavior and Organization 55 (2004): 319–42.
- See www.demos.org/blog/1/5/15/when-it-better-not-be-america.
- D. Trisi, “Safety Net Cut Poverty Nearly in Half Last Year,” Center on Budget and Policy Priorities Blogs, September 14, 2016; and D. Trisi, “Three Essays on the State of the U.S. Safety Net,” PhD dissertation, University of Maryland, College Park, 2016.
- Ibid.
- A. Carroll, “Limiting Food Stamps Choices May Help Fight Obesity,” New York Times (The Upshot), September 27, 2016.
- Nora Lustig, Carola Pessino, and John Scott, “The Impact of Taxes and Social Spending on Inequality and Poverty in Argentina, Bolivia, Brazil, Mexico, Peru and Uruguay: An Overview,” CEQ Working Paper No. 13, Center for Inter-American Policy and Research and Department of Economics, Tulane University, and Inter-American Dialogue, August 2013.
- N. Eberstadt, Men without Work: America’s Invisible Crisis (West Conshohoken, Pa.: Templeton Press, 2016).
The Brookings Institution is committed to quality, independence, and impact.
We are supported by a diverse array of funders. In line with our values and policies, each Brookings publication represents the sole views of its author(s).