

This post updates with complete year-end 2023 data the External Wealth of Nations database [Excel download], which assembles data on external claims and liabilities of economies around the world. The database is described in more detail in a series of papers (Lane and Milesi-Ferretti 2001, 2007, 2018), and in a companion post. The data are annual for the period 1970-2023 and cover 212 countries and territories, plus the euro area and the Eastern Caribbean Currency Union (ECCU). A blog published in October describes the evolution of net creditor and debtor positions during 2023, highlighting the role of rising stock prices, current account imbalances, and inflation in shaping that evolution.
Global cross-border assets and liabilities rose between the end of 2022 and the end of 2023 in nominal U.S. dollar terms and as a share of global GDP. Figure 1 shows this increase for global cross-border assets, dividing countries into three groups: financial centers, advanced economies, and emerging and developing economies. Financial centers are economies for which international financial intermediation (as opposed to end-use of funds) is the main cross-border financial activity. They include large economies such as the United Kingdom, the Netherlands, Switzerland, and Ireland, as well as smaller financial centers such as Luxembourg, Bermuda, and the Cayman Islands.
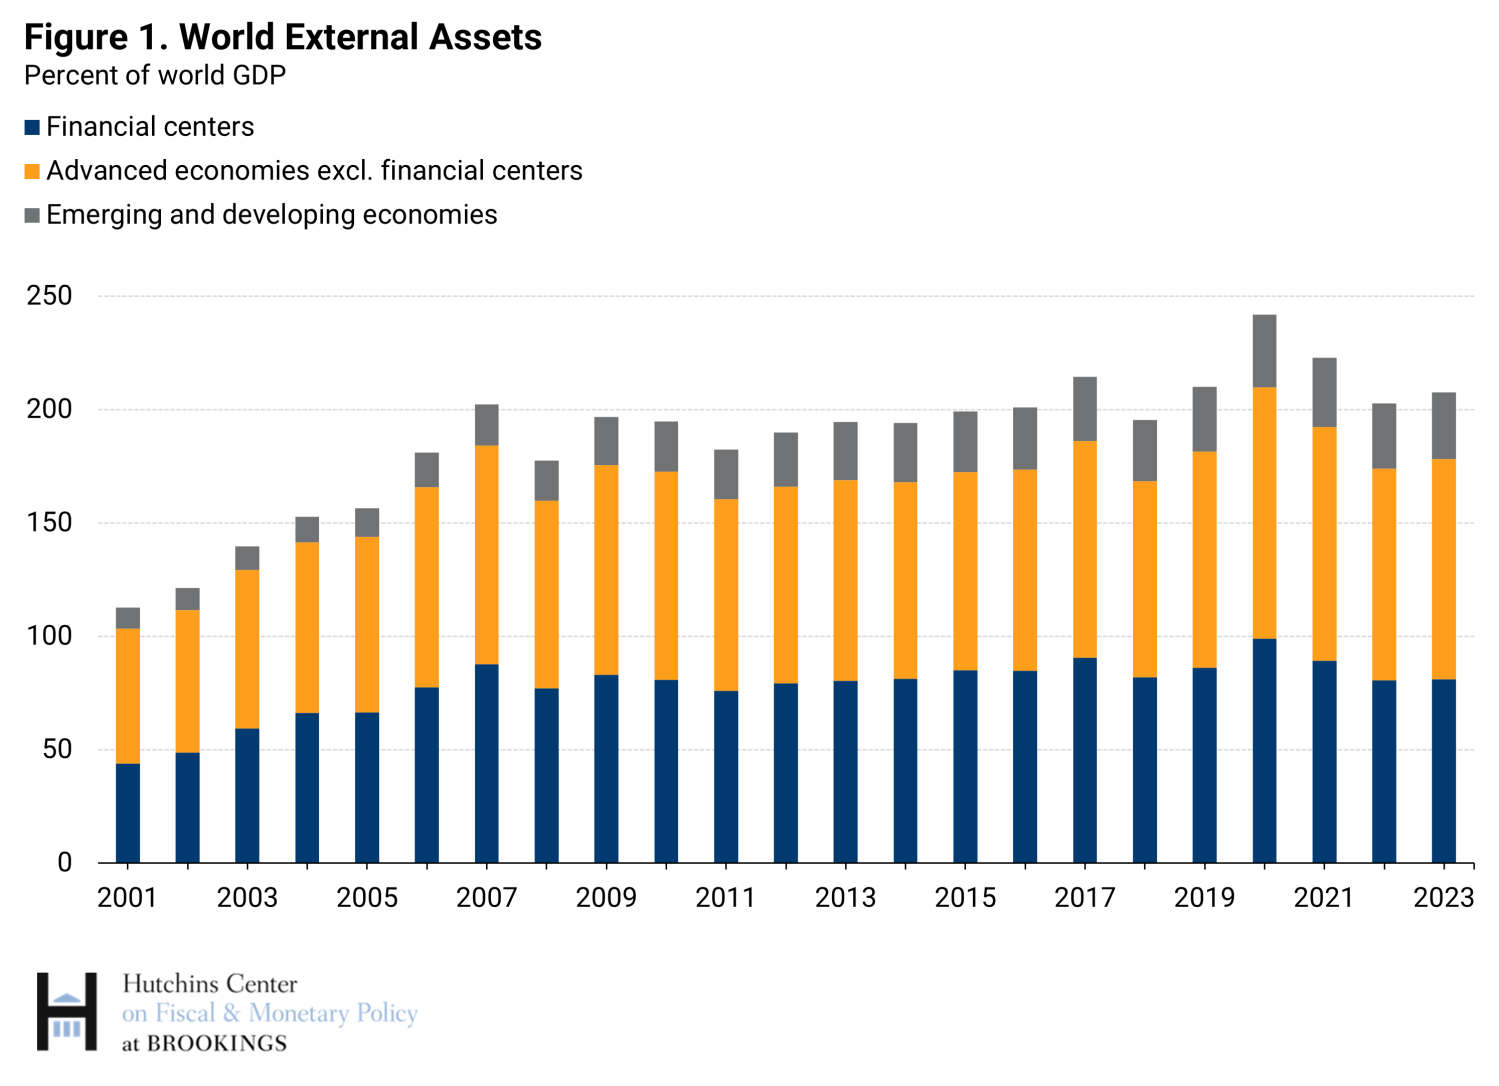
The main factor driving the aggregate increase was the rebound in global stock prices, after their sharp fall in 2022. The stock market rally boosted the valuation of global portfolio equity assets, more than offsetting the persistent weakness in global financial flows, which weighed on the nominal increase in cross-border holdings, and above-trend global inflation, which raised global nominal GDP.
A few additional highlights from this data release:
- The rise of global external assets was driven by portfolio equity positions: global external assets net of portfolio equity were broadly stable as a share of global GDP.
- Portfolio debt holdings recovered somewhat after the 2022 decline triggered by the fall in long-term bond prices.
- Estimates of global portfolio assets were also boosted by a major increase in portfolio assets reported by the Cayman Islands.
- FDI positions as a share of global GDP remained below pre-COVID levels, reflecting both the unwinding of financial vehicles by multinational corporations, and to a lesser extent, weakness in flows to China.
- There was very limited accumulation of reserves in 2023, and the ratio of reserves net of gold to global GDP declined slightly.
Global financial flows
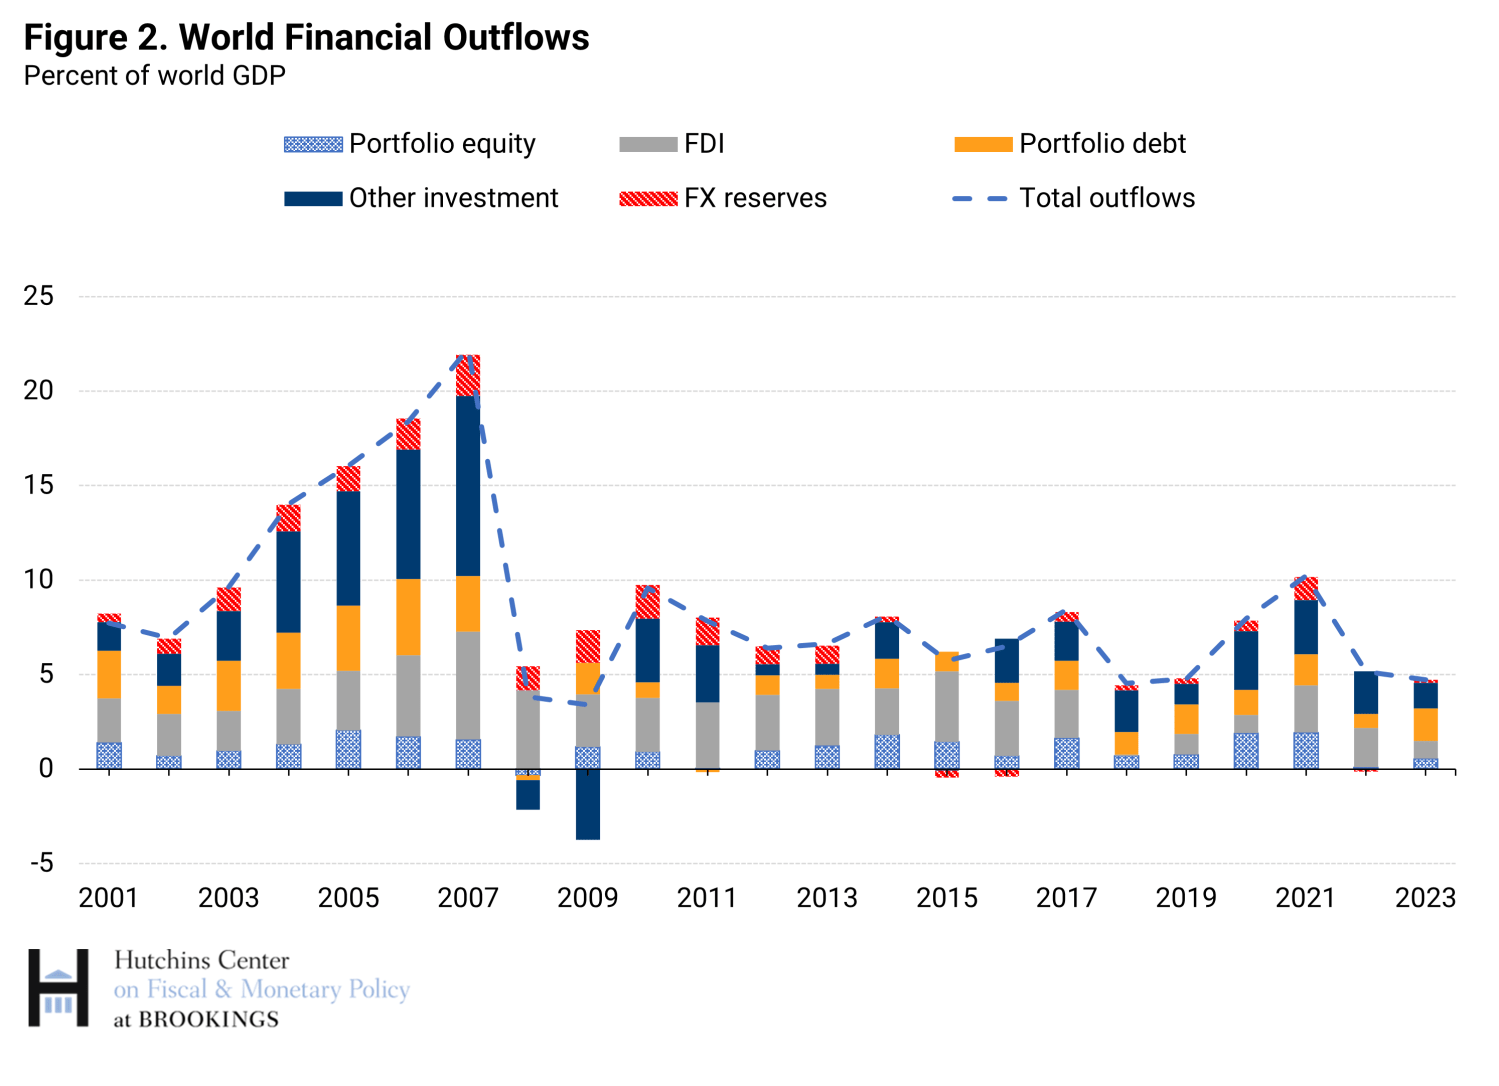
Financial flows in 2023 as a share of global GDP were slightly below their weak 2022 level (Figure 2), and over 2 percentage points below their average since 2010. FDI flows were particularly weak. This reflected to an important extent purely financial operations—namely, a further unwinding of special purpose entities and holding companies domiciled in Luxembourg and the Netherlands. However, a further sharp decline in flows to China contributed to the overall weakness.
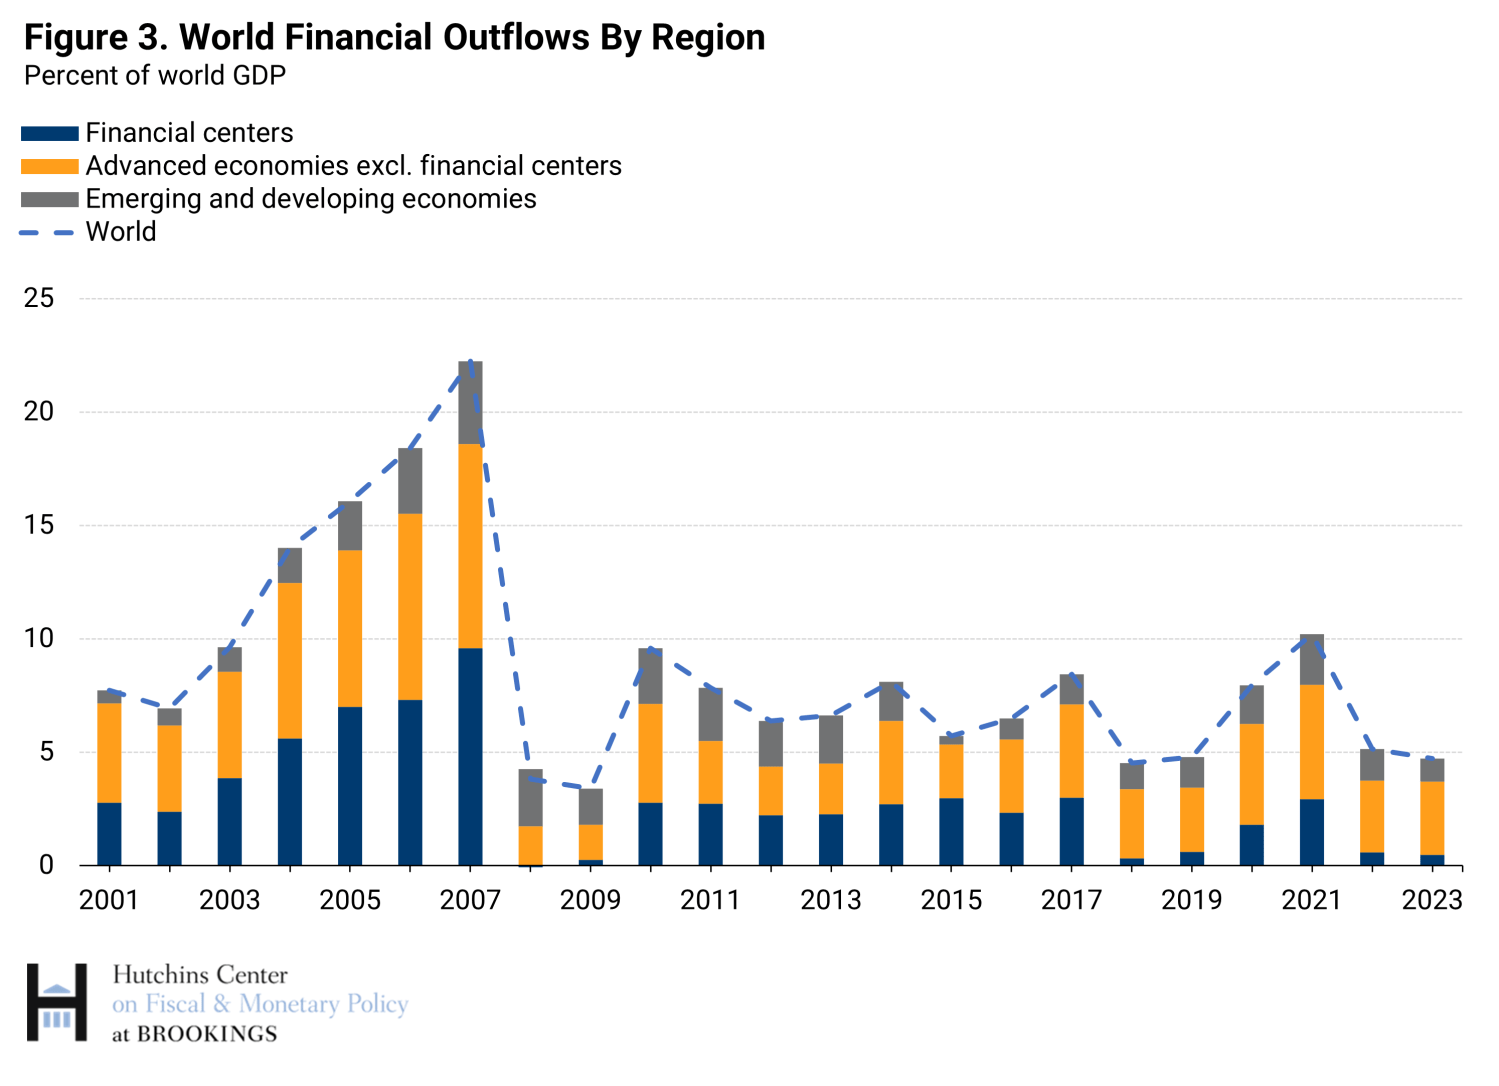
This is also visible in Figure 3, which depicts world financial inflows by region: Flows to financial centers were again very small when compared to previous years and those to emerging markets below their levels during the previous decade.
Global external assets
I now turn to the evolution of global external assets focusing on different asset categories and regional patterns (for discussion of global liabilities, see this blog). There are some structural differences across regions in the composition of external assets and liabilities. For instance, financial centers house an important share of the investment fund industry, whose liabilities are classified as portfolio equity (investment fund shares) but whose assets include not just equity but also bonds and other asset classes. Also, the asset side identifies separately liquid foreign-currency claims of central banks (as foreign exchange reserves), while the bonds and deposits held by central banks are classified as portfolio debt liabilities or other investment liabilities by the destination countries (such as the United States and the euro area). Finally, emerging market economies are generally net receivers of foreign direct investment, while on the asset side their foreign exchange reserves are larger than in most advanced economies, in absolute terms and especially as a share of GDP.
Global FDI
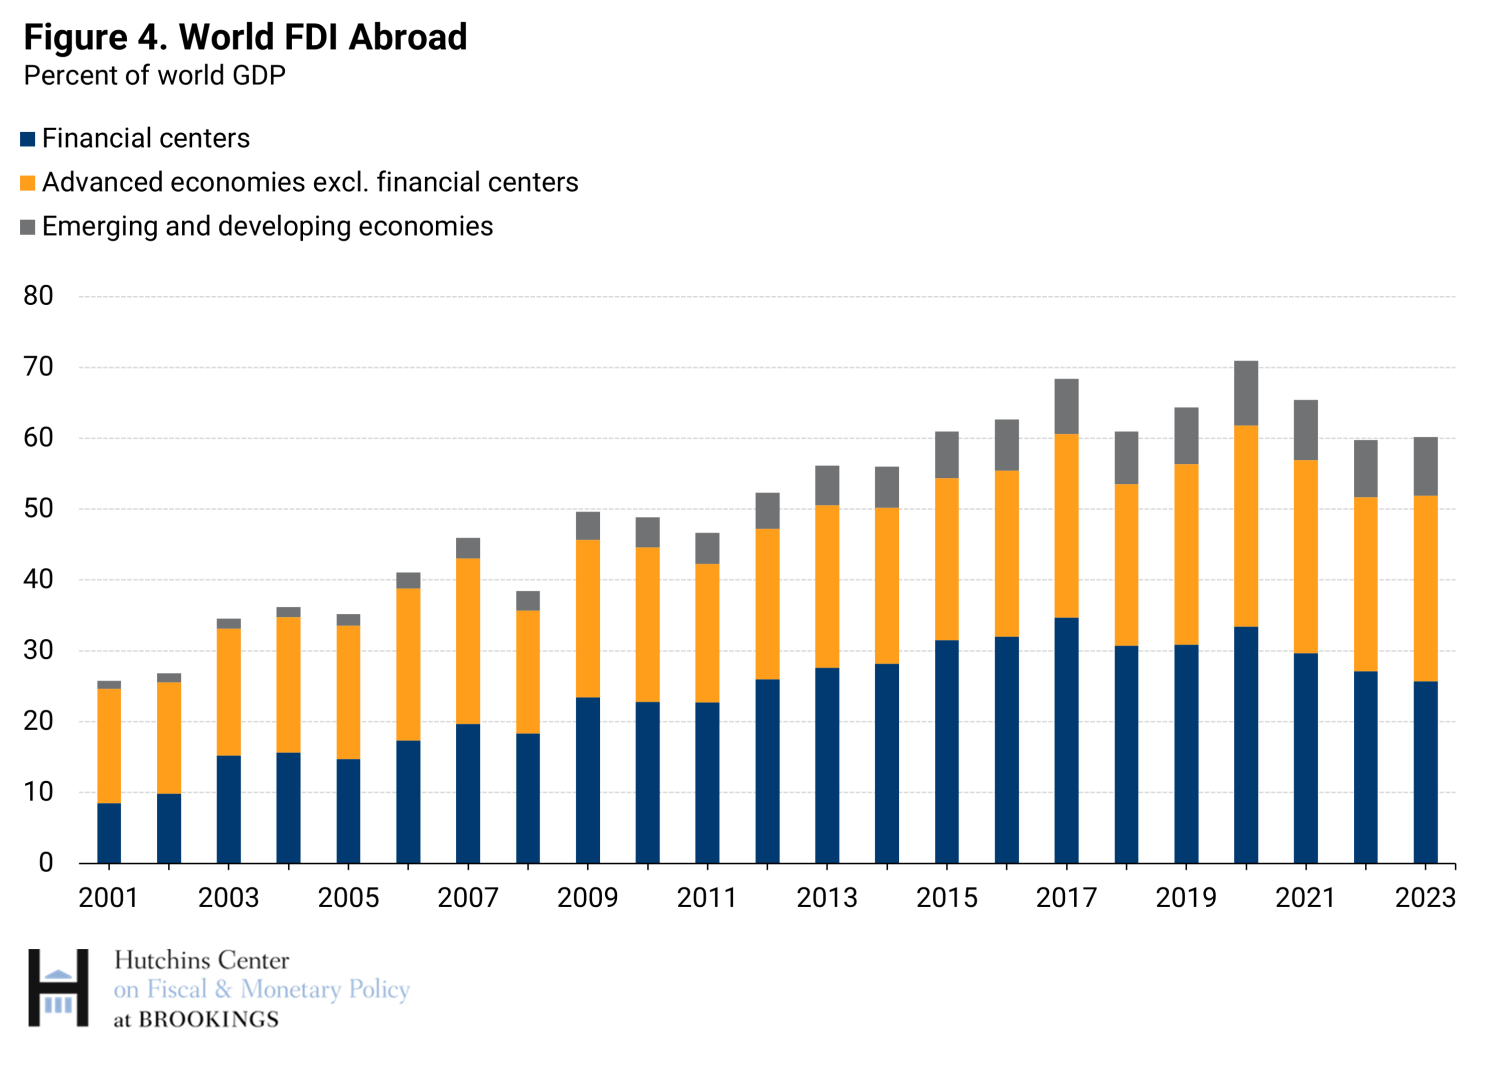
Figure 4 shows global FDI assets by country group, scaled by world GDP. FDI in financial centers (blue bars) is very important because multinational enterprises (MNEs) actively use (mostly financial) subsidiaries in those centers to hold intangible assets such as intellectual property and more generally for tax and regulatory reasons. The sharp decline in FDI positions in financial centers since 2017—by some 9 percentage points of global GDP—reflects to an important extent the unwinding of special purpose entities domiciled in Luxembourg and the Netherlands. This in turn was triggered by the 2017 tax changes in the U.S. as well as pressure to comply with the Base Erosion and Profit Shifting (BEPS) project of the OECD and the G-20. In contrast, FDI abroad by advanced economies excluding financial centers as well as emerging markets and developing economies has increased marginally since 2017 as a ratio of global GDP. At this aggregate level it is more difficult to detect the impact of increased geopolitical tensions and fragmentation on global FDI, which is better studied with more granular data on flows and positions, notably the decline in FDI flows to China ($42 billion in 2023, compared to an average of $240 billion per year during 2010-19).
Global portfolio equity
Portfolio equity assets, depicted in Figure 5, include the shares of foreign firms and foreign investment funds owned by residents. The former include mostly large firms listed in the main world stock markets, while the latter include shares of traditional investment funds, ETFs, as well as hedge funds issued by nonresident entities, regardless of whether such funds ultimately invest in equities, bonds, or other financial instruments. Their global value increased in 2023 by 17% in U.S. dollar terms (reaching $47.6 trillion) and by 4.8 percentage points as a share of global GDP. While portfolio equity flows remained weak, global equity valuations rose sharply, and there was a very large increase in estimated portfolio equity assets of the Cayman Islands compared to 2022, discussed further below.
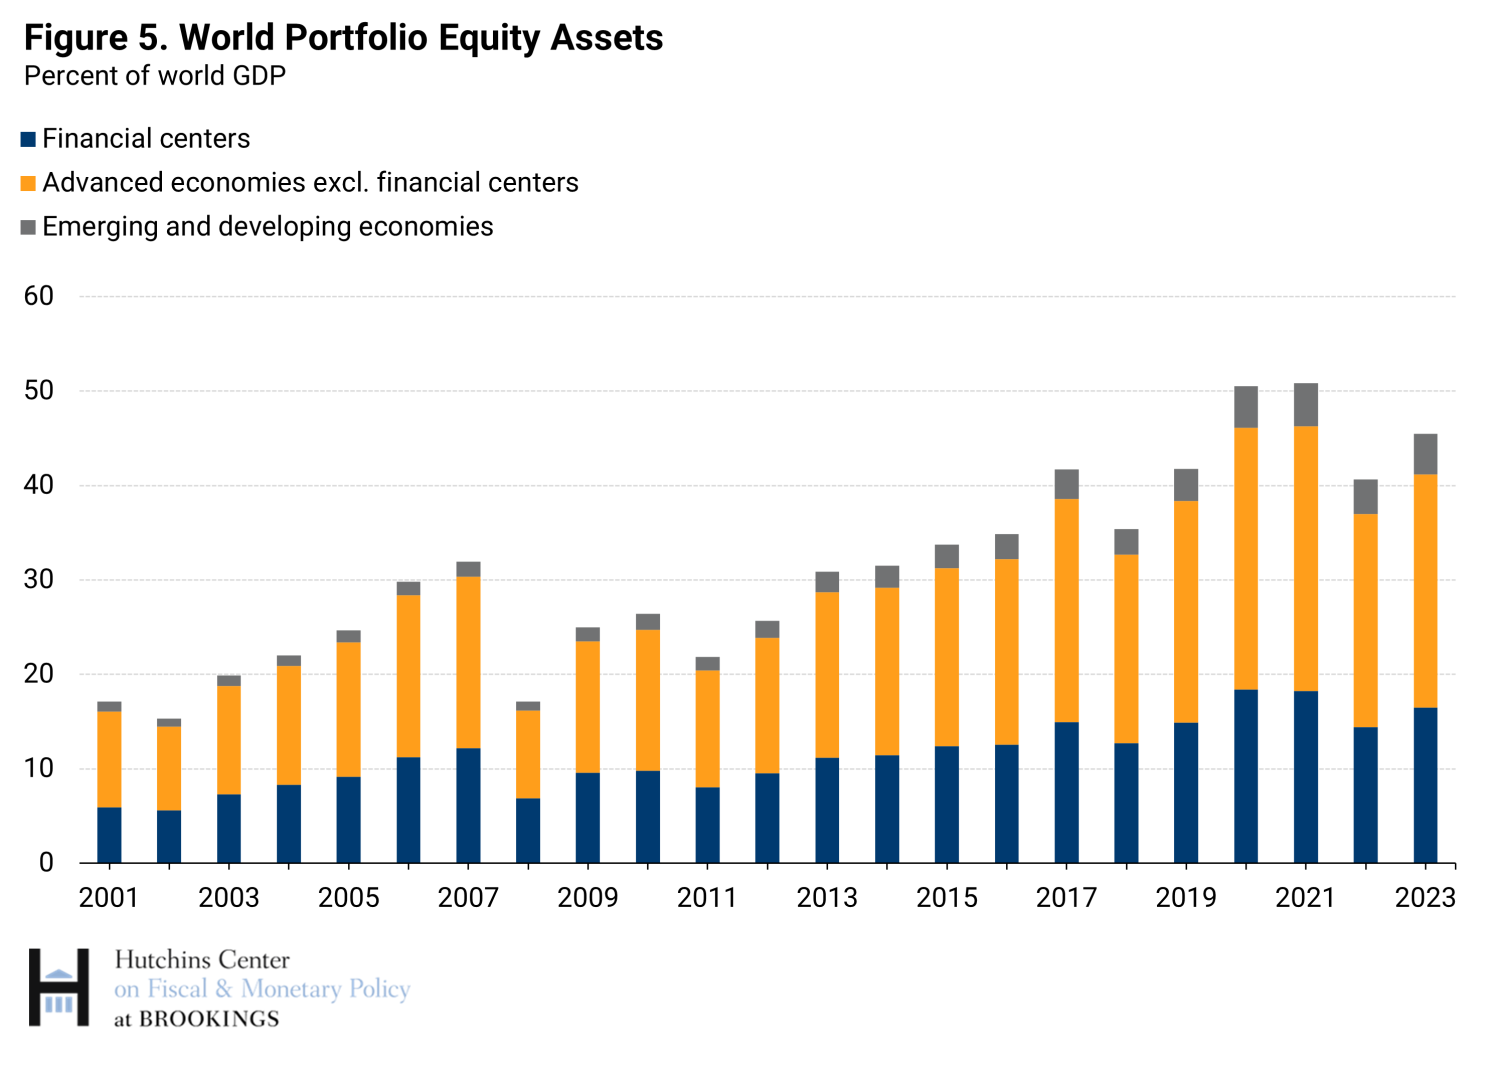
Individual euro area countries and the U.S. together account for slightly over half of world portfolio equity holdings. Among euro area countries the largest holdings are those of Luxembourg and Ireland, financial centers where a significant share of the European investment fund industry is domiciled. These investment funds are important holders of shares issued in other jurisdictions. Within investor economies, institutional investors such as pension funds play an important role.
Estimates of portfolio equity assets published by the Cayman Islands at the end of 2023 were $3.14 trillion, the second largest in the world after the U.S., and $2 trillion higher than the figures published by the same source the year before.1
These higher estimates should reflect increased coverage of investment funds in the underlying data. While they imply a notable underestimate for asset holdings in preceding years, revised pre-2023 data are not yet available. This revision is also a good illustration of how sizable data gaps in cross-border reporting of assets and liabilities are. In this paper, I discuss in particular “missing equity assets”—the sizable discrepancy between estimates of global portfolio equity assets and liabilities and its possible explanation.
Global portfolio debt (bonds)
Portfolio debt securities are held both by private investors and official ones, such as central banks and sovereign wealth funds. On the asset side, however, central bank holdings of foreign-currency bonds issued in different jurisdictions are reported in foreign exchange reserves, rather than portfolio debt assets. The largest holders of portfolio debt assets are advanced economies and financial centers—where investment funds have substantial bond holdings (Figure 6). In contrast, holdings by emerging market and developing economies are modest, with Middle Eastern sovereign wealth funds holding about a third of the total.
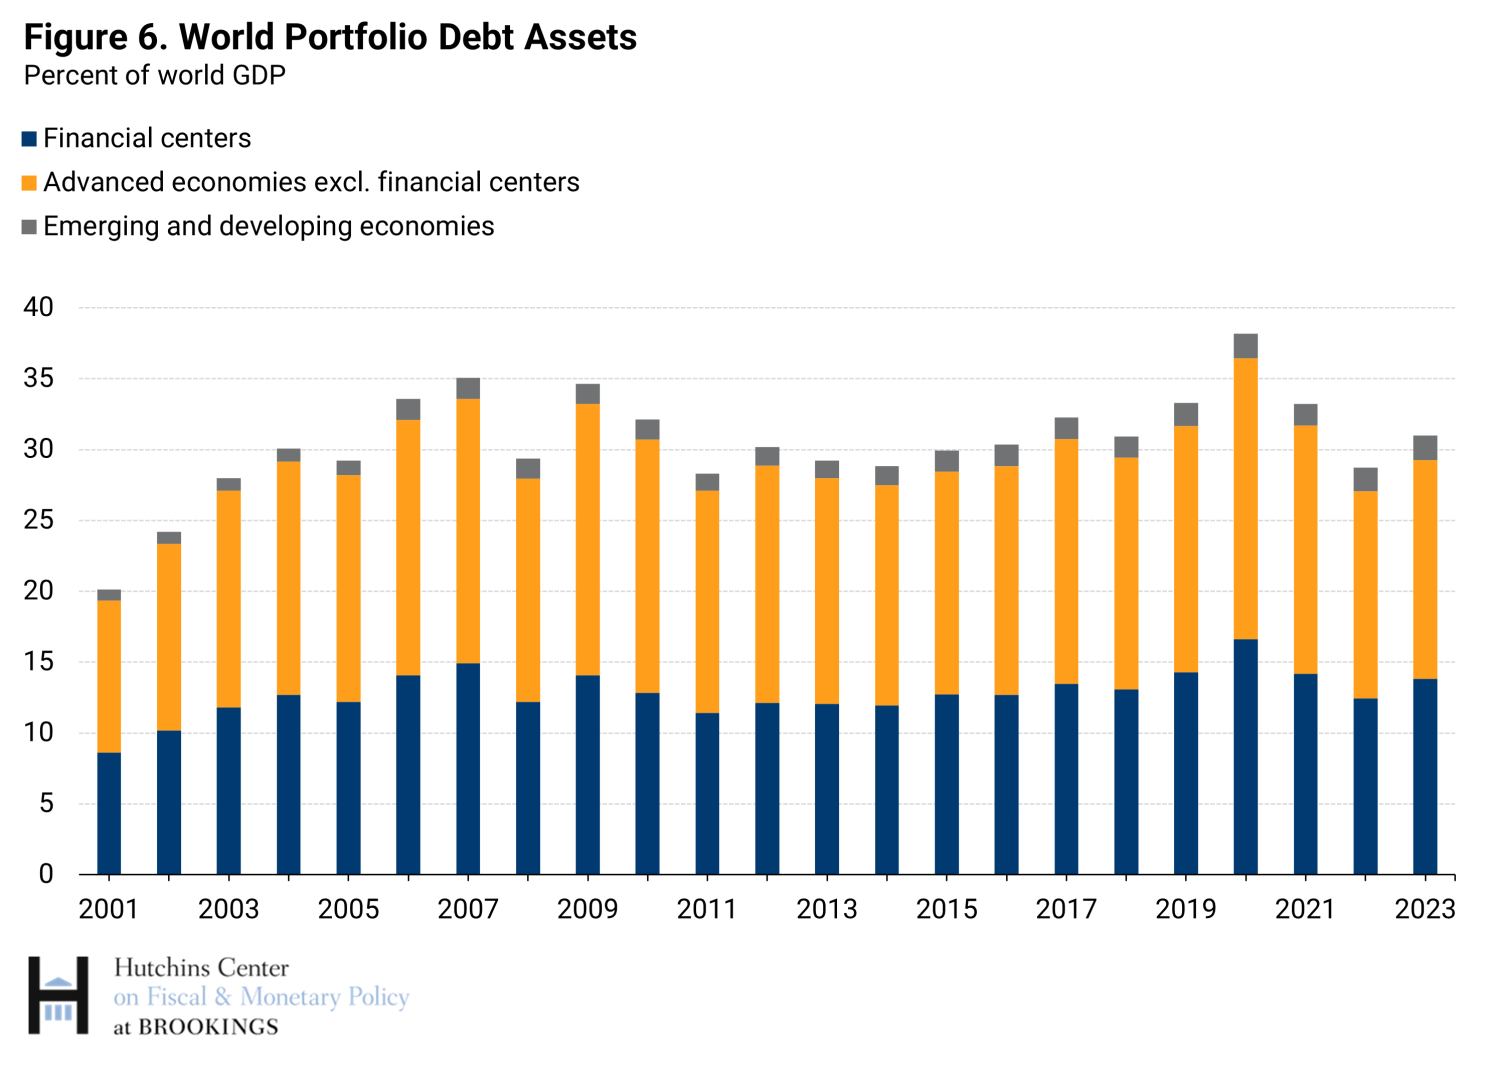
As the figure shows, global portfolio debt assets rose in 2023, supported by a rebound in cross-border flows (visible in Figure 2) as well as some decline in long-term interest rates relative to end-2022 which provided a modest boost to valuations. As was the case for portfolio equity, higher reported assets by the Cayman Islands ($750 billion above the reported 2022 holdings) also contributed to the increase.
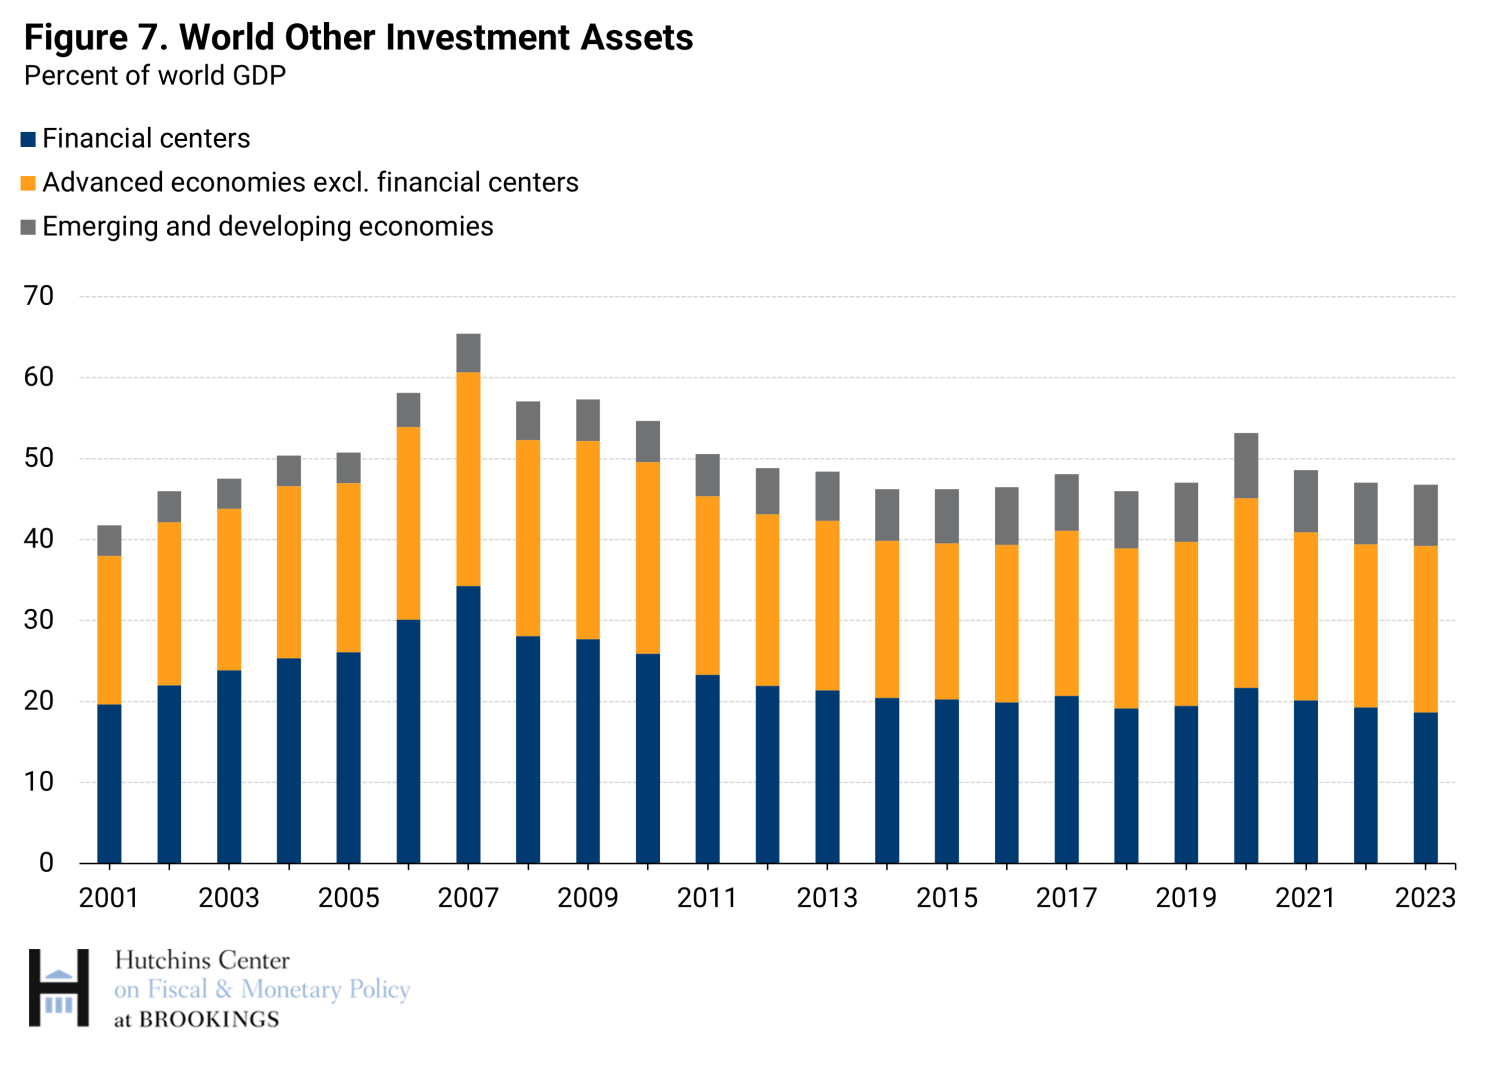
Global other investment
This category includes primarily financial instruments such as loans, deposits, and trade credits. It reflects to an important extent the cross-border activity of commercial banks, but also includes (for instance) loans by official creditors. The value of these financial instruments is generally not marked to market, and therefore fluctuations are driven by financial flows or changes in exchange rates.
The data are shown in Figure 7. Once again, the majority of holdings are those by advanced economies and financial centers, but especially for the latter such holdings are much smaller than those prior to the global financial crisis, reflecting the retrenchment in the cross-border position of global banks, particularly European ones. Holdings were roughly stable as a share of global GDP in 2023.
Foreign exchange reserves
This is the only category where emerging market and developing economies account for the lion’s share of cross-border holdings (Figure 8).
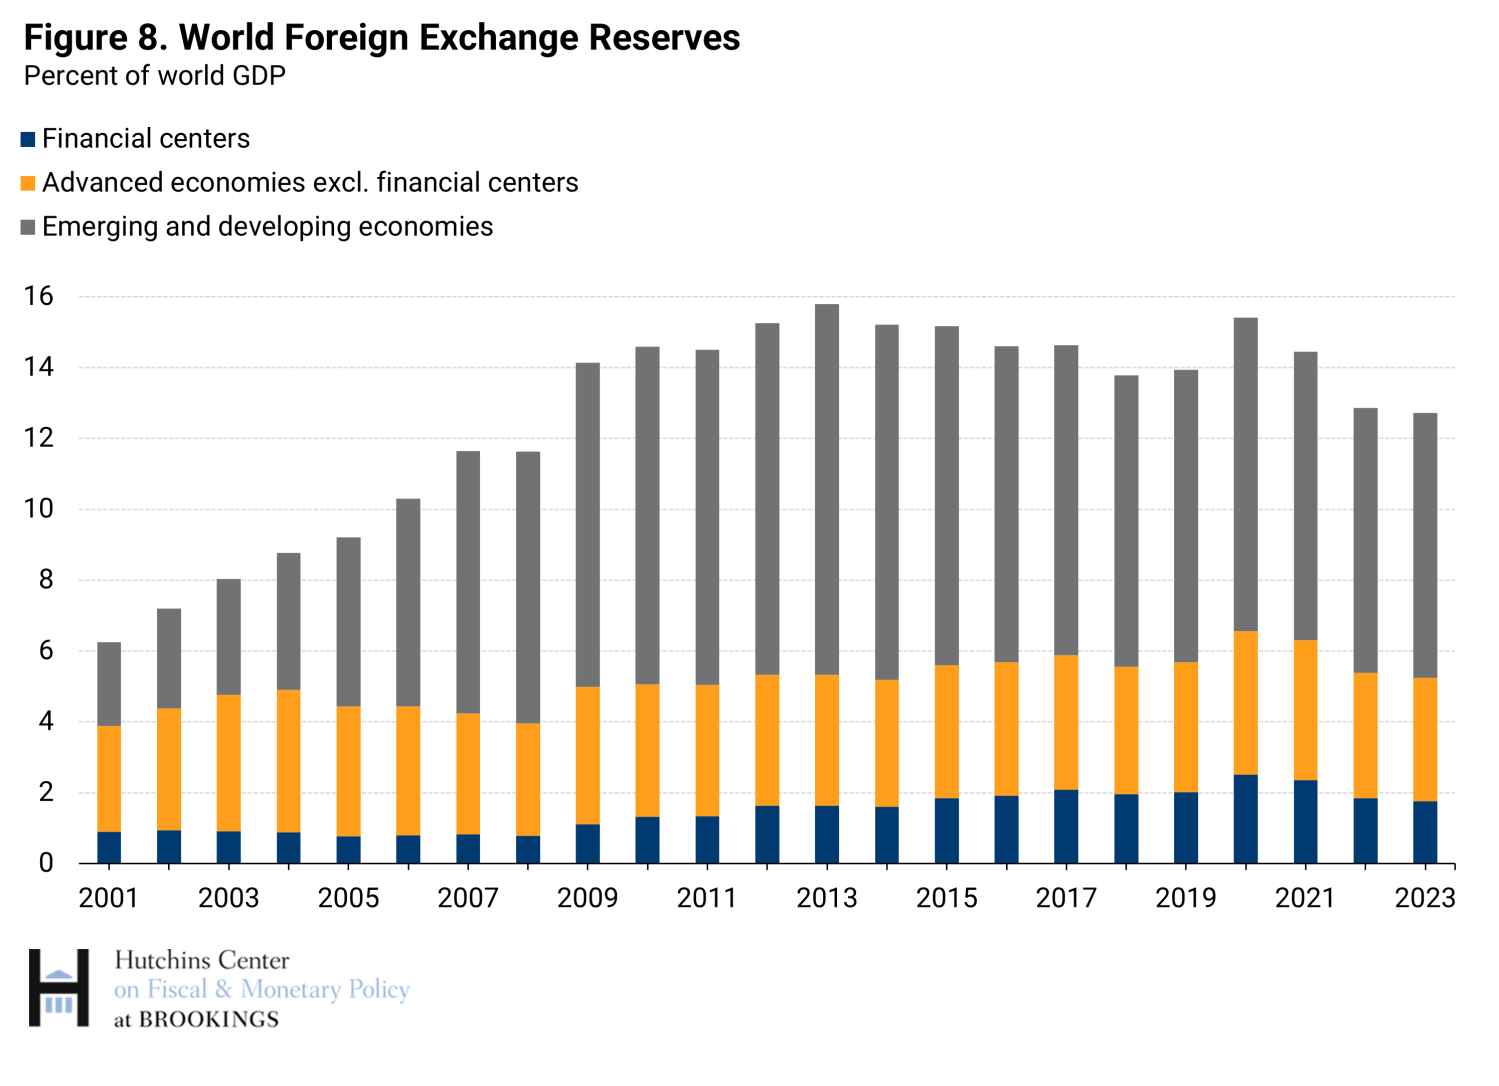
The global stock of reserves rose sharply through 2013 but has been generally declining since then as a share of global GDP, as net accumulation (shown in Figure 2) has been weak or outright negative in 2015-16. The exceptions (2020-21) are explained by the sharp decline in the denominator in 2020 because of the global COVID-induced recession and the $650 billion SDR allocation by the IMF in 2021, which boosted global reserve holdings by the same amount.2 China is still the largest holder of reserves worldwide ($3.3 trillion net of gold in 2023), despite a decline by over $500 billion over the previous decade, while Japan ($1.2 trillion) and Switzerland (close to $800 billion) are the largest holders among advanced economies and financial centers respectively.
In sum, also in 2023 fluctuations in global external assets and liabilities have been primarily driven by changes in asset prices, and data for end-2024 will show the same pattern given the further rise in equity prices in that year. Financial market developments in the U.S. continue to play a crucial role, given rising asset prices and a stronger dollar. Despite the recovery in asset prices and global risk appetite, financial flows have remained weak in 2023 as well. Developments in major financial markets—especially the U.S.—play a crucial role, particularly in portfolio instruments such as stocks and bonds. For instance, holdings of U.S. bonds by foreign investors account for about one-third of global holdings of bonds by nonresidents, and holdings of U.S. stocks for about 30% of global holdings of foreign stock, even though the latter also includes shares of investment funds and hence understates the true weight of U.S. stock holdings in global portfolios.3
The size of holdings by emerging markets and developing economies is dominant only in foreign exchange reserves, but this asset category has slowly declined in global importance. Emerging market economies are gradually becoming larger investors in other categories, especially FDI, but their role remains modest compared to their economic size. Financial centers continue to play a very large role in cross-border holdings, and reporting remains incomplete in some cases, occasionally leading to substantial data revisions such as the one for the Cayman Islands highlighted in this blog. And tax or other regulatory changes can trigger large movements in financial flows and positions driven by purely financial operations of multinational corporations, with no macroeconomic repercussions. This makes it harder to assess the importance of portfolio shifts driven by global macroeconomic prospects and geopolitical tensions.
Related Content


Author
-
Acknowledgements and disclosures
The Brookings Institution is financed through the support of a diverse array of foundations, corporations, governments, individuals, as well as an endowment. A list of donors can be found in our annual reports published online here. The findings, interpretations, and conclusions in this report are solely those of its author(s) and are not influenced by any donation.
-
Footnotes
- These data for the Cayman Islands are reported in the IMF’s Coordinated Portfolio Investment Survey. The 2022 EWN estimate of portfolio equity assets by the Cayman Islands ($1.85 trillion) is higher than the figure reported by Cayman Islands authorities ($1.1 trillion) because it makes use of U.S. source data on equity liabilities vis-à-vis Cayman Islands entities which exceeds the reported equity assets reported by the Cayman Islands vis-à-vis the U.S. for that year. With the massive increase in reported assets in 2023, the Cayman-source figures for that year now exceed the U.S.-reported liability figures by over $250 billion.
- In correspondence, IMF-member countries reported an equivalent increase in “other investment liabilities.”
- For instance, if a German investor holds a $100,000 position in an Irish investment fund holding U.S. stocks, the corresponding portfolio equity liabilities in international accounts will be $200,000 (U.S. vis-à-vis the Irish fund, and the Irish fund vis-à-vis the German investor). Similarly, portfolio equity assets will be $200,000 (the German investor’s share of the Irish fund and the Irish fund holdings of U.S. stocks).
The Brookings Institution is committed to quality, independence, and impact.
We are supported by a diverse array of funders. In line with our values and policies, each Brookings publication represents the sole views of its author(s).