This general election season, the major-party presidential candidates haven’t talked much about poverty. But while the issue may not have featured in the heated rhetoric on the campaign trail, both parties do have some serious ideas about how to combat poverty.
Democratic presidential nominee Hillary Clinton has put forward a policy agenda that includes proposals such as increasing affordable housing options, addressing persistently poor places, and expanding tax credits for working families with children. While Donald Trump has yet to provide specifics on his antipoverty ideas, a proposed Republican playbook on poverty, opportunity, and upward mobility can be found in House Speaker Paul Ryan’s Better Way policy agenda, announced earlier this summer. The two agendas represent distinct visions of an antipoverty/pro-opportunity federal policy agenda and highlight potential elements ripe for bipartisan debate and action.
That these antipoverty agendas have emerged from potential leaders in the next Congress and White House remind us that poverty and opportunity should be more than a top-of-the-ticket conversation. As Election Day approaches, voters should be paying attention to what down-ballot candidates—particularly those running for the House of Representatives—have to say about these issues. Indeed, my recent analysis of U.S. Census Bureau data finds that the challenges of poverty cut across the political divide and touch all 436 congressional districts.
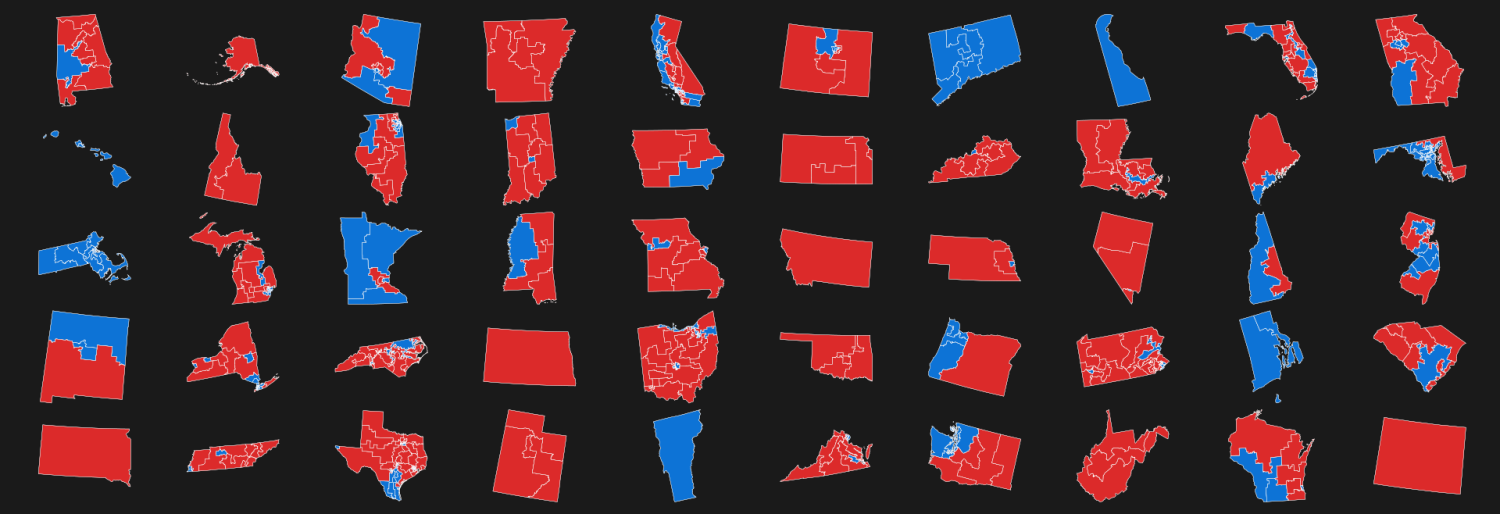
Although the poverty rate is higher in districts represented by Democrats, most poor people in the United States live in a community represented by a Republican. Taken together, the poverty rate in districts represented by Democrats in 2016 (“blue” districts) was 17.1 percent in 2010-14 compared with 14.4 percent in those represented by Republicans (“red” districts). But Republican districts have more poor residents overall: 25.1 million poor people lived in red districts in 2010-14 compared with 22.7 million in blue districts.
Between 2000 and 2010-14, the poor population grew faster in red districts than blue. The number of people living below the poverty line (e.g., $24,230 for a family of four in 2014) in Republican districts climbed by 49 percent between 2000 and 2010-14 compared with a 33 percent increase in Democratic districts. As a result, Republican districts accounted for 60 percent of the increase in the nation’s poor population during that time. At the same time, poverty rates rose by similar margins in both red and blue districts (3.3 and 3.2 percentage points, respectively).
Related Books
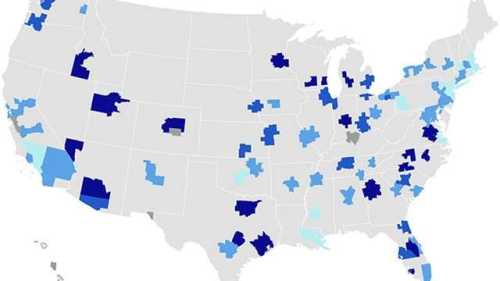
Almost every congressional district saw its poor population grow in the 2000s, owing largely to growing suburban poverty. Between 2000 and 2010-14, 96 percent of congressional districts (245 Republican and 175 Democratic districts) registered a significant increase in the number of people living below the poverty line (see map). Thirty-five districts saw the poor population more than double during that time, and most of those districts (28) were Republican (including House Speaker Ryan’s district, which registered an increase of 102 percent). (Download the appendix or view the interactive data explorer for detailed district data.)

The districts that top the list for growing poverty also tend to be largely suburban and located in regions that were hard-hit by the collapse of the housing market in the late 2000s, including Las Vegas (Rep. Heck), Atlanta (Reps. Woodall and Scott), and Phoenix (Reps. Franks and Salmon) (Table 1).
Table 1. Congressional Districts with the Fastest Growth in Poor Population, 2000 to 2010-14
| Party | State | District | Representative | Percentage Change in Poor Population | Share of Poor in Suburbs | |
| R | NV | 3 | Heck, Joseph J. | 268.4% | 51.0% | |
| R | GA | 7 | Woodall, Rob | 223.6% | 100.0% | |
| D | GA | 13 | Scott, David | 213.1% | 100.0% | |
| R | AZ | 8 | Franks, Trent | 188.5% | 93.5% | |
| R | AZ | 5 | Salmon, Matt | 177.7% | 50.4% |
Source: Brookings Institution analysis of decennial census and American Community Survey data
Although these districts stand out for fast growth in their poor populations, they also reflect a broader national trend in which suburbs became home to the largest and fastest-growing poor population in the 2000s. Within congressional districts, the poor population grew faster in suburban communities (by 75 percent in red districts and 50 percent in blue districts) than other types of communities (Figure 1). In turn, suburbs accounted for the largest share of the “new” poor over this time period in both Republican and Democratic districts.

In contrast, just 10 districts registered a significant decrease in their poor populations. Eight of them were largely or entirely urban districts led by Democrats, including four neighboring districts in New York (Reps. Clarke, Jeffries, Maloney, and Rangel) and two adjacent districts in Los Angeles (Reps. Schiff and Becerra). Two of the 10 were predominantly rural Republican districts (led by Rep. Jenkins in West Virginia and Rep. Rogers in Kentucky), both of which lost population overall during this time.
Between 2000 and 2010-14, the poverty rate increased in 96 percent of Republican districts and 86 percent of Democratic districts. During this period, 236 red and 165 blue districts experienced a significant uptick in the share of the population living below the poverty line. Thirty-one districts posted an increase at least twice the national average, 22 of which were Democratic. They encompass a mix of urban and suburban areas—including the largely urban districts represented by Rep. Conyers in Detroit, Rep. Carson in Indianapolis, and Rep. Adams in Charlotte—and the suburban districts in Atlanta represented by Reps. Johnson and Scott (Table 2).
Table 2. Congressional Districts with the Largest Poverty Rate Increases, 2000 to 2010-14
Party |
State |
District |
Representative |
Percentage Point Change in the Poverty Rate | Share of Poor in Cities | Share of Poor in Suburbs |
| D | MI | 13 | Conyers, John, Jr. | 11.5% | 71.7% | 28.3% |
| D | GA | 4 | Johnson, Henry C. “Hank”, Jr. | 10.6% | 0.0% | 100.0% |
| D | GA | 13 | Scott, David | 10.5% | 0.0% | 100.0% |
| D | IN | 7 | Carson, André | 10.5% | 90.3% | 9.7% |
| D | NC | 12 | Adams, Alma S. | 10.2% | 86.4% | 13.6% |
Just 15 districts saw poverty rates fall from 2000 to 2010-14. Eleven are predominantly urban Democratic districts, including those in New York and Los Angeles where the number of people in poverty fell, as well as Rep. Norton’s district in Washington, D.C., and Rep. O’Rourke’s district in El Paso, Texas, which saw poverty rates decline amid overall population gains.
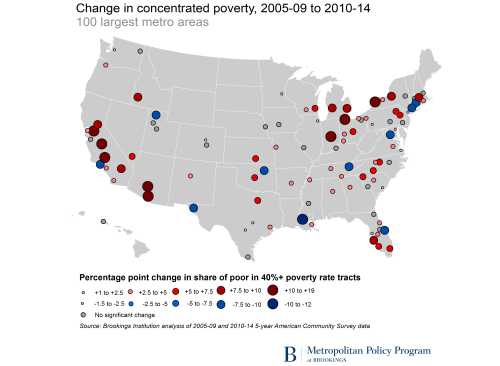
All but two congressional districts are home to at least one area of high poverty. Poor neighborhoods, as well as poor individuals, cut across the political divide. In 2010-14, almost every congressional district contained at least one neighborhood where the poverty rate exceeded 20 percent, a threshold at which negative effects of concentrated poverty begin to emerge.
What is more, 86 percent of districts (213 Republican and 163 Democratic) were home to at least one neighborhood with a poverty rate of at least 40 percent—the threshold that historically demarcates areas of concentrated urban poverty. Together with research that has shown the growing reach of concentrated poverty beyond the urban core, this finding underscores that challenges specific to high-poverty and economically distressed neighborhoods are shared not only across geographic lines, but also party lines.
Conclusion
Once the dust settles after Election Day, regardless of the outcome, it will be time for the new Congress and president to get to work on delivering on the promises they have made to the American people. Given the broad reach and shared challenges of poverty highlighted in this analysis, a top priority should be forging a bipartisan federal antipoverty agenda that increases access to opportunity for the nation’s residents and families, wherever they live.
A note on methods
This analysis uses census tract data from the 2000 decennial census (normalized to 2010 tract boundaries by GeoLytics) and the 2010-14 American Community Survey. Congressional district poverty estimates for 2000 and 2010-14 were created by assigning 2010 census tracts to district boundaries for the 114th Congress. Tracts that fall in more than one district were assigned based on where the majority of the population lived in 2010. This method produces consistent geographic boundaries that make it possible to compare data from different years.1
Related Content
Using mapping software, tracts were also assigned to one of four geographic categories, which are defined as follows: Cities are those in the 100 most populous metropolitan statistical areas (MSA) that appear first in the official MSA title, plus any other city in the MSA title with a population of 100,000 or more. Suburbs represent the remainder of the top 100 MSAs. Small metro areas include all other MSAs outside the top 100. Rural, or nonmetropolitan, areas represent communities that fall outside an official MSA.
Finally, tracts with small total populations (i.e., fewer than 500 people) or large student populations (i.e., where college or graduate students make up more than half of tract residents) were excluded from the designation of neighborhoods considered high-poverty (i.e., poverty rates of at least 20 percent) or distressed (i.e., poverty rates of at least 40 percent).
Author

-
Footnotes
- Thanks to Cecile Murray for her research assistance on compiling the tract to congressional district crosswalk.
The Brookings Institution is committed to quality, independence, and impact.
We are supported by a diverse array of funders. In line with our values and policies, each Brookings publication represents the sole views of its author(s).