


There are lots of good reasons to go to college, but the vast majority of prospective students in this country report[i] that they’ll go to college because they believe that it will improve their employment opportunities and financial wellbeing. And for the most part, they’re right. Despite many suggestions to the contrary, it’s very well documented[ii] that investments in higher education pay large dividends in the form of future earnings. This makes higher education one of the most important tools we have for generating social mobility. Regardless of an individual’s starting point in life, higher education offers access to greater financial well-being. Unfortunately, it’s not a fail proof system.
Investments in education, like investments in the stock market, do not come without risk. In financial markets, access to information is one way investors mitigate risk. Mutual funds, for example, disclose average returns over various time periods for certain categories of investments (e.g. large-cap funds, emerging market funds, technology funds, etc.), in addition to other information. These data, moreover, are widely and freely available through consumer-oriented websites like Yahoo Finance, Vanguard, and E-Trade. Yet, for higher education, students have had access to no analogous information until quite recently.
For decades, economists discussed the average benefits of a college education compared to a high school education with no regard to either field of study or institution. Finally, in 2009, the Census Bureau started collecting data that could be used to assess which majors pay the most,[iii] and then just a few months ago, the Department of Education released data on the earnings of alumni by institution, for all students who receive federal grants or loans. These data can be further analyzed, as we have done, to estimate the economic contribution of schools (or value-added) as distinct from the outcomes attributable to student characteristics (like test scores).[iv] Still, even with these data advances, students cannot compare earnings by major across institutions, except in a handful of cases using state data systems.
Here, we illustrate how data by major and institution can inform the decision of what to study and where using data from Texas. Suppose first that this student is a Texas resident and has decided she would like to pursue a bachelor’s degree at a public institution in her state.
Our data on alumni earnings by major comes from the Texas Higher Education Board, and we combine it with information on the net cost of tuition from the Department of Education’s IPEDS database as reported in the College Scorecard.[v] We use these data to estimate the ten-year return on investment for each institution in the state of Texas by major.
We calculate an estimate of ten-year return by summing the average earnings faced by graduates over the first ten years following graduation[vi] and subtracting off the wage they would have received as a high school graduate without a degree (taking into account additional years of earnings when they would have been enrolled in college). To estimate this benchmark, we used data on Texas residents from the Annual Social and Economic Supplement to the Current Population Survey, obtained via IPUMS CPS.[vii] We then subtract the institution specific costs[viii] to get the ten-year financial return. Since education pays off over a lifetime, this isn’t the ideal exercise, but it’s still informative. We’ve estimated these returns based on the population of individuals who both complete their degree and do not go on to complete graduate study. Ideally, these estimated expected returns would be adjusted to account for how earnings and costs are affected by non-completion. Indeed, the average rate of completion across these schools is only 48 percent. This is a quick and dirty method for estimating returns that fails to take into account a number of selection issues,[ix] but we believe that it still provides an effective illustration of risk in higher education.
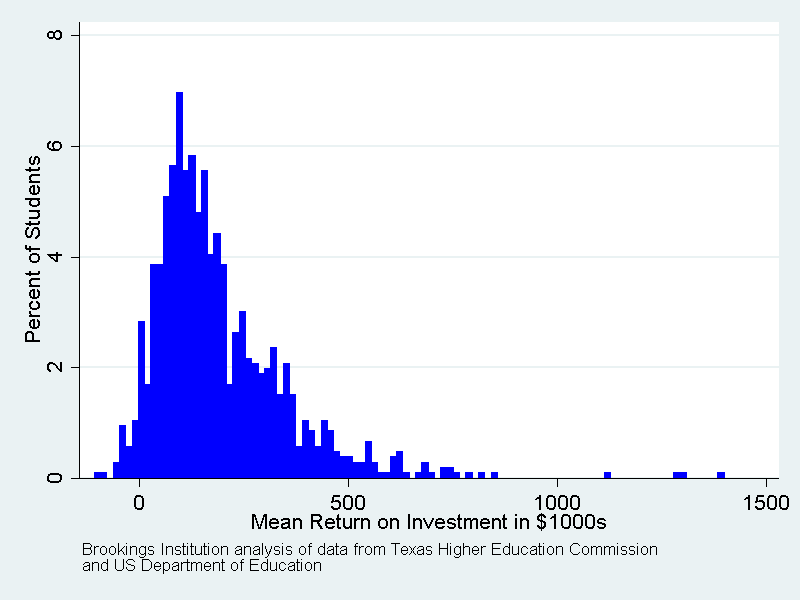
Figure 1 illustrates the potential average outcome facing our Texas student, who is deciding between bachelor’s degree programs from the set of public institutions in her home state. We’ve plotted the distribution of financial returns for the set of potential expected outcomes, which are defined as all combinations of institution and major. To be clear, the distribution of potential outcomes would be far wider if we were using individual specific variation (i.e. the fact that some students will ultimately earn more than others, even with the same degree from the same institution) and the real possibility of non-completion.
We know that, on average, this student will face a positive return on her investment, wherever she chooses to go. The average rate of return across all possible choices facing this student is quite a sizeable 11.3 percent (or $216,000 in undiscounted 2014 dollars). At a systemic level that’s important. Still, the standard deviation is 6.7, with a low return of a -6.6 percent (Animal Science at Sul Ross State) and a high return of 79.8 percent (Registered Nursing at UT Brownsville). Out of 1065 combinations of majors and schools, 19 yielded average negative returns. This was true even for two programs at the selective UT Austin campus (Visual and Performing Arts and Classics). 1.1 percent of students who graduated in 2004 were in a major-institution combination that yielded a net return below 4 percent. In such cases, they would have been better off putting their dollars into treasury bills.
Figure 1. Mean return on bachelor’s degree investment by institution and major, for Texas residents who graduated in 2004 from a Texas public college
Students who know what they want to major in could benefit greatly from knowing which school is likely to generate the largest pay off (it would be nice to know this in terms of learning as well as money, but that is another more complicated matter).
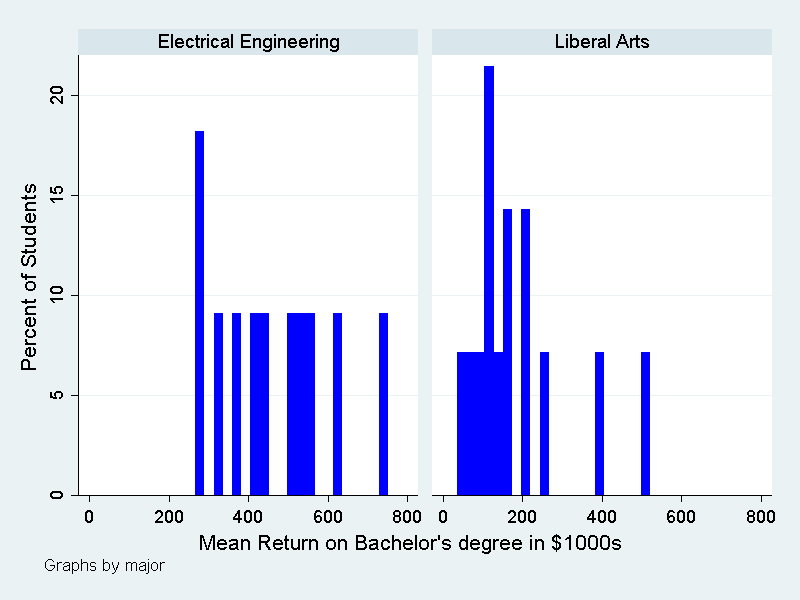
We’ve illustrated the distribution of potential outcomes for two different popular majors, Liberal Arts and Sciences and Electrical Engineering.[x] Both majors clearly offer a significant average rate of return across all institutions (12 for Liberal Arts and 20 for Electrical Engineering), but depending on which major they choose the student will face a different level of risk in their future earnings. The variation (standard deviation) in the expected rate of return across institutions is much larger for Liberal Arts majors (5.7) than for Electrical Engineering majors (3.7). Yet, while these facts may discourage people from pursuing a Liberal Arts major in the abstract, the plot below does show that some Liberal Arts majors out-earn their peers in electrical engineering. For example, Liberal Arts majors from UT Austin earned a higher return than electrical engineering majors at UT Dallas, the University of Houston, and three other UT campuses. Thus, these more detailed facts can actually encourage students to pursue majors that look economically bad for the average student but quite attractive at a particular school with a strong program.
Figure 2. Distribution of earnings 10 years after graduation for bachelor’s degree holders with an Electrical Engineering or Liberal Arts degree, for Texas residents and 2004 graduates from Texas public colleges
The point is that college degrees, like other investments, are risky, but information goes a long way to clarify the nature of that risk and improve the quality of investment decisions. In addition to providing students and the public greater access to data on market performance of alumni, there are a number of innovations both in the policy arena and in the private market that could help make college investments less risky. First of all, innovative financing systems that allow students to pay for their investment over a longer period of time and tie repayment to earnings would greatly limit downside risk for students. Second, institutions have the capacity to shoulder some of this risk, and a proposal known as risk-sharing[xi] is gaining some traction and would require schools to pay the federal government some portion of loan default losses. On a voluntary basis, some colleges have offered on-time graduation guarantees[xii] and wage guarantees.[xiii] And last, new business models in higher education could help mitigate risk. Part of the problem in the current system comes from the all-or-nothing regime in which students have to invest in a bundle of coursework (i.e. a degree) in order to reap significant returns. The growing prominence of new models, like micro-credentials[xiv] and coding boot camps,[xv] can offer alternatives that don’t require students to put all of their eggs in one basket.
Learn more in this video on student loan debt:
[i] http://www.edcentral.org/collegedecisions/
[ii] https://www.brookings.edu/blogs/jobs/posts/2012/10/05-jobs-greenstone-looney
[iii] https://www.census.gov/prod/2012pubs/acsbr11-10.pdf
[iv] https://www.brookings.edu/research/reports2/2015/10/29-earnings-data-college-scorecard-rothwell
[v] Alumni earnings are reported to us at the field of study and institutional level for all alumni who graduated from a Texas four-year public institution in 2004 and were working in Texas one year, three years, five years, 8 years, or ten years after graduation up until 2015. The sample is further restricted to bachelor’s degree only recipients who did not go on to earn a higher degree. The underlying data source removed workers earning more than one million dollars.
[vi] Cumulative earnings were calculated for each major-institution combination imputing earnings for missing years using the average of the two observations closest in time. Earnings were further adjusted to 2015 dollars using the Consumer Price Index.
[vii] This sample was limited to individuals who were born in 1982 and working and not enrolled in school. Mean high school earnings were averaged across individuals for over 14 years (2000 to 2014).
[viii] Cost is estimated using average tuition revenue per full time student less institutional discounts and allowances. We sum this variable over four years (2001 to 2004) and adjust to 2015 dollars. Note that this average is likely to be reasonably accurate even for students who take longer to graduate because in such cases they are likely enroll in fewer classes per year, incurring lower expenses. We did not include the cost of living, because students would have had to pay those costs if they were not enrolled in college.
[ix] For instance, we might expect that college graduates would earn higher wages than the typical high school graduate even if they did not have a college degree. Essentially, our study does not take into account the fact that wages are a function of both individual characteristics and college quality. For the purposes of policy, a value-added measure has the capacity to overcome some of the limitations of this brief study.
[x] The Liberal Arts and Science major is described here: https://nces.ed.gov/ipeds/cipcode/cipdetail.aspx?y=55&cipid=88372
[xi] https://www.brookings.edu/research/papers/2015/11/17-colleges-local-economies-rothwell
[xii] https://www.pdx.edu/four
[xiii] http://adrian.edu/admissions/financial-aid/adrianplus
[xiv] http://ssir.org/articles/entry/the_case_for_social_innovation_micro_credentials
[xv] http://www.npr.org/sections/ed/2014/12/20/370954988/twelve-weeks-to-a-six-figure-job