

The Brown Center on Education Policy at Brookings recently released the fourth iteration of its annual Education Choice and Competition Index (ECCI). The 2014 ECCI examines the status of K-12 school choice during the 2013-2014 school year in the 100+ largest school districts in the U.S.[i] The ECCI describes the state of school choice based on data derived from the federal government’s National Center for Education Statistics, individual school district websites, surveys of district personnel, and performance by schools on state assessments of academic achievement. The data are organized based on a conceptual model in which good implementations of school choice provide parents with: many choices among types of school; a supply of comparatively higher performing schools; good information on school quality on which to base choice; a choice process that is efficient and equitable to all students; funding that follows students to their school of choice with policies to close unpopular schools; and free transportation for students from home to any school of choice.
In his keynote address at the release of the 2014 ECCI, Senator Lamar Alexander noted that he felt like a character in the movie Groundhog Day because he had been giving the same speech on school choice every ten years, predicting in 1992 that by the year 2000 school choice would no longer be an issue as all parents would be able to freely choose any K-12 accredited school for their child.
Is the nation, in fact, stuck in a recurring scene in which parents awaken to the sounds of Sonny and Cher on their radio and trundle their children off to the public school that is closest to their home because that is their only option? Or have we broken out of the tradition of zip code education in ways that suggest that Senator Alexander’s rosy prediction on school choice, first given in 1992, is closer to realization than many would think?
Heretofore, our annual ECCI release has not covered a long enough period to detect meaningful trends. In this report, we lengthen our analysis as we introduce and utilize annual data based on the scoring rubrics in the ECCI that extends the series backward in time to the 2000-2001 school year.
Our present interests are descriptive. We address some of the dimensions on which school choice has changed in large school districts since the beginning of this century and some of the dimensions on which choice has been static. We believe this information, provided here as a preliminary first look at our newly constructed dataset, provides important context for several constituencies. Among them is the U.S. Congress, which is presently about the business of reauthorizing the Elementary and Secondary Education Act. It should be relevant for federal legislators to know whether school choice is an idiosyncratic policy preference that has always been scattered around America’s largest cities and school districts, or is something that is moving with a speed and direction that suggests a public appetite. If the latter, what should Congress do to address areas in which school choice is impacted by federal policy?
Information on change and stasis in school choice is also important to decisions by policymakers and voters at the state and local levels. Where do states and large school districts stand with respect to the counterparts against which they benchmark themselves, and with respect to general trend lines? Information on long-term trends in school choice also can inform the efforts of advocates (and opponents) of school choice by revealing features of school choice policies that seem amenable to or resistant to change.
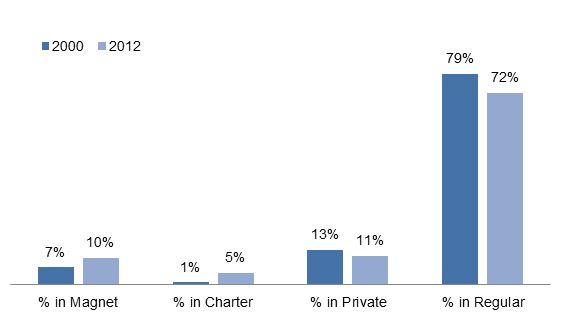
Enrollment in alternative schools
An important component of choice is variety. To the extent that all schools provide the same curriculum to similar students with similar teachers and staff, choice is between Tweedledum and Tweedledee. We see modest growth over the time period we examine in enrollment in alternatives to traditional public schools in the form of magnet schools (up from seven percent to 10 percent) and charter schools. In contrast, enrollment in private schools has declined (from 13 to 11 percent). Thus, a parent living in a metropolitan region served by one of our large school districts has, on average, a bit more choice of an alternative school today than in 2000, though regular public schools are still the dominant service providers. There are substantial differences among districts on this variable, with, for example, a substantial majority of students served by alternative schools in New Orleans, LA and a near parity between alternative and traditional schools in Washington, D.C., whereas nearly all students are served by traditional public schools in districts such as Fort Worth, TX and Santa Ana, CA.
Student Enrollment
Availability of school choice
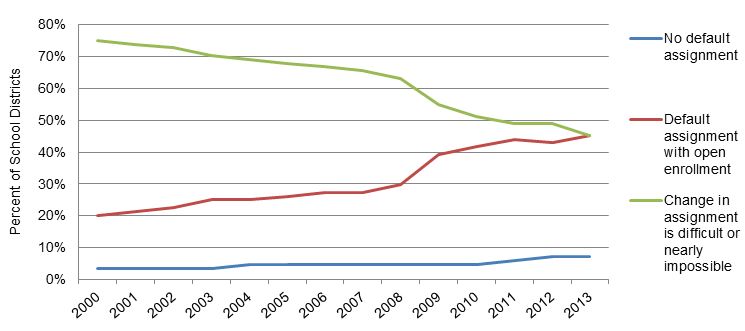
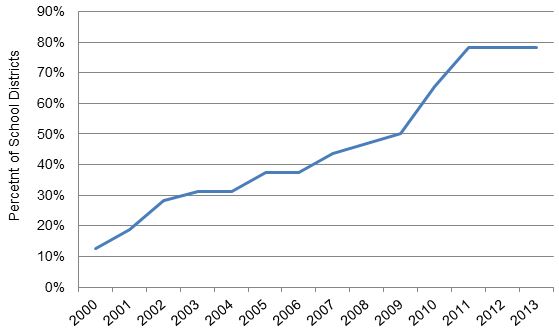
One of the most central dimensions we tracked is the extent to which school districts make choice easily available, either through a process in which parents have to choose, or through a process in which students receive a default assignment to a neighborhood school but parents can easily seek a transfer of their child to another school. As depicted in the following graph, changes over time in the availability of school choice have been dramatic.[ii] In the 2000-2001 school year, only 24 percent of districts afforded parents school choice (20 percent through easy transfers from default schools and four percent through a full-fledged open enrollment process). Today, that number has more than doubled to 55 percent of districts allowing choice. Put another way, in 2000-2001, 75 percent of our districts made transferring out of one’s default assigned school difficult or nearly impossible. Today that number has dropped to 45 percent.
Change in Student Assignment to Schools Over Time
Availability of distance (virtual) education
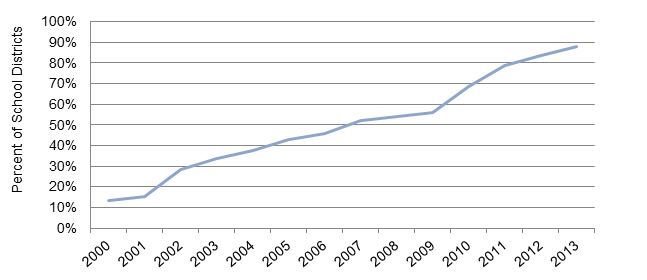
We see similar trends in other facets of choice. In 2000-2001, 13 percent of districts offered virtual programs or allowed their students to enroll in virtual classes that counted towards graduation or matriculation. Today, that has jumped to 88 percent.
Virtual Programs or Courses Allowed
Managing the supply and funding of schools based on their popularity
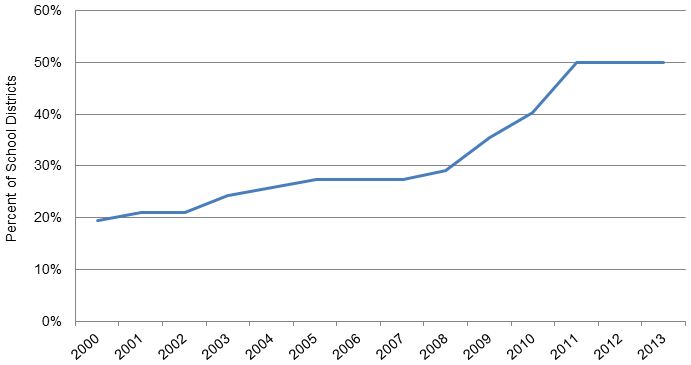
In 2000-2001, 19 percent of the schools in our sample had a published policy to close or restructure schools based on declining enrollment. Today, that has more than doubled to 50 percent.
Policy to Restructure or Close Schools with Declining Enrollment
There are even larger changes (from about 10 percent to about 80 percent) in the proportion of districts that fund schools based on a formula in which a substantial portion of each school’s allocation of district funds is determined by enrollment, both in terms of size and student needs (i.e. special education, ELL, etc.). Such funding policies, when combined with easily available school choice, have the potential of putting competitive pressure on individual schools that are losing students to make themselves more attractive to parents and students.
Popularity of Schools Reflected in Funding
Transportation isn’t on the move
Whereas most of the components of school choice tracked by the ECCI have changed, sometimes substantially, since 2000-2001, the provision of transportation to students has not budged: 10 percent of districts then and now provide transportation for students to any public school of choice within the district. Limitations on transportation of students to and from school place severe practical constraints on the exercise of school choice for families in which all the adults hold down jobs with 9-5 workdays or do not have a car.
Summing up
It may feel like Groundhog Day to Senator Alexander, but, in fact, since the 2000-2001 school year, the story of school choice in the nation’s largest districts has been one of change rather than repetition. The senator’s prediction of a day in which every parent chooses her child’s school is still far from realization, but over a quarter of children in large schools districts today are attending alternative schools that have been chosen by parents, roughly half of districts make it relatively easy for a parent to exercise choice among public schools, and districts are managing their portfolio of schools and budgets in ways that favor popular schools. For advocates of school choice, that is progress. And for policymakers, these shifts indicate that there is both public interest and political feasibility for school choice in the nation’s largest school districts. The stagnation of transportation options points to an area for policy improvement, and a possible reason why the parents who may benefit the most from school choice are the least able to choose schools outside of their neighborhood.
This quick look at trends in school choice does not address the impact of changes in school choice on outcomes such as student achievement and school productivity. But the data we have assembled should be useful to researchers in addressing these questions. This database is available to qualified researchers for a variety of analyses and potential projects. For more information please click here.
[i] The first release of the ECCI covered 30 districts, whereas the subsequent three releases covered more than 100.
[ii] The percent of school districts is derived from the number of districts for which we have complete data from 2000-2001 to present.
Authors’ Conflict of Interest Disclaimer: The Walton Family Foundation, which has a mission to enhance school choice, provided funding for the work reported herein. With the exception of its initial decision to fund the program of work of which this report is a part, the Walton Family Foundation has had no involvement in any aspect of the activities carried out by the authors relevant to this report.