
The issue of inequality has recently been in the public eye. The president gave a speech on inequality in December 2013, and mentioned it again in his 2014 State of the Union Address. Thomas Piketty’s recent book on inequality, Capital in the Twenty-First Century, has generated much discussion and was the focus of New York Times op-ed columnists Paul Krugman and David Brooks on the same day.
In K-12 education, inequality has been a concern at least since the Elementary and Secondary Education Act of 1965. In particular, the re-authorization of that law as No Child Left Behind (NCLB) in 2002 took specific aim at inequality in its focus on improving academic performance of particular groups. These “subgroups” were defined by race and ethnicity, special education and English language learning (ELL) status, and economic disadvantage, which was indicated by eligibility for the free lunch program. NCLB required states to take action—“intervene”—when schools did not improve overall achievement or subgroup achievement for consecutive years.
An important feature of the law was that if any subgroup failed to meet its targets for advancing, a school was designated “in need of improvement,” which triggered a set of increasing draconian consequences depending on how long the school remained in that category, e.g., mandatory school restructuring. Ultimately, this subgroup structure was the trigger for many schools to be designated in need of improvement.
NCLB is long past due for re-authorization. In lieu of congressional action, the current administration took matters into their own hands in 2011 by allowing states to apply for waivers from NCLB’s provisions in exchange for meeting particular criteria. Currently, 43 states and the District of Columbia have waivers. In applying for a waiver, states can create different subgroups, and many have created a ‘super subgroup’ that combines those identified by NCLB. The Campaign for High School Equity criticized the move away from subgroup accountability as substituting complexity and vagueness where there had been clarity.
A closer look at NAEP scores for subgroups and how they have trended suggests it is possible waivers may impair equity. The trends can be read in different ways, but education equity is important and even the possibility of it being impaired merits debate. An original analysis relevant to that debate follows.
Using main NAEP and its data explorer tool, and the national public school sample (the one NCLB and waivers applies to), I defined subgroups to be ELL, special education, free-lunch, white, black, and Hispanic. These groups can overlap. For example, some proportion of free-lunch students is in the white group and others are in the black or Hispanic groups. NAEP only began identifying ELL students around 2000, so that year is the starting point for my analysis.
I used the highest-performing group, which was white students, as the benchmark. I then defined a “gap” to be the percentage difference between the white subgroup and other subgroups. If gaps are closing, these percentages will move towards zero percent.
Figure 1 shows the gap between fourth-grade reading scores for white students and the other five subgroups, expressed as the percentage difference between the white subgroup and the other subgroups. The smallest gap is about 10 percent, for free lunch students in 2011. A 10-percent gap is about 22 to 23 points, which is substantial (about 2/3 of a standard deviation). The largest gaps are for special education and ELL students, about 18 to 20 percent. Note that these groups have scores that have generally increased in recent years—for example, ELL students rose from 170 to 192 between 2000 and 2013. Gaps grow larger when the upward trends of these subgroups are slower than the trend for white students.
The gap for all subgroups declined steadily throughout the early 2000s, with the largest improvements seen between 2000 and 2002. This progress seemed to slow by 2010, with gaps remaining unchanged or even ticking up slightly for some subgroups since then.
Figure 1. Gap Between White Students and Subgroups – Fourth Grade Reading
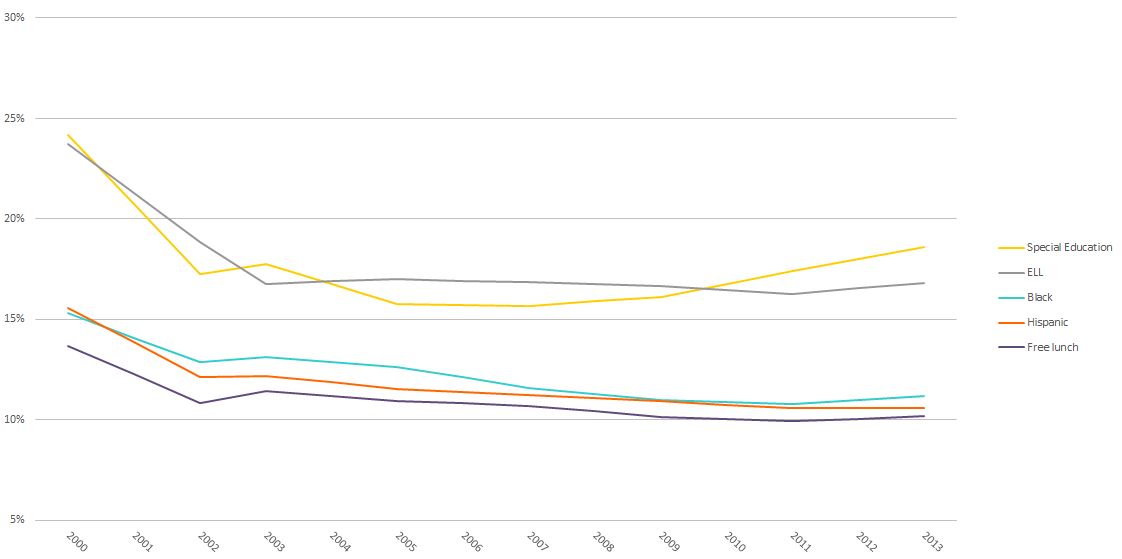
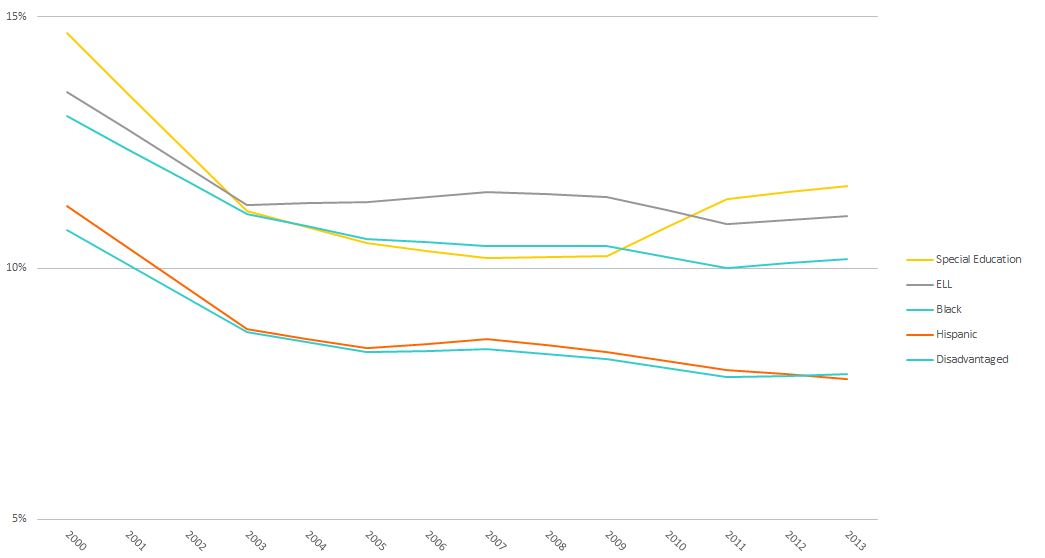
Figure 2 shows the gap between fourth-grade math scores for white students and the other five subgroups. The figure shows a similar though not identical pattern as Figure 1. Gaps for eighth-grade reading and math (not presented graphically) tend to be smaller than fourth grade, and the trends are less evident.
Figure 2. Gap Between White Students and Subgroups – Fourth Grade Math
Overall, NAEP data suggest gaps have stopped closing for most subgroups. The turning point appears to be around 2010.
While the causes of these recent trends are unclear, seeing achievement gaps widen even for a short period raises concerns about the current structure of waivers. The above analysis does not demonstrate that waivers caused gaps to widen, but it is certainly possible that waivers will contribute to gaps widening because allowing states to lump subgroups together means they no longer need to focus on performance of specific populations such as special-education students. Under waivers, not meeting performance objectives for the super-subgroup drives interventions, but experience to date is too limited to know what these interventions will be. Without knowing which type of student needs intervention, how will interventions be targeted? Intervening with special-education students may be quite different from intervening with ELL or free-lunch students.
“What gets measured gets done” is a stale cliché, but the principle is essential to accountability. In 2008, the U.S. Department of Education required states to adopt a strict measure of on-time high school graduation. Recently, the National Center for Education Statistics released a report showing that the high school graduation rate had risen above 80 percent. We should re-work the cliché to be forward-looking: “if you want something done, measure it.”