
This analysis is part of USC-Brookings Schaeffer Initiative on Health Policy, which is a partnership between the Center for Health Policy at Brookings and the University of Southern California Schaeffer Center for Health Policy & Economics. The Initiative aims to inform the national health care debate with rigorous, evidence-based analysis leading to practical recommendations using the collaborative strengths of USC and Brookings.
Last month, we analyzed how states and the federal budget would have fared had a Medicaid per capita cap like the one envisioned in the House-passed American Health Care Act (AHCA) been implemented in the recent past. On June 22, the Senate released a “discussion draft” of their Affordable Care Act repeal bill: the Better Care Reconciliation Act of 2017 (BCRA). The BCRA also includes a Medicaid per capita cap, but that proposal differs in important ways from the one passed by the House.
The most important difference is that the BCRA specifies a far smaller annual increase for states’ per capita spending targets starting in 2025. Rather than growing based on a blend of the Consumer Price Index for Medical Care (CPI-M) and the CPI-M plus one percentage point, these spending targets would grow with the overall Consumer Price Index for Urban Consumers (CPI-U). The CPI-U has grown far more slowly than the CPI-M historically and is projected to continue to do so in the future, by roughly 1.3 percentage points annually over the next ten years according to Congressional Budget Office projections.
The Senate’s proposal also differs in several narrower ways. First, the BCRA would apply a small adjustment to a state’s per capita cap if its per capita spending for any category of Medicaid enrollment is more than 25 percent higher or lower than the national average (with an exemption for the five states with the lowest population density). Second, the BCRA would give states a small amount of latitude in choosing the base period on which their future caps would be based. Third, the BCRA would exclude a small number of high-cost children from the per capita cap.
Related Content

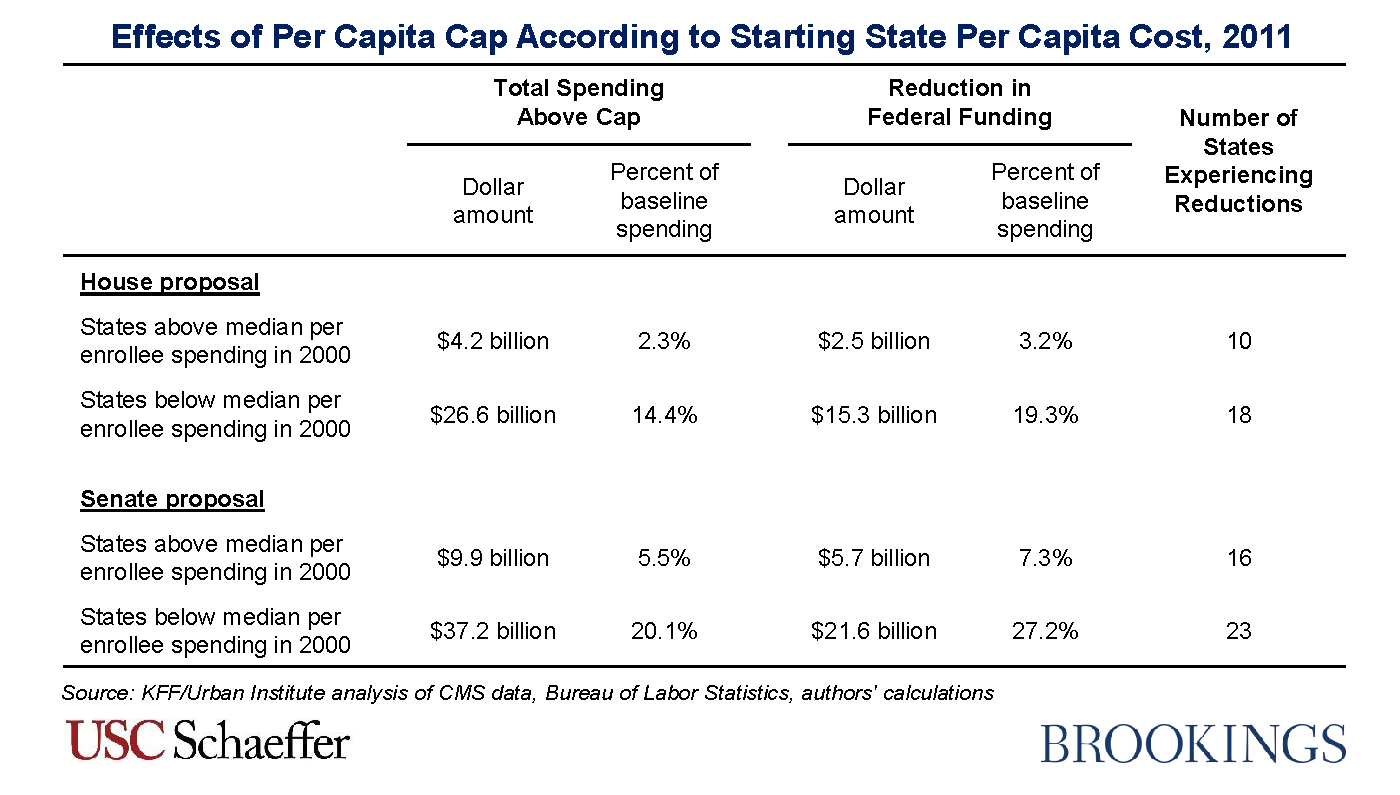
This blog post repeats the major elements of our earlier House analysis for the Senate proposal. Like that earlier analysis, we examine how a per capita cap would have affected states and the federal budget in 2011 had the cap been implemented in 2004 based on states’ 2000 per capita spending levels. (Thus, 2011 in our historical exercise is comparable to 2027 on the implementing timeline envisioned by the House and Senate proposals.) As before, we focus on this period because of the availability of suitable state-level data on Medicaid spending and enrollment from the Kaiser Family Foundation. The appendix describes how we have adapted our methodology for the House bill to reflect the Senate’s proposal.
Key Findings on the Effects of the Senate’s Medicaid Per Capita Cap
- Implementing the Senate’s proposed per capita cap during the 2000s would have resulted in large reductions in federal Medicaid funding. The reductions are considerably larger than the already significant reductions under the House proposal, despite the fact that the slower index would have been in effect for just three years by 2011. The Senate’s proposed per capita cap would have reduced federal funding to state Medicaid programs by $27 billion in 2011, requiring states to increase their spending by an average of 17 percent to maintain their programs in their then-current form. The reduction in federal funding under the Senate proposal is 53 percent larger than the corresponding reduction under the House proposal. Either proposal would have required states to make significant cuts to their Medicaid programs, find additional funding elsewhere in their budgets, or do some combination of the two.

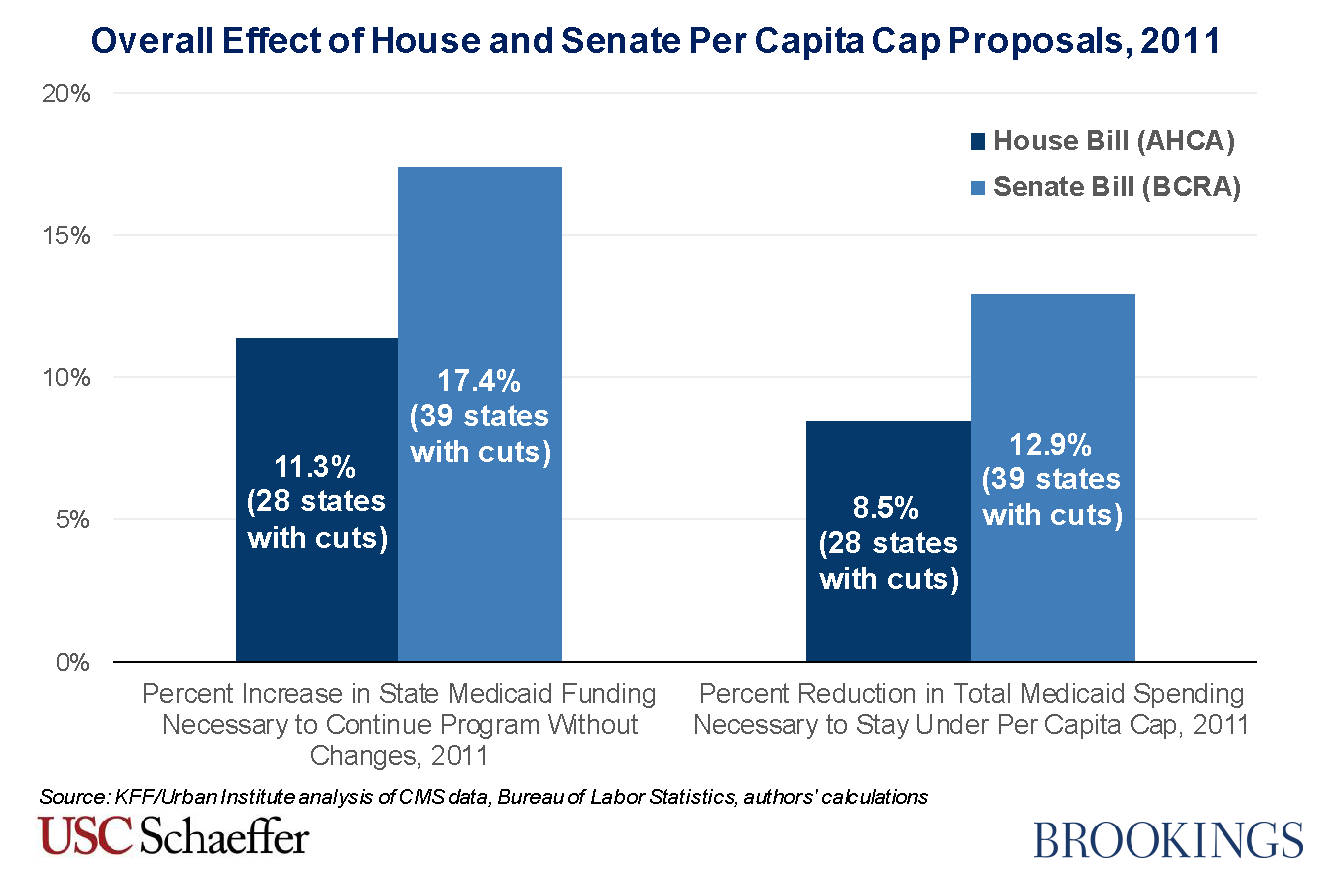
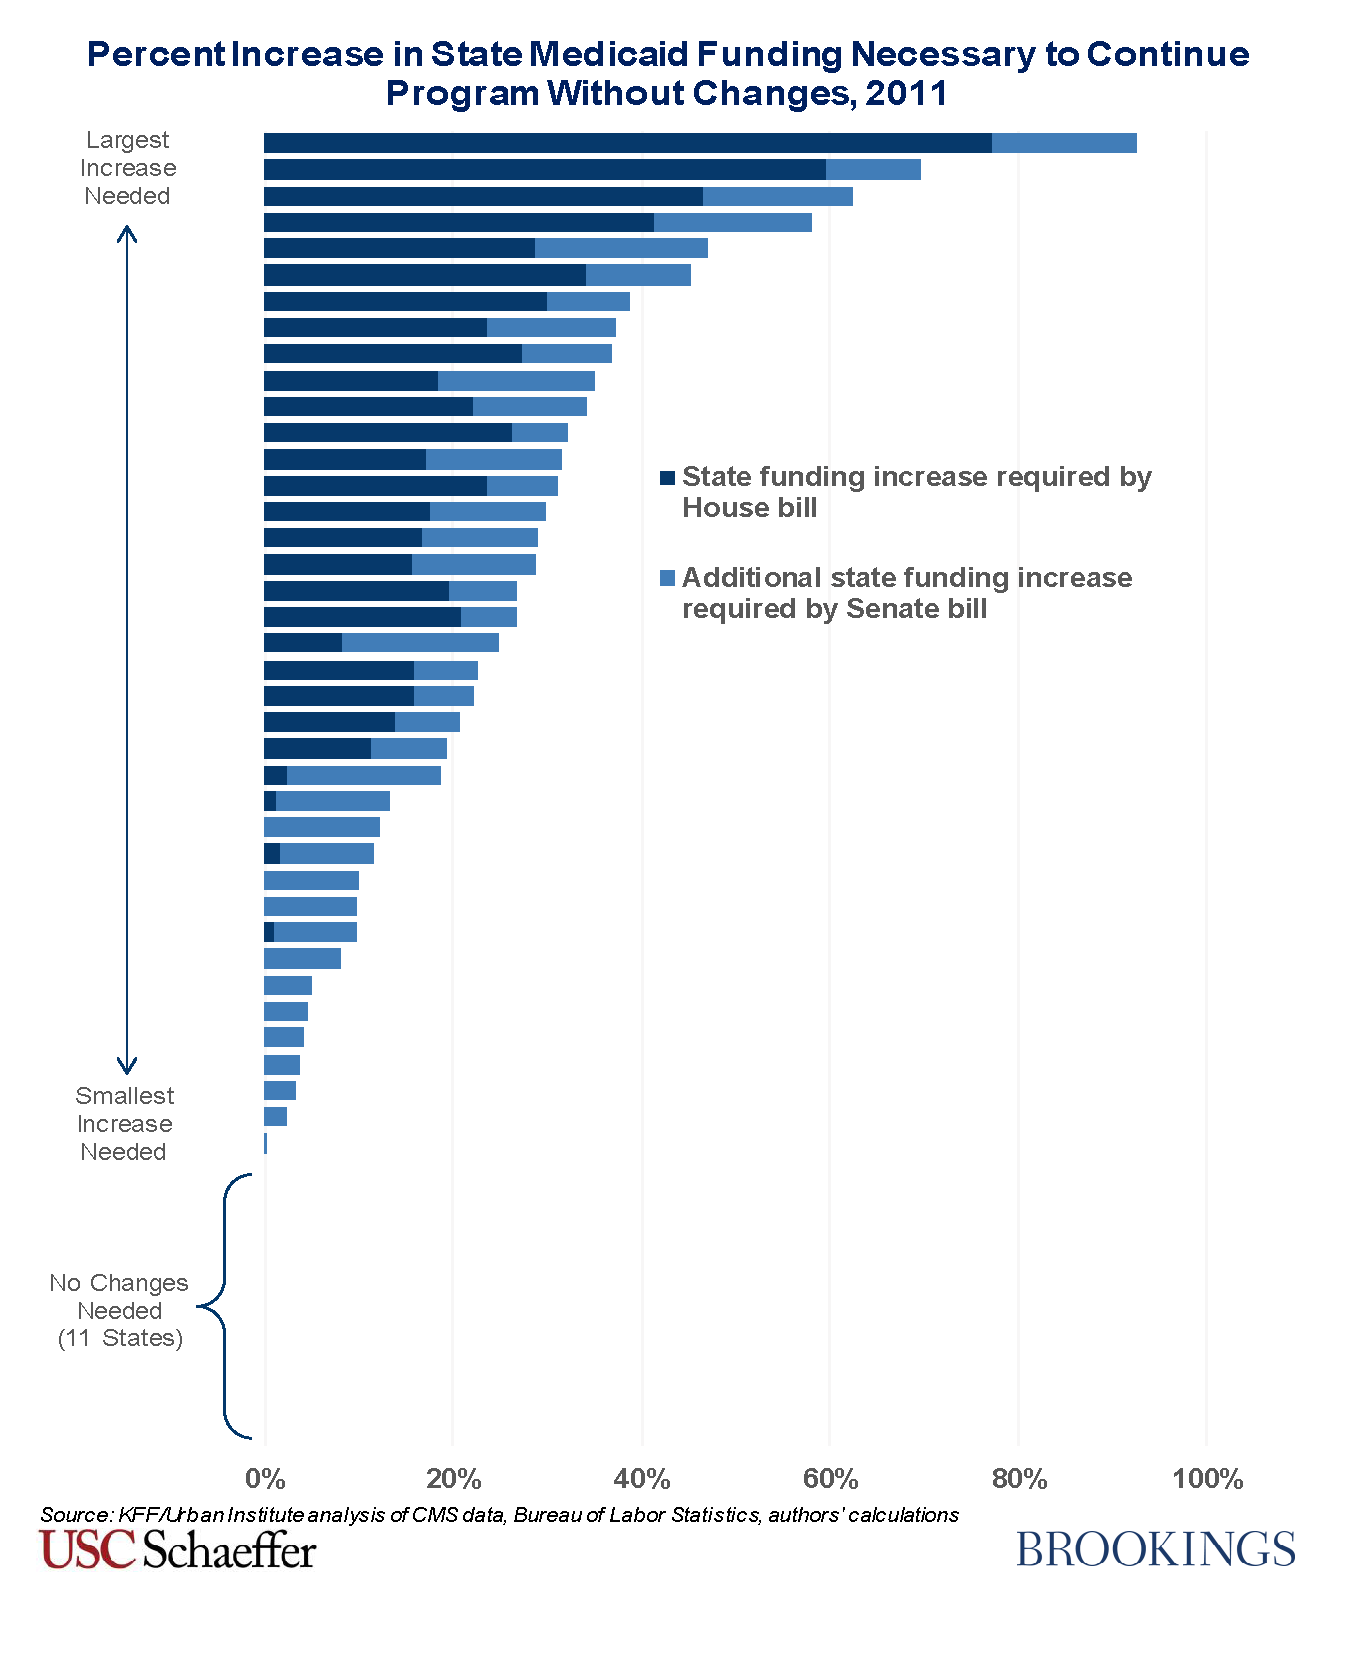
- About four-fifths of states would have seen funding reductions in 2011 under the Senate proposal, up from a bit more than half under the House proposal. Many more states would have faced very large cuts under the Senate’s proposal. We estimate that 19 states would have had to increase the amount of funding the state provided to its Medicaid program by more than 25 percent in 2011 in order to maintain their programs in their then-current form, with one state having to increase its funding to its Medicaid program by 93 percent in order to avoid cuts to its program. Under the House proposal, 9 states would have seen cuts this large.As under the House bill, no states would have received additional funding under the per capita cap. This finding reflects the “one-sided” nature of the both the Senate and the House’s caps. States that exceed the per capita cap receive less federal funding, but states who spend less than the cap do not receive additional funding. This is an underappreciated feature of a per capita cap that significantly increases the federal budgetary savings from the proposal. It is also an important difference relative to true capitation or block grant proposals under which a state would receive a fixed payment for each enrolled individual or for the program overall.

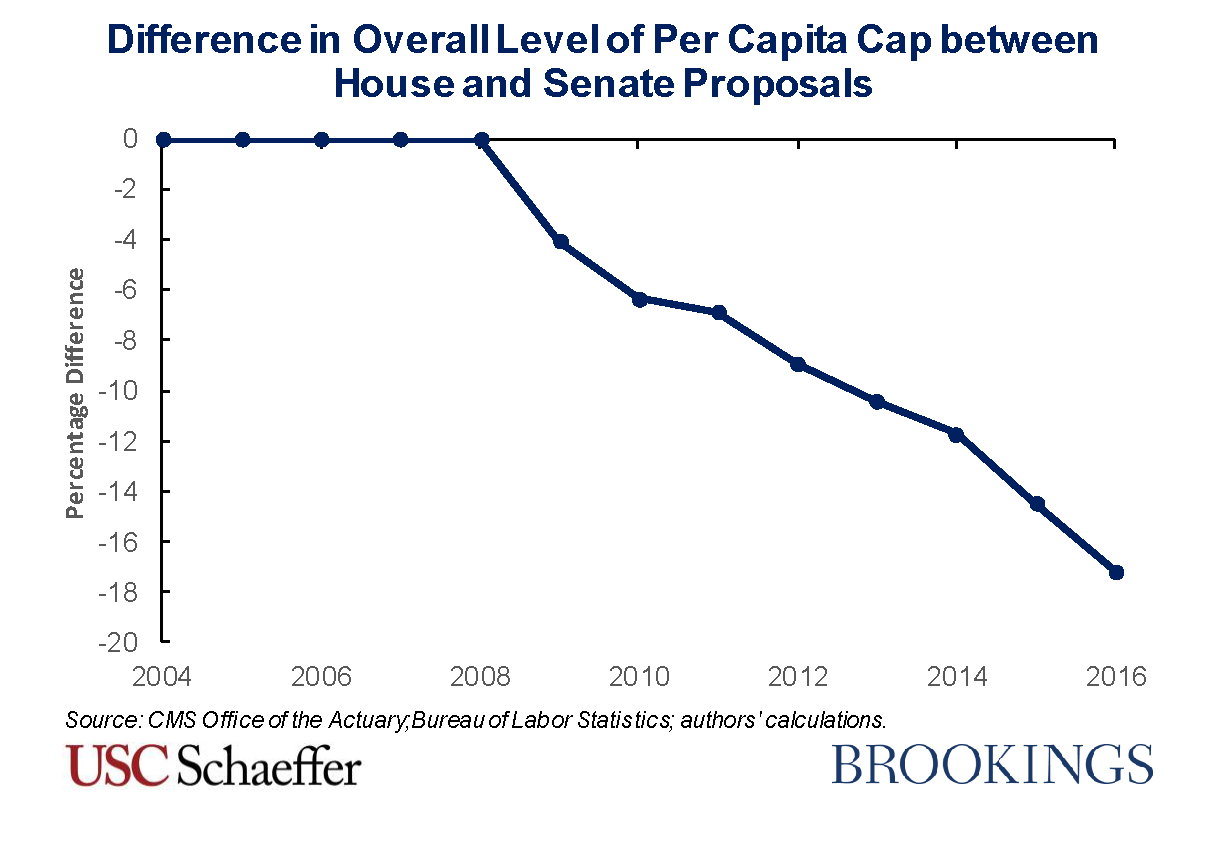
- Looking beyond 2011, reductions in federal Medicaid funding would have grown particularly rapidly under the Senate proposal. If a per capita cap like the Senate’s had been implemented in 2004, per capita spending targets would have been indexed to the CPI-U starting in 2009. As a result, the overall level of the per capita cap would have been 7 percentage points lower under the Senate proposal than under the House proposal by 2011. This differential would have grown rapidly, reaching 17 percent by 2016. This pattern is very likely to be repeated in the future, as the Congressional Budget Office projects that the CPI-M will grow at an average rate of 3.7 percentage points over the next ten years, compared to just 2.4 percentage points for the CPI-U.

- States that had a low level of spending per enrollee in the base year remain much more likely to face cuts under the Senate’s proposal, despite modifications apparently aimed at shifting cuts toward high-cost states. As described above, the Senate draft contains a provision that increases spending targets for states with low per enrollee spending and reduces spending targets for states with higher per enrollee spending. Despite these adjustments, states with below-median per enrollee costs in 2000 would have accounted for 79 percent of the total reduction in federal Medicaid funding attributable to the per capita cap in 2011, compared to 86 percent under the House’s proposal. Furthermore, due to the lower index, the total amount of cuts for states that started with relatively low spending would have been considerably larger: at $21.6 billion under the Senate’s proposal versus $15.3 billion under the House version.The larger cuts for states that had relatively low spending in 2000 reflect the fact that these states tended to experience faster cost growth in subsequent years. This type of “mean reversion” is a common phenomenon that is likely to recur in the future. The Senate’s upward adjustments for low cost states fail to offset this effect both because those adjustments are too small and because they are based on spending in the immediately preceding year, rather than spending in the base year. If the goal of a per capita cap is to encourage more efficient health care provision, concentrating cuts in states that have relatively low spending is challenging to justify, as low-spending states are particularly unlikely to be able to reduce spending without harming beneficiaries.

Methodological Appendix
This post uses the same general methodology as our earlier paper, but we make two adjustments to reflect the policy differences between the Senate discussion draft and the House bill:
- Indexing based on the CPI-U starting in 2025: The Senate proposal would grow the per capita spending targets at the same rate as the House through 2024, but switches to increasing the per capita spending targets based on the percentage increase in the CPI-U in 2025 and all subsequent years. Thus, when estimating what the effects of the Senate proposal would have been over our historical period, we increase the spending targets based on the CPI-U starting in 2009 (the year that corresponds to 2025 under the Senate proposal’s timeline).
- Adjustments for low- and high-cost states: The Senate proposal includes a provision that would reduce spending targets in high spending states and increase them in low spending states. Specifically, states with per capita spending at least 25 percent greater than mean per capita spending for a beneficiary category in a given fiscal year would see their target for that category reduced by 0.5 percent to 2 percent in the next fiscal year. States with spending at least 25 percent below mean per capita spending for a beneficiary category in a given fiscal year would see their target for that category increased by 0.5 percent to 2 percent in the next fiscal year. The Secretary would be permitted to choose any combination of reductions and increases within those ranges that did not increase overall program spending. States with a population density of less than 15 individuals per square mile would not be subject to this adjustment.To implement this adjustment, we assume that the Secretary would increase the per capita target for each qualifying beneficiary category in non-exempt states by a percentage at the midpoint of the specified range (1.25 percent). We then apply the percentage reduction to states with high per capita spending required to make the overall policy budget-neutral.
Related Books


There are two provisions of the Senate proposal that we are unable to incorporate into our estimates due to data limitations. First, we do not incorporate the provision of the Senate proposal that would allow States to choose any “base period” of the eight consecutive quarters falling within the period starting with the first quarter of 2014 and ending with the third quarter of 2017. Rather, we continue to use 2000 (which corresponds to 2016 in the implementation timeline under the House and Senate proposals) as the base period for all states. Second, we do not account for the fact that the Senate proposal would exclude blind and disabled children from the per capita cap. Accounting for these proposals would be unlikely to change our qualitative findings and would likely have only a modest effect on our quantitative results.
We estimate how the overall level of the per capita cap would have differed between the House and Senate proposal as follows. First, we compute the cumulative trend factor that would have applied to each beneficiary category using actual CPI-M and CPI-U data from the Bureau of Labor Statistics. Second, we compute the sum of the caps across states by multiplying these category-specific trend factors by per capita spending in that beneficiary category in the base year and enrollment in that category in the current year and then summing across beneficiary categories. For the purposes of these calculations, we rely upon data from the 2016 Medicaid Actuarial Report. These data incorporate both full and partial benefit enrollees, whereas the per capita cap applies only to full benefit enrollees, but including partial benefit enrollees likely has little effect on the results of this particular calculation. For 2014-2016, we omit Medicaid expansion enrollees because they were not present in the base year. Finally, we calculate the percentage difference between the caps that would have applied under the House and Senate proposals.
Authors


The Brookings Institution is committed to quality, independence, and impact.
We are supported by a diverse array of funders. In line with our values and policies, each Brookings publication represents the sole views of its author(s).