
Advocacy for universal preschool is booming. Although it has gained no traction in Congress, the bellwether of that advocacy is the Obama administration’s proposal for a new federal program, Preschool for All, which anticipates about $120 billion in additional federal and state expenditure over the next decade to provide all low- and moderate-income four-year-olds with free preschool.[i]
But, do we already have universal pre-K? We find based on our new analysis of data from the National Center of Education Statistics that 69 percent of the nation’s children who entered kindergarten in the 2010-2011 school year regularly attended a preschool program in the preceding year. This is 14 percent higher than the rate of attendance for this age group reported elsewhere, and provides a very different impression of unmet need than other reports, including those produced by the White House, that aggregate attendance rates for three- and four-year-olds. We also find, consistent with other reports, that rates of attendance vary considerably by the socio-economic status of parents. But our attendance rates are higher for all groups than sometimes reported elsewhere.
We use our numbers on present levels of participation to model the costs of providing universal access for four-year-olds to a voluntary half-day pre-K program. Costs per child are set at roughly half the mean national expenditure per pupil for full-day K-12 public education. Because pre-K is voluntary and not every family chooses to send their four-year-old to a center-based program, we estimate unmet need based on differences between existing enrollment rates for the highest socioeconomic quintile of families and those of each of the lower four SES quintiles. In determining unmet need, we also consider rates of attendance in the three states that currently offer universal free pre-K. We use a progressive income-based subsidy in which families in the lowest SES quintile pay nothing; those in the next quintile pay half the costs of attendance; those in the middle quintile pay three quarters of the cost of attendance; and those in the top two quintiles cover all of the tuition costs. We incorporate existing federal expenditures, including those for Head Start, and we include projections for substitution that include the likelihood that many families who would otherwise have covered the costs of attendance themselves would take advantage of the public subsidy.
We find that the additional costs to taxpayers of universal pre-K under our model is $2-$4 billion a year, with the lower number in the range more likely than the latter. That is a far cry from the Obama administration’s proposal for $12 billion a year in additional expenditure to achieve Preschool for All.
Introduction
Advocacy for universal preschool is booming, with the Obama White House in the lead. Arguments for significant expansion of federal and state support for preschool rest on two primary themes: access and investment. Both are highlighted in the first sentence of the White House webpage that describes President Obama’s policies on early childhood: “Expanding access to high quality early childhood education is among the smartest investments that we can make.”[ii]
Researchers as well as the segment of the advocacy community that uses research to support its preferred policies have focused on investment rather than access. In that context, predominate empirical questions involve comparisons of outcomes for similar children who do vs. do not attend preschool, or do vs. do not attend a particular type of preschool. Nearly all of the previous writing on preschool at Brookings and earlier academic research on that topic by one of us (Whitehurst) has been about investment.
Background on preschool access
Herein our focus is on the neglected topic of access. Let’s leave aside for present purposes questions about how much children benefit from preschool and address, instead, the extent to which there is unmet need and whether that varies by family background. This is an important area of investigation for at least two reasons. First, further expansion of publicly funded schooling into the preschool years is going to be expensive. Ideally such expansion would address unmet need rather than simply substitute a public subsidy for an expense and responsibility that parents are already able to meet. Thus it is important to estimate unmet need to model the costs and possible targeting of the subsidy. Second, advocacy rhetoric around the urgency of state and federal action to expand preschool funding asserts that the unmet need is large overall and particularly so among low-income families. Is it?
A detailed document that lays out rationales for President Obama’s early childhood policies was released by the White House in 2014. The boxed text and graph, below, is from that document.[iii]
You can see that the White House chose to combine data from three- and four-year-olds in presenting information on access. This is not helpful from a policy perspective since current efforts to expand access, including the administration’s own Preschool for All proposal, focus on four-year-olds rather than three-year-olds. Further, these two age groups differ dramatically in their level of participation in center-based preschool programs. Combining three- and four-year-olds to estimate preschool uptake is akin to combining 17- and 18-year-olds to estimate college enrollment rates.
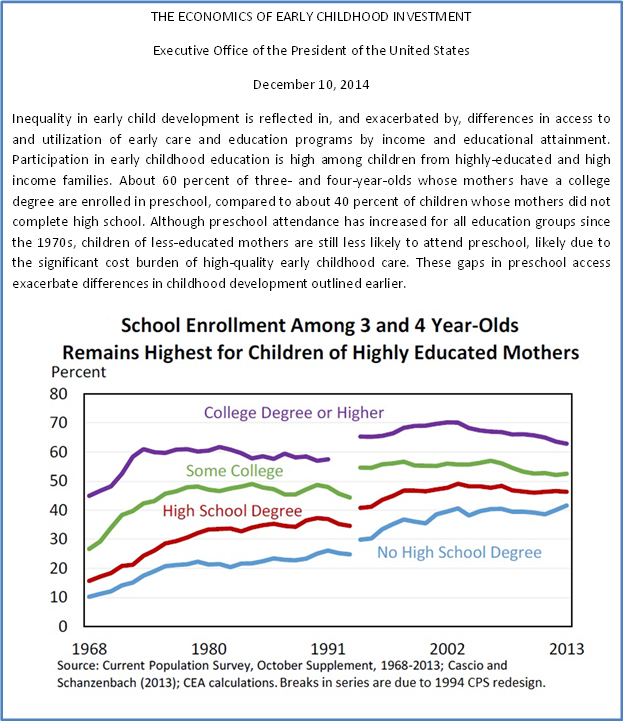
The takeaway from this White House document, which is the one the authors surely intend, is that levels of participation in preschool programs are relatively low in the U.S. (only 60% for children of mothers who are college graduates), and there are striking inequities in access by family education (a 20% gap in access for children of mothers who did not complete high school vs. those who completed college).
The same theme of socioeconomic disparities in access and low overall participation rates occurs over and over again in the policy advocacy literature. For instance, a recently released report by the Economic Policy Institute (EPI) concludes, based on different data than were used in the White House report, that only 55 percent of children entering kindergarten in 2010 had “received some center-based pre-K care … during the year prior to kindergarten”.[iv] The authors go on to document the large socioeconomic disparities around this mean of 55 percent, as indicated in the following segment of one of the tables in their report.
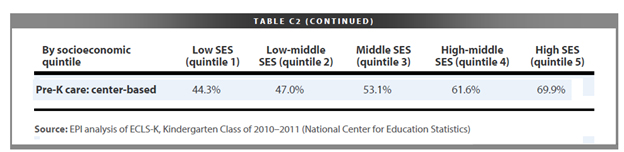
If you believe and want others to believe that preschool experience is important in preparing children for school and life and that it should receive substantially more public support, it is a powerful communication tactic to present statistics purporting to show that only a little more than half of the nation’s children experience preschool and that there are large differences in enrollment rates between the highest and lowest SES levels (25 percent per EPI).
Data quality issues
As it happens, the White House and EPI numbers are derived from one or the other of the two principal sources of data for estimating U.S. enrollment in center-based preschool programs. The first source, used in the White House report, is the Census Bureau’s October Supplement to the Current Population Survey (CPS). The second source, used in the EPI report, is the National Center for Education Statistics Early Childhood Longitudinal Study, Kindergarten Class of 2010-11 (ECLS-K:2011).
The numbers presented by the White House, EPI, and many others based on these datasets may be seriously misleading. Here is why:
Misleading aggregation. First, as we mentioned previously, the White House numbers are misleading because of the aggregation of three- and four-year-olds into a single estimate. The enrollment rate for three-year-olds is only about half of the rate for four-year-olds (42 percent vs. 68 percent based on the data source used by the White House).[v] A substantial portion of the lower enrollment rates for three-year-olds is probably due to parental preference not to enroll their three-year-old in a regular school. To the extent this is so, the lower participation rate for three-year-olds is not an issue of access. Reporting the average of the participation rate for the two age groups brings to mind the joke about the statistician who puts his head in an oven and his feet in a freezer and reports that on average he feels fine (or in this case, doesn’t have sufficient access to preschool).
Misleading survey questions. The CPS is a monthly household survey conducted by the Bureau of the Census involving roughly 60,000 randomly selected addresses across the U.S. Since the late 1960s, the National Center for Education Statistics (NCES) in the U.S. Department of Education has funded the October Supplement for the CPS, which gathers data on school enrollment and educational attainment for elementary, secondary, and postsecondary education. The gateway question on the CPS that leads to information about preschool enrollment, asked of the adult in the family who is being interviewed, is
Is (name of child) attending or enrolled in regular school?[vi]
The family member being interviewed is told that a regular school includes nursery school, kindergarten, elementary school and schooling which leads to a high school diploma or college degree.
If the answer to whether the child is attending a regular school is yes, then the family member is asked in which grade or year the child is attending. If the answer to grade or year is nursery school then that child is counted as being enrolled a center-based preschool. Otherwise, the child is counted as not being enrolled in preschool. The answers to these questions, along with the child’s age, are the basis for the numbers in the White House document on preschool enrollment for three- and four-year-olds.
These are a problematic couple of questions on which to base national policy. Suppose your child is attending Head Start. Is Head Start a regular school? If so, is it a nursery school? If you don’t consider it such, then the White House counts your child as not being enrolled in preschool. Suppose your child is attending a center-based program that is advertised as providing daycare. Is that a regular school and a nursery school? Is a Montessori program a regular school and a nursery school? What about a center-based play group? What about a program that serves children in the summer?
The problematic terminology in the CPS October Supplement is recognized by its sponsor, NCES, which cautions that “Problems [in data quality] may occur in the definition of nursery school….”[vii]
We’re left with real questions about the validity of CPS estimates. If respondents to the October Supplement don’t identify some types of preschool experience as nursery school, national enrollment estimates for center-based programs will be biased downward.
But even accepting the CPS estimates at face value, the reported enrollment rate for four-year-olds of 68 percent conveys a different level of urgency for action than aggregate rates for three- and four-year-olds per the previously presented White House document, keeping in mind that preschool is voluntary and not every parent or cultural group will want children to be in a center-based program before the start of regular school, particularly at the age of three.
Given the questions about the validity of data from the CPS October Supplement, it is very important to examine other data sources that bear on enrollment rates in center-based programs.
Problems in variable selection. The report by EPI, the second of the two reports mentioned previously, uses the Early Childhood Longitudinal Study, Kindergarten Class of 2010–11 (ECLS-K:2011) as the data source. The ECLS-K:2011, which like the CPS October Supplement is sponsored by NCES, follows longitudinally a national representative sample of roughly 20,000 children who started kindergarten in the fall of 2010. Parents were interviewed about their child’s preschool experience around the time the child started kindergarten, or in the spring of the kindergarten year if the parent did not provide answers to the relevant survey questions in the fall. Unlike the CPS, which asks only about nursery school attendance, the ELCS-K:2011 asks parents many questions about their child’s experiences in the year before kindergarten, and does so using language that is both more detailed and less likely to be misunderstood than the CPS October Supplement. Here is a key question from the ECLS-K:2011:
Did {CHILD} attend a day care center, nursery school, preschool or prekindergarten program on a regular basis the year before {he/she} started kindergarten?
Unlike the CPS question, the ECLS-K:2011 question unambiguously requires a yes answer for any type of regular center-based care, which is what we want for a valid estimate of attendance rates for four-year-olds.
But now we are left with the conundrum that many reports that utilize the ECLS-K:2011 describe much lower uptake rates than those reported by the CPS. As a case in point, the EPI report concludes, as noted above, that 55 percent of children entering kindergarten had “received some center-based pre-K care … during the year prior to kindergarten”. Remember the CPS estimate of 68 percent attendance for four-year-olds, which we hypothesized had a downward bias because it asks only about nursery school. Why would the ECLS-K:2011 produce an enrollment estimate that is 13 percentage points lower than the probably too low estimate derived from the CPS?
The problem that produces the much lower estimate from the ECLS-K:2011 than from the CPS is that the data provided to researchers by NCES includes a seductive composite variable, X12PRIMPK, which represents the non-parental care arrangement “in which the child spent the most hours per week during the year before kindergarten” [emphasis added]. For example, a child who attends a typical preschool program, i.e., half-day for five days a week for nine months a year, and also receives out-of-home care by her grandmother during the rest of the parents’ work week would be indicated under this variable as having received relative care in another home rather than having received center-based care — this because the child spent more time in relative care than in center-based care. The authors of the EPI report don’t indicate that the X12PRIMPK variable was the source of their estimate of 55 percent access to center-based pre-K for four-year-olds, but we can only replicate their estimate of 55 percent using that variable.
A large proportion of four-year-olds experience multiple care arrangements. When they are treated, as in the EPI report, as not having received center-based care if they spend more out-of-home hours elsewhere, the actual uptake rate of center-based care is substantially underestimated.
Our analysis
We approach the question of enrollment rates in center-based pre-K programs by categorizing children in the ECLS-K:2011 as having been enrolled in pre-K if their parent reported that the child had regularly attended a center-based pre-K program in the year before kindergarten, regardless of the time spent in other out-of-home settings. In other words, children were coded as having preschool experience if the parent replied affirmatively to the question: Did {CHILD} attend a day care center, nursery school, preschool or prekindergarten program on a regular basis the year before {he/she} started kindergarten?.[viii] Before answering this question, the parent was informed that a center-based program is a day care center, nursery school, preschool or prekindergarten program; that it includes any type of formal program that provides care and supervision; that it may be in a child’s school or in another location, such as a church or a free-standing building; and that Head Start programs, nursery schools, preschools, and prekindergarten programs (some of which may be sponsored by the state) are also included.
We find based on the ECLS-K:2011 that 69 percent of the nation’s children who entered kindergarten in the 2010-2011 school year regularly attended a preschool program in the preceding year.[ix]This is similar to the CPS-based estimate of 68 percent for four-year-olds, and quite different from the EPI report of 55 percent, which only counts a child as having pre-K experience if that child spends most of their time in a pre-K center.[x]
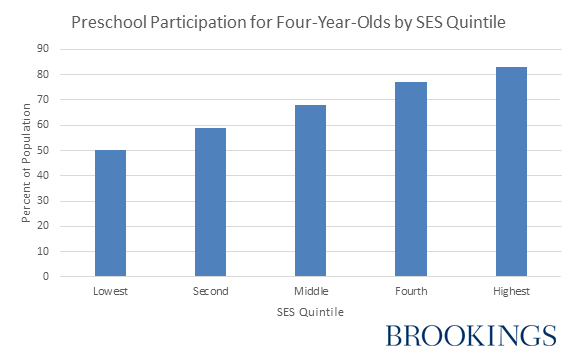
We find that, consistent with the general conclusions in the White House and EPI reports but differing in the precise estimates in those two reports, rates of attendance vary considerably by the socio-economic status of parents.[xi] As illustrated in the following figure, they range from 50 percent for the lowest quintile of socio-economic status to 83 percent for the highest quintile.
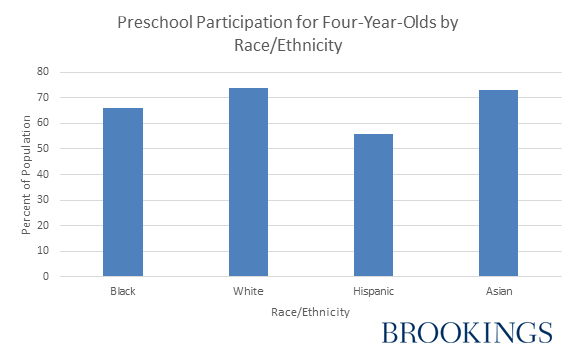
One might expect that these differences in pre-K attendance by SES would be associated with differences by race/ethnicity. They are, but, perhaps not as one might think. The median household income of whites and Asians is more than 60 percent higher than for blacks[xii] whereas the gap in pre-K attendance between these groups is a modest 7%-8%. In contrast, the household income gap between Hispanics vs. whites and Asians is smaller than the gap for blacks, but the gap in pre-K attendance is quite large at 18 percent, as illustrated below.
There is some evidence that the disproportionately lower attendance rate for Hispanics is at least partially a reflection of cultural values rather than lack of access in that Hispanics prefer home-based to center-based providers.[xiii] In any case, from a policy and empirical perspective this is not the pattern one would want to see in that a number of studies find that Hispanic four-year-olds compared to children from other racial/ethnic groups benefit disproportionally from attending preschool. In fact, a recent reanalysis of the results from the National Head Start Impact Study (a methodologically rigorous, nationally representative randomized trial) finds that it is only Hispanic children learning English that show any benefit from Head Start at the end of the Head Start year.[xiv]
What does this mean for public policy?
Roughly 70 percent of the U.S. population of four-year-olds presently attends a pre-K program regularly in the year prior to kindergarten, not the roughly 50% that some other reports suggest.
If we assume that families in the top quintile of the distribution of socio-economic status can send their four-year-olds to a regular center-based preschool program if they wish (i.e., programs are available to serve these children and the families can afford the tuition), then the ceiling for attendance of four-year-olds in a publicly funded program is likely to be no higher than it is for high SES families (83% in the ECLS-K:2011), and probably lower based on cultural preferences for family-based vs. center-based care, and based on attendance rates for four-year-olds in the three states that offer universal free pre-k for four-year-olds (Georgia = 58%; Florida = 79%; Oklahoma = 74%).[xv]
Let’s do some back-of-the-envelope calculations on unmet need and the costs of eliminating it through public subsidies. We’ll err on the upward side and set the attendance ceiling for publicly funded programs at 80 percent rather than the lower rates in current universal pre-K states. Unmet need in our calculations is defined as the difference between 80 percent and the current enrollment rates by SES quintile.
We will model a progressive income-based subsidy in which families in the lowest SES quintile pay nothing; those in the next quintile pay half the costs of attendance; those in the middle quintile pay three quarters of the cost of attendance; and those in the top two quintiles cover all of the tuition costs. For the sake of this simulation, it makes no difference whether the taxpayer subsidies are delivered through vouchers to parents, tax-credits, or grants to states.
There are approximately four million four-year-olds in the U.S. population[xvi], and thus each SES quintile has 800,000 members. Unmet need is the difference between 80 percent and the enrollment rates illustrated in a previous figure on participation by SES quintile. Thus, there is unmet need for 30 percent of the four-year-olds in the lowest quintile, 21 percent in the second to lowest quintile, 12 percent in the middle quintile, and 3 percent in the fourth quintile. Unmet need in the top two quintiles carries with it no public subsidy.
We only have to assign a subsidy value for a pre-K program and do some simple math to determine the public costs of providing universal national access to center-based care for four-year-olds. Costs vary dramatically by region of the country, e.g., less than $3,000 per child for Florida’s Voluntary Pre-K program to over $17,000 per child per year in Boston’s public program.[xvii][xviii]The higher costs programs are full-day and rare whereas about half the four-year-olds presently served in center-based care are in part-day programs that are much closer to the Florida cost level than to Boston’s.[xix]
We will estimate the costs for eliminating unmet need with half-day programs – that would seem to be the place to start given the prevalence of such programs rather than modeling the costs of a politically improbable leapfrog from a situation in which a significant proportion of families have no access to a situation in which all those families have access to high cost full-day programs. We’ll use $5,500 as the average cost per child for a half-day pre-K program because this is almost exactly half of the current average expenditure nationally for K-12 students for full-day programs.[xx] Preschool programs are usually less expensive to deliver than K-12 programs because they often don’t pay teachers as much as K-12 teachers and because they are often operated by private non-profits rather than by public schools. In this context, an estimate of the cost per preschooler for a half-day program that is set at 50 percent of the cost of providing a full-day program for a child in regular school is likely on the high side.
The cost estimates generated by our model are in the table that follows. In the scenario we lay out, the additional taxpayer costs in present dollars of providing universal half-day pre-K for four-year-olds over the next decade would be roughly $19 billion (understanding that such a program would be means tested as described previously, would intend to provide coverage to those in circumstances similar to those who are presently not obtaining services, and would be delivered with very low administrative costs at the federal and state levels).
|
SES Quintile |
Totals |
|||||
|
Lowest |
Second |
Middle |
Fourth |
Highest |
||
|
Number of unserved 4-year-olds |
240,000 |
168,000 |
96,000 |
24,000 |
0 |
528,000 |
|
Multiplier for $5,500 costs per child |
1.00 |
0.50 |
0.25 |
0.00 |
0.00 |
|
|
Costs of new public subsidy |
$1.32 billion |
$.46 billion |
$.13 billion |
$0 |
$0 |
$1.91 billion |
We do not attempt to model the impact of parents substituting a new government subsidy, as available under our scenario, for a service that they would otherwise have obtained without direct government assistance. For example, we do not try to estimate how many parents in the middle SES quintile who under present circumstances would obtain child care on their own would utilize a government subsidy should it become available. Evidence clearly indicates that such substitution occurs when government introduces a free, universal preschool program, and that it primarily takes the form of higher SES families switching from unsubsidized to free pre-K.[xxi] To the extent this occurs, the costs for taxpayers would be higher than our estimates in the previous table.
The problem is mitigated in our model because the subsidy is means tested and thereby not available at all to the upper 40% of families and available fully only to the lowest SES quintile. Further, because most poor and near-poor parents already receive a fully subsidized service through the federal Head Start and the Child Care Development Block Grant programs, and through state and local initiatives, changes in their behavior associated with the policy we model would not increase costs. But this lowers the un-modeled costs of substitution — it does not eliminate them.
We can estimate the extreme of potential substitution costs by assuming that no family in the second and middle quintiles is presently receiving a subsidy and that every family in those two quintiles would take the subsidized service, thus increasing the number of unserved 4-year-olds in those quintiles up to the 80 percent benchmark. We can assume per the prior discussion that those in the lowest quintile who are presently receiving services are fully subsidized and thus substitution costs in the lowest quintile are already captured in the tabled estimate. Under these assumptions, costs for the second quintile would rise from the previously estimated $ .46 billion to $1.76 billion, whereas costs for the middle quintile would rise from $ .13 billion to $.88 billion. Total annual costs would rise from $1.91 billion to $3.96 billion. Cost over a decade would then roughly double to about $40 billion.[xxii]
This is the extreme outside cost estimate under our model assumptions, and does not include any of the efficiencies that could be obtained by redesigning the current annual $20+ billion federal expenditure on early care and learning, e.g., by delivering the funds directly to parents in the form of scholarships, a.k.a vouchers, rather than through a mishmash of over 40 overlapping and uncoordinated programs.[xxiii]
If the estimate of the costs of a policy that should generate universal preschool access for four-year-olds is $40 billion over 10 years at the outside and the actual costs would almost surely be substantially less, why did the Obama administration propose for the 2014 federal budget a new federal expenditure of $66 billion over the next decade to support Preschool for All, with an equivalent match by states – about $120 billion in additional expenditure?[xxiv] Could part of the reason be that the administration believed its own misleading data on access that were generated by combining participation rates for three- and four-year olds?
Preschool and how to pay for college are going to be the two leading education topics in the 2016 presidential race. A proposal for a new program that would add $2+ billion a year to the roughly $20 billion a year the federal government already spends on early learning and child care[xxv] is a very different beast than a proposal that would more than double current levels of expenditure. Whatever the policy preferences of the candidates, let’s hope they will use the right numbers on present need and will be clear about the nature of the new programs they are proposing and the basis for their projected costs.
[i] https://www.whitehouse.gov/the-press-office/2013/02/13/fact-sheet-president-obama-s-plan-early-education-all-americans
[ii] https://www.whitehouse.gov/issues/education/early-childhood
[iii] https://www.whitehouse.gov/sites/default/files/docs/early_childhood_report1.pdf page 13
[iv] http://s4.epi.org/files/pdf/85032c.pdf
[v] https://nces.ed.gov/programs/digest/d14/tables/dt14_202.20.asp
[vi] https://www.census.gov/prod/techdoc/cps/cpsoct12.pdf
[vii] http://nces.ed.gov/statprog/handbook/cps_dataquality.asp
[viii] The interviewer also provided the parent an explanation of “regular basis”: “An arrangement or program occurring on a routine schedule (i.e., occurring at least weekly or on some other schedule). Do not include occasional babysitting or “back up” arrangements that are just used once in a while.”
[ix] Regular PreK attendance [includes information from the fall and spring parent surveys on variables P1CPREK + P2CPREK from the ECLS-K:2011 restricted use dataset. Data for this and subsequent analyses reported herein are weighted using W12PO to obtain correct population estimates].
[x] The similarity in the estimates from the CPS and the ECLS-K:2011 is reassuring for our purposes but it does not necessarily mean that either is valid. Parents frequently misstate the nature of their child’s preschool experience. For instance, in the ECLS-K only 53% of children who had been reported by their parents to have attended Head Start could be verified through Head Start records as actually having attended. Ideally, we need statewide administrative records on all pre-K attendees to generate valid participation rates.
[xi]The measure of SES is variable X12SESL from the ECLS-K:2011 restricted use dataset. The five components used to create the SES variable by NCES are as follows: Parent 1/guardian’s education; Parent 2/guardian’s education; Parent 1/guardian’s occupational prestige score; Parent 2/guardian’s occupational prestige score; and Household income.”
[xii] Source: U.S. Census Bureau, Current Population Survey, 2013 Annual Social and Economic Supplement
[xiii] http://gse.berkeley.edu/sites/default/files/fuller_et_al1996.pdf
[xiv] http://www.mdrc.org/sites/default/files/quantifying_variation_in_head_start.pdf
[xv] http://nces.ed.gov/pubs2014/2014078.pdf
[xvi] http://nces.ed.gov/programs/digest/d14/tables/dt14_202.10.asp?current=yes
[xvii] http://curry.virginia.edu/uploads/resourceLibrary/EdPolicyWorks-Report-FL-VPK.pdf
[xviii] http://onlinelibrary.wiley.com/doi/10.1111/cdev.12099/abstract?deniedAccessCustomisedMessage=&userIsAuthenticated=false
[xix] https://nces.ed.gov/programs/digest/d14/tables/dt14_202.20.asp
[xx] https://nces.ed.gov/fastfacts/display.asp?id=66
[xxi] https://www.brookings.edu/~/media/Projects/BPEA/Fall-2013/2013b_cascio_preschool_education.pdf?la=en
[xxii] Take the 640,000 families in each quintile that we assume want their children in a pre-K center. Multiply 640,000 by $5,500. Multiply that product by the subsidy rate for that quintile, e.g. .25 for middle quintile. Result is annual expenditure. For example, for the middle quintile: 640,000 x $5,500 = $3.52 billion. $3.52 billion x .25 = $.88 billion.
[xxiii] http://www.gao.gov/assets/670/660685.pdf
[xxiii] http://thinkprogress.org/education/2013/04/10/1846061/obama-budget-includes-66-billion-to-fund-preschool-for-all-initiative/
[xxv] Author’s calculations of most recent data on federal budget expenditures on Head Start, Tax Credits, the Child Care and Development Block Grant, the Child Care Mandatory and Matching Funds of the Child Care and Development Fund, and federal TANF funds to states used for child care, including transfers to Child Care and Development Fund
The Brookings Institution is committed to quality, independence, and impact.
We are supported by a diverse array of funders. In line with our values and policies, each Brookings publication represents the sole views of its author(s).