
Part III of the 2013 Brown Center Report on American Education
 As recently as 1990, taking algebra in eighth grade was unique. That has changed dramatically in recent years, and now more eighth graders take algebra than any other math class. Enrollment in eighth-grade algebra—and in other advanced math classes—varies by state. This section of the Brown Center Report exploits that variation to study the relationship of states’ enrollment in advanced math classes and scores on NAEP. The research question is whether a relationship exists between changes in advanced math enrollments and changes in 8th grade NAEP scores. Do states that boost advanced enrollments experience a concurrent increase in achievement? A second analysis uses the same technique to look at the potential that advanced courses are being “watered down.” Are rising enrollments associated with lower mean achievement in advanced classes?
Background
In 1982 Robert Moses was awarded a MacArthur Fellowship. He used the money to start The Algebra Project, a community-based effort to bring algebra to historically underserved middle school students—primarily, children from low income households and students of color. Moses called algebra “the new civil right,” an invocation of equity that cast course taking in a new light.32 The Clinton Administration tied the equity theme to international competitiveness and pushed for more students to take algebra before high school. “Around the world, middle students are learning algebra and geometry,” President Clinton observed. “Here at home just a quarter of all students take algebra before high school.”33
Algebra soon came to be known as a “gatekeeper” course, a class standing like a sentry at the gateway to college. Take it and pass it and your odds of attending college were good. Take it and fail it and at least you had been exposed to challenging mathematics. Don’t take it at all and your chances of attending college were near zero. Algebra’s place in the typical high school math sequence enhanced its importance. Assume that college-going students should get some calculus under their belts in the senior year. In most high schools, a student who takes Algebra I in ninth grade has three remaining years to take Algebra II, Geometry, Pre-Calc/Trigonometry, and then Calculus. That’s four courses. Something has to give. Many schools change the order of the courses, and some mix in statistics with one of the year’s offerings, but the fact remains: if taking Calculus as a senior in high school is the goal, taking Algebra I in ninth grade means there are four courses to complete in three years. Taking algebra in eighth grade opens up an additional year for advanced math.
Equity, international competiveness, and practical concerns about course sequences converged in the mid 2000s to boost the campaign for eighth-grade algebra. An “algebra for all” movement emerged that pushed universal, mandatory eighth-grade algebra. Minnesota established a new high school graduation requirement that, beginning with the class of 2015, all students must complete an Algebra I credit by the end of eighth grade. California used its school accountability formula to promote eighth-grade algebra, offering a choice of two eighth-grade math assessments (algebra and general eighth-grade math) but then, in the formula for calculating Academic Performance Index (API), discounting the performance level of students taking the general math test (for example, downgrading to “basic” those students who took the test and scored “proficient”). That incentive motivated schools to dramatically increase eighth-grade algebra enrollments, and although the AYP rule was later tossed out by the courts, California ranks as the top state in the nation for eighth-grade algebra and advanced math enrollments.34
NAEP Data on Advanced Math Enrollment
Table 3-1 illustrates the steady increase of U.S. eighth-grade enrollment in advanced mathematics courses. The data are taken from the NAEP eighth-grade math assessment. Students are asked: “what mathematics class are you taking this year?” The category “advanced mathematics” combines several responses, including Algebra I, courses that stretch Algebra I content over two years (whether it’s the first or second year of such a course), and courses that typically are more advanced than Algebra I, including Algebra II and Geometry. This amalgamated response is noisy and receives further discussion below.
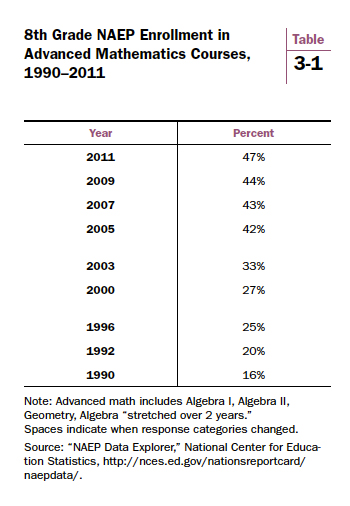
In 1990, only 16% enrolled in an algebra course, compared to 20% in pre-algebra and 61% in 8th grade math. In this paper, the latter two courses are referred to as “basic.”
By 2011, nearly half (47%) of all eighth graders took algebra or a more advanced course. Only 48% were in a basic math course, down from 81% in 1990. The advanced math percentage may be understated in Table 3-1 for the years prior to 2000 as that was the first time geometry, advanced algebra, and algebra stretch classes were response categories in the NAEP questionnaire for eighth graders.35 Moreover, some students—both then and now—may mistakenly believe they are in an algebra or geometry class when in fact they are not. Notwithstanding these data limitations, advanced math enrollments clearly rose substantially from 1990 to 2011.36
More and more students are taking advanced math classes earlier and earlier. Is this a good idea?
Research on the Efficacy of Eighth-grade Algebra
The National Educational Longitudinal Study of 1988 (NELS) offers researchers a trove of information collected from a randomized sample of students. Several studies have used NELS data to investigate what happens when students take advanced math early in an academic career, whether eighth or ninth grade.37 Researchers found gains for students taking algebra earlier rather than later, including—and this is important for the equity goal—low performing students. A recent meta-analysis of research on the topic (by Mary K. Stein and colleagues) reaffirmed that positive finding, with the caveat that “achievement gains occurred in settings where policies were accompanied by strong supports for struggling students, particularly more time for algebra instruction. We do not have strong evidence that universal algebra policies lead to achievement gains minus those strong supports.”38
More recent evaluations of policies expanding algebra enrollment have raised cautionary flags. Chicago mandated that all ninth graders take what had been regarded as college preparatory classes, including algebra. Evaluators followed students for several years and concluded, “Although more students completed ninth grade with credits in algebra and English I, failure rates increased, grades slightly declined, test scores did not improve, and students were no more likely to enter college.”39 Studies of California’s algebra policies found a trade-off: rising enrollments but also a rising number of failures. In North Carolina, researchers from Duke uncovered negative results after studying a Charlotte-Mecklenburg initiative to expand algebra in eighth grade: lower scores on the Algebra I test and then lower pass rates in Geometry and Algebra II in subsequent years.
Why have the more recent studies produced bleaker findings than suggested by the earlier work? The Duke researchers believe selection bias skewed the earlier findings. Stronger math students take algebra in eighth grade, and although they indeed may benefit academically from the course, that does not mean that weaker students will also benefit from taking algebra earlier. “Once this selection bias is eliminated, the remaining causal effect of accelerating the conventional first course of algebra into earlier grades, in the absence of other changes in the math curriculum, is for most students decidedly harmful.”40
The Stein et al. meta-analysis and the Duke team’s policy recommendations, although different in emphasis, do share a small patch of common ground. Stein et al. say that without “strong supports” achievement gains cannot be expected. And the Duke researchers foresee harmful effects “in the absence of other changes in the math curriculum.” One is contingently positive, the other contingently negative. The common ground that they share is in forecasting the potential for a neutral effect.
Let’s return to NAEP and see what its data have to say about state efforts to encourage enrollment in advanced math courses in eighth grade.
Analytical Method
Are eighth-grade enrollments in advanced math related to states’ math scores on NAEP? To answer this question, an obvious first step is simply to examine the list of states, their NAEP scores, and the percentage of each state’s students taking algebra, geometry, and other advanced math courses in eighth grade. There is no clear relationship. In 2011, the correlation between states’ advanced math enrollments and NAEP achievement is 0.07, indistinguishable from 0.00. States with more eighth graders taking advanced math classes are no more likely to register a higher NAEP score in math than states with lower enrollments in those classes.
This kind of cross-sectional analysis is a reasonable place to start, but it’s limited to revealing correlations between variables at a single point in time. That can be misleading. A study in the 2007 Brown Center Report, for example, showed how the number of instructional minutes that nations devote to math instruction is unrelated, on a cross-sectional basis, to national math achievement. In 1995, the correlation was 0.05. In 2003, the correlation was -0.20. Neither statistic is significantly different from 0.00. But when nations are examined longitudinally, and data from the two cross-sections are modeled as change variables, the question under scrutiny is shifted to whether national changes in instructional minutes from 1995 to 2003 are related to changes in test scores over the same time period. The correlation for that relationship is 0.42, which is statistically significant. Countries that increased the amount of time devoted to math instruction tended to experience a rise in TIMSS math scores; those countries that decreased the time devoted to math instruction tended to see their scores fall.
Why is the analysis of change variables beneficial? Two reasons. The first is that the technique helps to control for bias introduced by omitted variables (including selection), a shortfall plaguing cross-sectional analyses of achievement. In the case of instructional minutes, for example, school systems might strategically decide to place low achieving students in longer classes to help them catch up. That would make it appear that more instruction is associated with lower achievement. Assuming that omitted variable bias is present at both the beginning and end points of the time interval under study—and the relationship to the dependent variable (the outcome of interest) remains consistent over the interval—such bias washes out in the calculation of change (see Gustaffson, 2007, for further explanation and applications to other educational questions).41
The second benefit of this approach is that it poses a question paramount to policy analysis. Considering whether to adopt policy X leads to the question: if we adopt policy X, what is the expected change in outcome Y? What will happen? The cross-sectional question is this: what is the relationship of policy X to outcome Y at one point in time? One often hears of cross-sectional analyses showing something along the lines of “a one-standard deviation change in X would result in the following change in Y,” but the prediction is only inferred, there being no observations of change (or data from different time periods) in the data set.
Analysis of Change Using NAEP Scores
The relationship between change in policy and change in outcome is the subject of the analysis below. The time period examined is 2005 to 2011. Be aware, notwithstanding the improvement over cross-sectional analysis, that the analysis is still only correlational and thus confined to generating plausible hypotheses for more rigorous research designs. No causality is asserted here.
Table 3-2 shows the tail end of the long term trend sketched in Table 3-1—enrollment gains in advanced math classes and declines in basic classes. The slow, steady national trend masks considerable variation among the states. In 2005-2011, the average state increase in advanced math enrollments (as a proportion of eighth graders) was 5.5%, with a standard deviation of 8.4%. The top four states that boosted advanced enrollments were Minnesota (35%), and Pennsylvania, Virginia, and Washington (all with 17%). In contrast, two states stand out for going against the national trend with shrinking advanced math enrollments: Nevada (-22%) and Georgia (-17%).
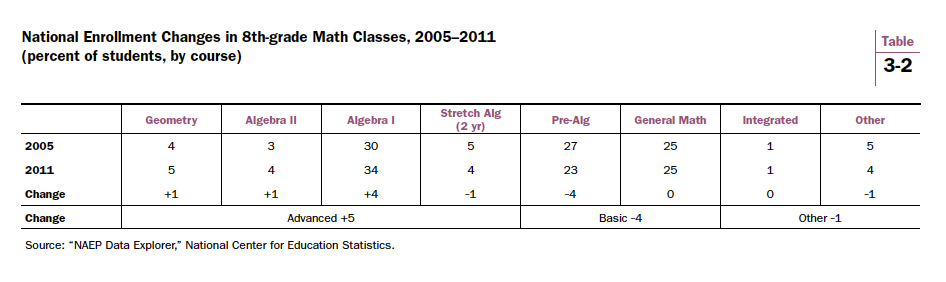
In terms of specific courses, forty-five states boosted enrollments in Algebra I, while only three states shrank enrollments and three stayed the same (in this discussion of NAEP scores, the District of Columbia is considered a state). Twenty-eight states decreased enrollments in general math, twenty increased, and three stayed the same. In general, course enrollments behave like a tube of toothpaste—squeeze on one end and the other end bulges. States with rising advanced math enrollments experienced shrinking enrollments in basic courses. And vice versa. The two states singled out for declining enrollments in advanced math courses illustrate the point. Their basic math enrollments rose. Nevada’s pre-algebra enrollments jumped 27%. Georgia’s percentage of students in general math rose 33%.
Is there a relationship between states’ change in course enrollments and change in NAEP scores? Did states experience gains on NAEP concurrent with increases in eighth graders taking advanced math? A series of correlation coefficients were computed to investigate these questions (see Table 3-3). The first model examines the relationship of advanced math enrollments and NAEP composite scores. The correlation coefficient (r = -0.01) is statistically indistinguishable from 0.00.
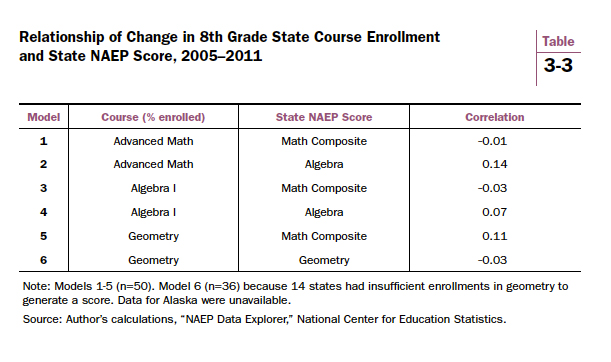
The NAEP composite score may assess mathematics too broadly to pick up the effects of emphasizing advanced math, which primarily involves boosting algebra. Fortunately, NAEP reports scores on specific content areas assessed within the test (called “strands”), including algebra and geometry. So the second model uses the NAEP subscore for the algebra strand as the achievement variable, which should be more sensitive to increased knowledge of algebra. Again, no significant relationship is found.
The third and fourth models use change in Algebra I enrollments as the course variable, instead of advanced math, in case aggregating several courses into the “advanced” category has muddied the waters. The change in composite NAEP score serves as the achievement variable in the third model and the change in the algebra strand score as the achievement variable in the fourth model. Neither correlation attains statistical significance.
Models five and six repeat the same treatment with geometry. Change in geometry course taking in eighth grade is used as the course variable—and the models calculate whether it is correlated with change in the NAEP composite in model five and change in geometry score in model six. Neither correlation is statistically significant.
In addition to the correlations reported here, multivariate regressions were run with three covariates controlled (also variables representing change)—change in state rates of child poverty, English language learners, and black and Hispanic students—demographic characteristics that are known correlates of state NAEP scores. The Great Recession unfolded during the time period under study, and some states, for example, witnessed growing rates of child poverty more than other states. If states experienced demographic changes, that could skew the results. It turned out not to be the case. None of the regression models were statistically significant.
In sum, no evidence was found in NAEP scores of a relationship between states raising enrollment in advanced math courses and raising achievement. States that increased the percentage of students taking algebra or geometry in eighth grade were no more likely to post NAEP gains than states with decreased enrollments in those two courses.
Do Rising Enrollments Water Down Advanced Math Courses?
Whether advanced math courses are watered down because of increasing enrollments is an important question. The notion is that filling advanced classes with academically weaker students than in the past could diminish the amount of learning that the courses are able to impart. That could help to explain the neutral correlations reported above. It could also help to explain the neutral—or even negative effects—revealed by recent evaluations of policies promoting universal algebra in eighth and ninth grades. NAEP data can only go so far in indicating whether watering down is taking place, but they do offer interesting insights into how course-shifting and achievement may be related.
Table 3-4 reports correlations between enrollment change and change in the mean achievement of students taking each course. Data from four courses are displayed. Again, the percentage of a state’s eighth graders taking each course serves as the enrollment variable. The courses are arranged hierarchically. Geometry is typically offered for the most advanced students and general math for the weakest ones. Three correlations are statistically significant.
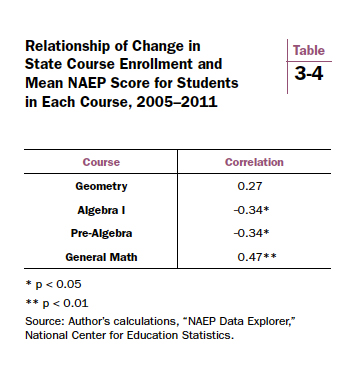
Is there evidence of watering down? Yes, but not in all advanced courses. Let’s start with the results supporting the watering down hypothesis. Increases in Algebra I enrollments are negatively associated with achievement gains (r = -o.34, p < .05). Let’s be clear what that means. The average state registered a 5.6 NAEP scale score gain among its Algebra I students. The NAEP scores for students in Algebra I classes did not go up as much in states that raised enrollments in Algebra I (+5.2) as in states that either held enrollments constant or decreased them (+9.2). For Pre-Algebra, rising enrollments are also negatively associated with test scores (r = -0.34, p < .05). Both correlations are consistent with the watering down hypothesis if students who would otherwise be placed in lower courses are migrating upward to higher courses. We cannot tell whether that is happening using NAEP data. And, to issue an important warning once again, correlations do not prove causality.
The strongest correlation involves General Math (r = 0.47, p < .01). The positive association is also consistent with the watering down hypothesis. If the overall trend is to move students into upper-level courses—and schools are selective in the students they accelerate—General Math courses, as they shrink, should be increasingly dominated by the students who struggle the most at math. These courses presumably would have lost their best students. Falling enrollments would therefore be associated with falling scores. General Math classes that manage to keep the students who are being accelerated elsewhere would, comparatively, register higher scores.
Geometry complicates matters. Its correlation coefficient (0.27) is inconsistent with the watering down story. Geometry sits at the top of the course hierarchy. Any indiscriminate acceleration of students upward (an inextricable assumption of the watering down argument) should ultimately result in a negative association of enrollment gains and achievement scores in the course at the top. And yet, Geometry’s correlation coefficient has a positive sign and approaches statistical significance. Although statistically indistinguishable from 0.00 (p = .11), that could be due in part to the reduced number of states with data. Only thirty-six states have sufficient numbers of eighth-grade geometry students to produce a NAEP score.
Another possibility involves the noisy NAEP course variables. Perhaps more “real” geometry students are included in the NAEP course category for geometry in 2011 than in 2005—in other words, a larger proportion who are actually in a geometry class and not mistaken about their math course. As indicated in Table 3-2 above, only 5% of eighth graders were enrolled in Geometry in 2011, an increase from 4% in 2005. The mean NAEP score for geometry students was 290 in 2005 and 308 in 2011, a sharp increase of 18 points. The one-percentage-point gain in students seems to have packed a punch in terms of NAEP scores. The “real” geometry students probably took Algebra I in seventh grade. Much like algebra for eighth graders three or four decades ago, geometry is reserved for today’s very best math students.
Discussion
This study analyzed variation in state enrollment patterns to test whether rising enrollments in advanced eighth-grade math courses are correlated with achievement gains on NAEP. No evidence was found that they are. States with rising percentages of eighth graders taking Algebra I, Geometry, and other advanced math classes were no more likely to raise their NAEP scores from 2005-2011 than states with declining percentages of eighth graders in those courses.
A second analysis, again looking at changes in policy and test scores over time, investigated whether boosting the percentage of students in higher level courses is associated with decreases in the mean scores of those courses—suggesting a watering down effect. The evidence is consistent with watering down in all but one course. Negative correlations were found for Algebra I and Pre-Algebra. In those courses, mean achievement gains declined as enrollments increased. Achievement gains in general math courses were positively associated with enrollment changes. All three of these correlations are statistically significant and supportive of the watering down hypothesis.
Geometry diverges from the other courses. A positive association was found that, although statistically indistinguishable from 0.00, suggests at least a neutral relationship between rising enrollment and changes in NAEP scores. If schools were indiscriminately accelerating students into eighth-grade geometry, one would expect a negative correlation.
None of these findings can confirm or reject causality, but they are useful in generating hypotheses for future study. They also shed light on the findings from previous research. For example, a key finding from evaluations of California’s algebra policy is that universal algebra produces trade-offs. Many students benefit from the extra challenge. Rates of algebra enrollment for historically under-enrolled populations (in particular, low SES students) have increased. The raw number of students passing end of course exams has also increased. But the downside is that the number of students failing algebra goes up as well; and the failing students, too, are disproportionately low SES students.42 One study from California suggests that many of the failing students would have been better off spending an additional year preparing for algebra instead of taking it.43 These kinds of trade-offs, when aggregated to the state level, could produce a neutral net effect.
The analysis of whether accelerating students into advanced classes is watering down achievement points to two different types of acceleration. One is selective and decided on an individual basis. Each student’s math skills are evaluated and a determination is made whether a more advanced math course is appropriate or not. That kind of acceleration appears to be occurring in eighth-grade geometry—and presumably in seventh-grade algebra. Students who would benefit from a more rigorous course are promoted. Mean test scores for eighth-grade geometry rise, or at least stay the same, despite rising enrollments.
The second type of acceleration is non-selective and group based. Students are advanced based on a characteristic independent of prior achievement or preparedness (e.g., grade level or age). Future research should compare these two types of acceleration and investigate who, when it comes to selective acceleration, should be accelerated and when. With age- or grade-based acceleration, a set of early indicators is needed (the universal algebra approach) that would identify students needing support and the type of support most beneficial for them. If the trade-offs of group acceleration are indeed real, then the policy goal should be to minimize negative effects and maximize benefits.
A final note on the Common Core. No one knows how gifted students’ needs will be met in the Common Core Era. Taking algebra in eighth grade is the new normal, and taking algebra in the seventh grade is rapidly becoming the new normal for gifted math students. In California, 8.1% of seventh graders (nearly 38,000 students) took the algebra end of course exam in 2012. If Common Core means the same curriculum for all, a time will surely come when exceptional math students need an uncommon curriculum that is appropriate for them.
| « Part II: The Resurgence of Ability and Persistence of Tracking |
Part III Notes
32. Background information on the Algebra Project is available at www.algebra.org.
33. Remarks by President Clinton, Education Roundtable, Springbrook High School, Silver Spring, MD, March 16, 1998. Available at http://www.gpo.gov/fdsys/pkg/WCPD-1998-03-23/pdf/WCPD-1998-03-23.pdf.
34. History of California’s algebra policy can be found in: Algebra Policy in California: Great Expectations and Serious Challenges (Oakland: EdSource, May 2009). Also see Tom Loveless, The Misplaced Math Student: Lost in Eighth-Grade Algebra (Washington, DC: The Brookings Institution, 2008).
35. The category “other” received about a 3% response rate before 2000 so the number of students taking more advanced classes was probably very small.
36. Jill Walston and Jill Carlivati McCarroll, Eighth-Grade Algebra: Findings from the Eighth-Grade Round of the Early Childhood Longitudinal Study, Kindergarten Class of 1998-1999 (ECLS-K) (Washington, DC: National Center for Education Statistics, October 2010).
37. See David Stevenson, Kathryn S. Schiller, and Barbara Schneider, “Sequences of Opportunities for Learning,” Sociology of Education 67, no. 3 (1994): 184-198; Adam Gamoran and Eileen C. Hannigan, “Algebra for Everyone? Benefits of College-Preparatory Mathematics for Students with Diverse Abilities in Early Secondary School,” Educational Evaluation and Policy Analysis 22, no. 3 (2000): 241-254; Julia Smith, “Does an Extra Year Make Any Difference? The Impact of Early Access to Algebra on Longterm Gains in Mathematics Achievement,” Educational Evaluation and Policy Analysis 18 (1996): 141-153.
38. See Mary Stein, Julia Kaufman, Milan Sherman, and Amy Hillen, “Algebra: A Challenge at the Crossroads of Policy and Practice,” Review of Educational Research 81, no. 4 (2011): 453-492.
39. Elaine Allensworth, Takako Nomi, Nicholas Montgomery, and Valerie E. Lee, “College Preparatory Curriculum for All: Academic Consequences of Requiring Algebra and English I for Ninth Graders in Chicago,” Educational Evaluation and Policy Analysis 31, no. 4 (2009): 367-391.
40. Charles T. Clotfelter, Helen F. Ladd, and Jacob L. Vigdor, The Aftermath of Accelerating Algebra Evidence from a District Policy Initiative (Washington, DC: National Center for Analysis of Longitudinal Data in Education Research, American Institutes for Research, 2012).
41. Jan-Eric Gustafsson, “Understanding Causal Influences on Educational Achievement through Analysis of Differences over Time within Countries,” in Lessons Learned: What International Assessments Tell Us about Math Achievement, ed. Tom Loveless (Washington: Brookings Institution Press, 2007).
42. Trish Williams, Edward Haertel, and Michael W. Kirst, Improving Middle Grades Math Performance: A Closer Look at District and School Policies and Practices, Course Placements, and Student Outcomes in California. Follow-Up Analysis (Mountain View: EdSource, 2011).
43. Jian-Hua Liang, Paul Heckman, and Jamal Abedi, “What Do the California Standards Test Results Reveal About the Movement Towards Eighth-Grade Algebra for All?” Educational Evaluation and Policy Analysis 34, no. 3 (2012): 328-343.
The Brookings Institution is committed to quality, independence, and impact.
We are supported by a diverse array of funders. In line with our values and policies, each Brookings publication represents the sole views of its author(s).