A version of this op-ed was originally published in Real Clear Markets on August 14, 2019.
You should be afraid, very afraid. Or so I’m told when I imprudently open email solicitations and read the news articles linked in those solicitations. Why should I be afraid? Because, if I’m like most Americans, I am approaching old age with too little savings to enjoy a secure and adequate retirement. The frequent warnings may contain a kernel of truth (see here, here, and here). Still, it’s hard to see much evidence for the scary headlines when we examine the relevant income statistics. They show the elderly and retired are doing pretty well. What is more, their incomes compare favorably to those of the nonelderly. Their incomes are considerably better than the incomes of their parents and grandparents when they were the same age.
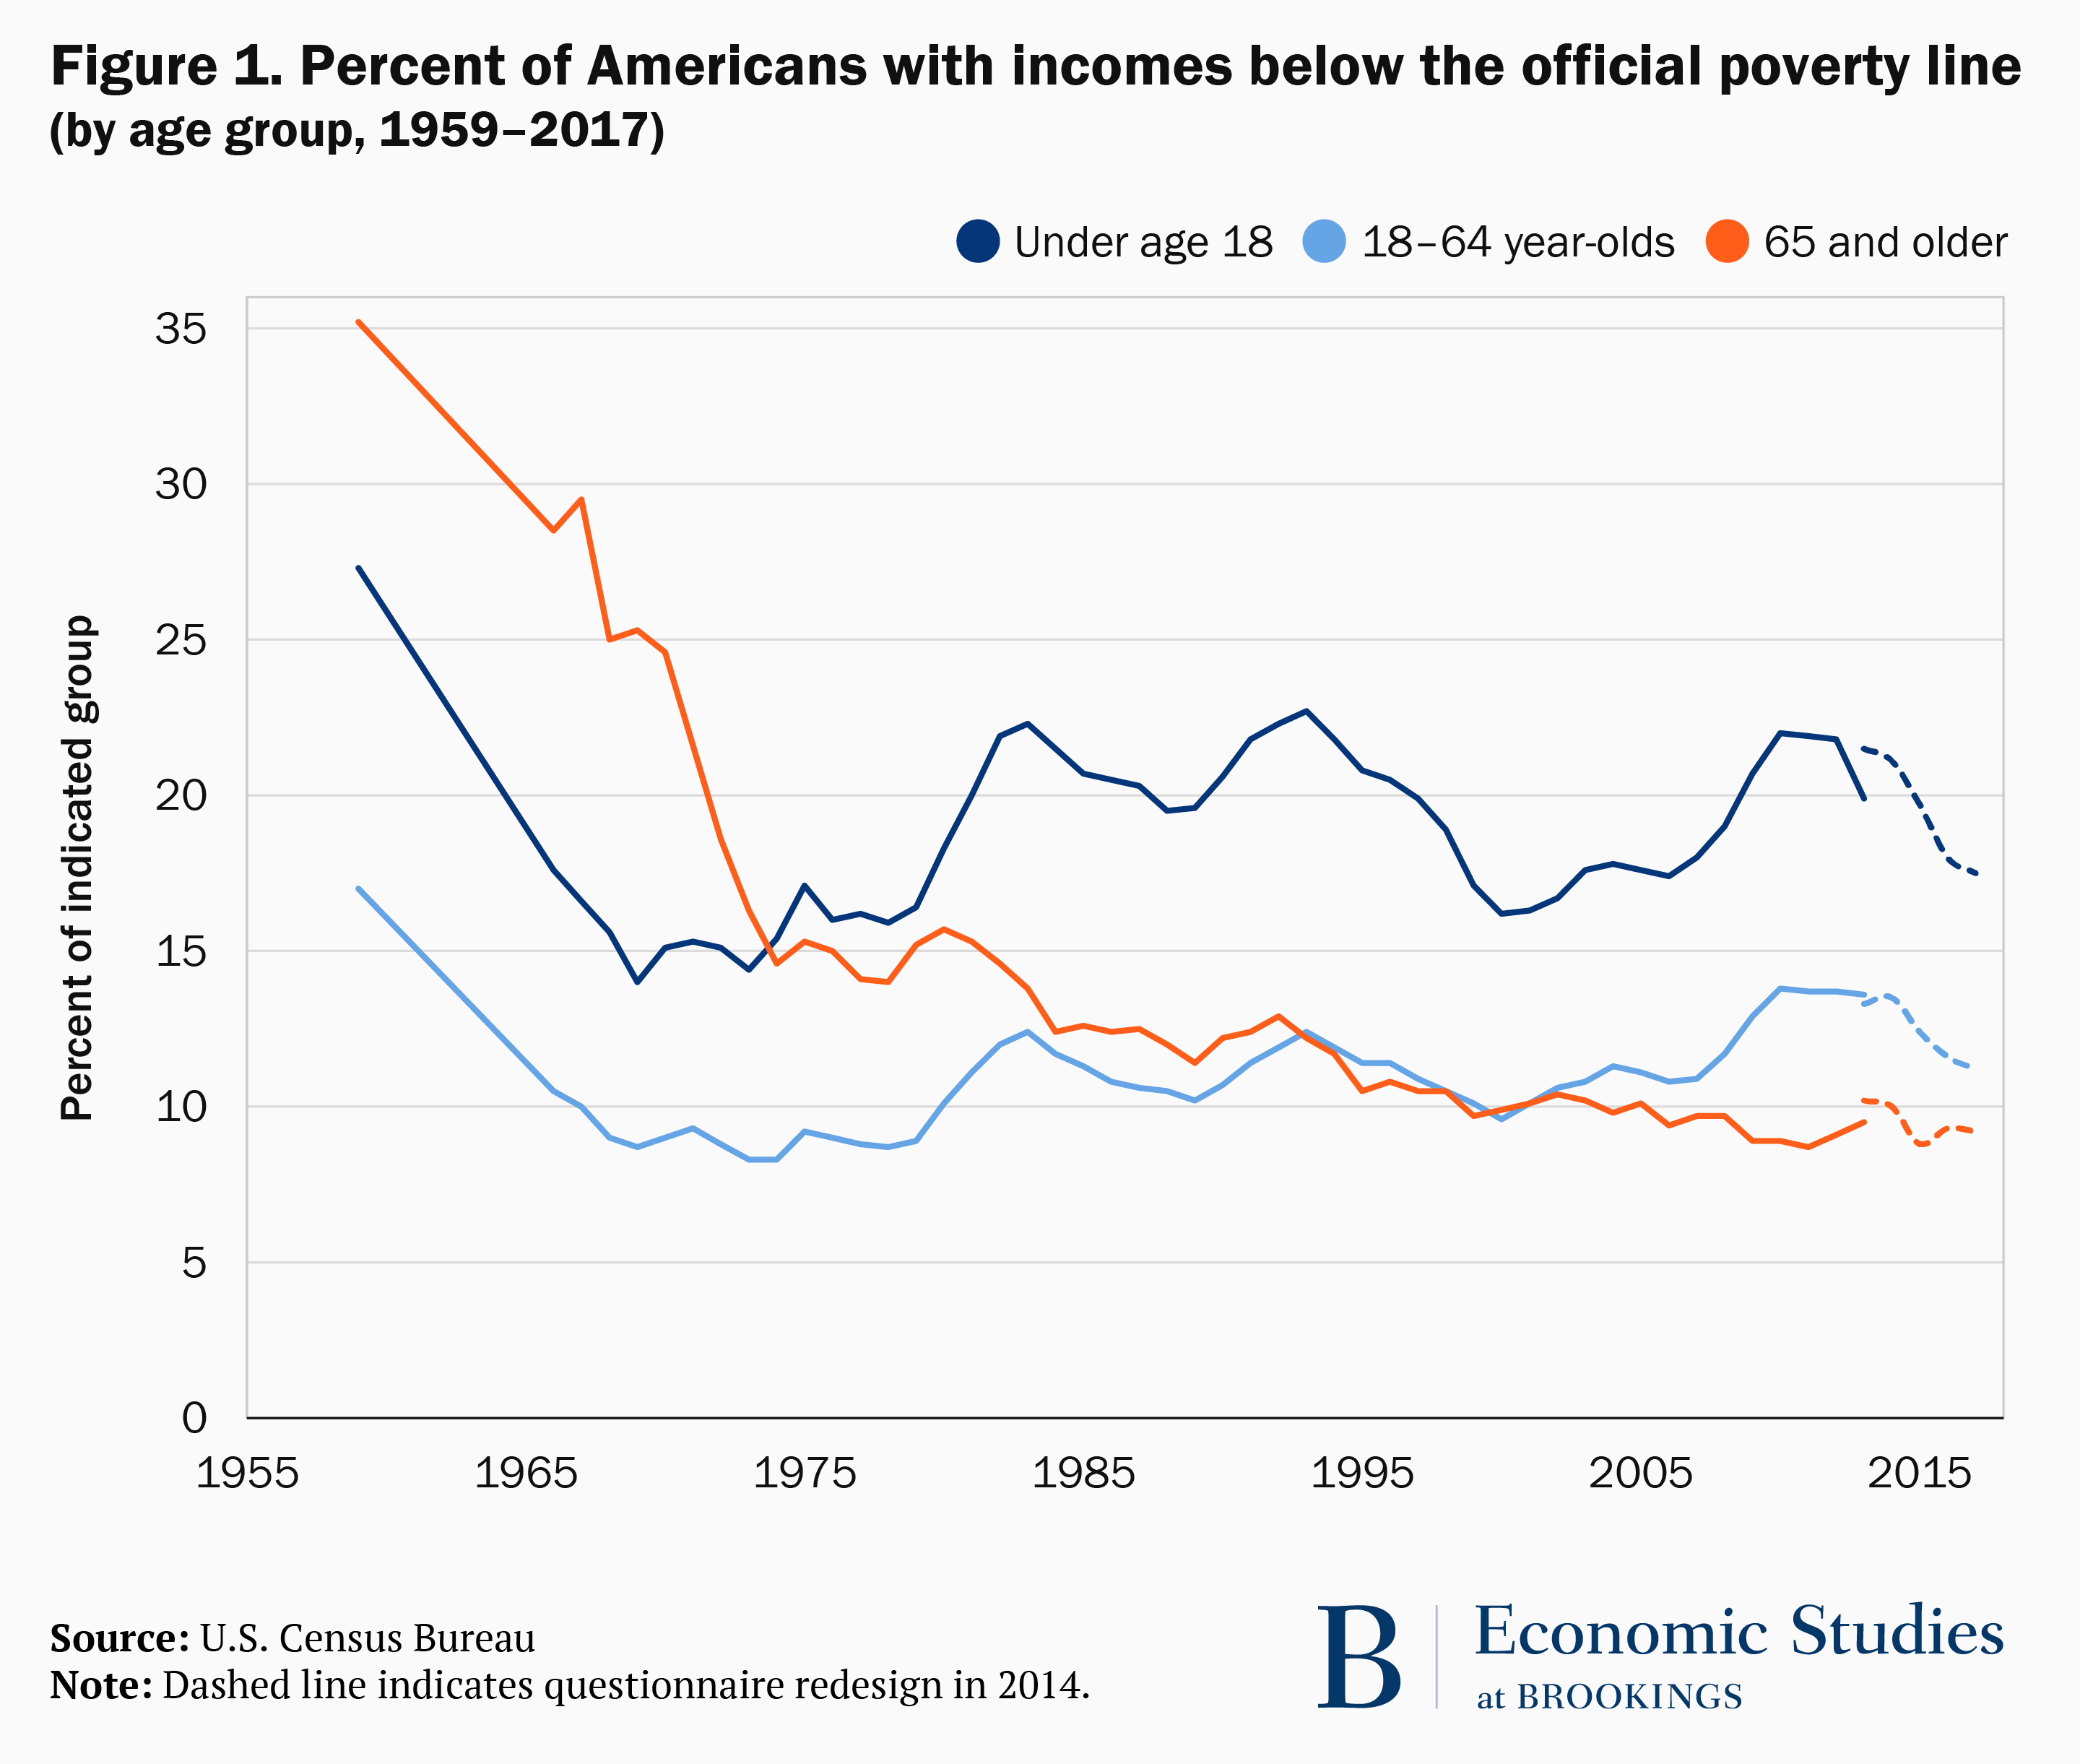
Consider the official poverty statistics, which classify Americans as poor or not poor based on inflation-adjusted cash income thresholds that were established several decades ago. In 1959, about 35 percent of the population past 65 was classified as poor. This was by far the highest poverty rate of any age group. Thanks to liberalized Social Security benefits, broader participation in workplace retirement plans, and higher savings, the old-age poverty rate fell to 15 percent in 1979 and to just 9.2 percent in 2017. Income poverty in the elderly population is now lower than it is among nonaged adults. It is substantially lower than the poverty rate among children. (See figure 1.)
Other income statistics calculated by the Census Bureau reinforce the impression that the nation’s elderly have fared pretty well compared with younger adults and children. The Bureau separately tabulates the incomes of households headed by people of different ages. Since 1979, both the median and average incomes of households headed by someone past 65 have climbed faster than the incomes of households headed by people in younger age groups. The difference is not small. Census statistics show that the average real income of elderly households climbed 82 percent between 1979 and 2017 while the average income of households headed by someone younger than 65 increased just 37 percent.
Critics of the standard income and poverty statistics note that the statistics omit items that are crucial for evaluating family well-being. A special burden for the elderly is health care spending. Older adults tend to face high costs for insurance premiums and out-of-pocket fees to health providers. This reduces the money they have left over to pay for other essentials. Of course, nonaged adults also face these health costs. If prime-age Americans hold a job, especially if they are also rearing children, they must pay for getting to work and for the care their children receive when a parent is working. Older Americans, who tend to be retired, do not face these work-related expenses.
Government statisticians recognize the different costs facing young and old families. They also recognize that cash income may be a poor gauge of the resources available to families to finance their consumption. Food stamps – now called SNAP – help pay for groceries. Housing assistance helps pay the rent or makes rent payments smaller than they otherwise would be. Income and payroll taxes reduce families’ spendable income; refundable income tax credits boost spendable income. Taking these adjustments to gross cash income into account, the Census Bureau now calculates a supplemental poverty measure to reflect a broader definition of the resources available to pay for essential consumption. The new poverty definition also uses higher poverty thresholds than the official measure. Under the supplemental definition, the estimated U.S. poverty rate is higher – 13.9 percent instead of 12.3 percent in 2017. The gap is bigger still in the case of the elderly. Nonetheless, the poverty rate of Americans past 65 is still very close to that in the nonelderly population.
Another way to assess the relative well-being of nation’s elderly is to compare the income distribution of the aged with that of the nonelderly. The Congressional Budget Office (CBO) recently published new distributional statistics permitting us to make this comparison. The CBO calculates income in three ways, under narrow and very broad definitions of what constitutes income. Under its narrowest definition, only market income is included – wages, salaries, health insurance premiums paid by an employer, self-employment earnings, interest, dividends, and other capital income. CBO’s broadest definition adds all forms of government transfers (including in-kind benefits such as SNAP and Medicare) and subtracts payments for federal income and payroll taxes and excise taxes. Under each of its definitions, the income available to each household is adjusted to reflect the number of people who are supported by the income.
CBO’s tabulations of income yield interesting findings, but the best series for evaluating the relative well being of the elderly is based on CBO’s most comprehensive income definition – after-tax, after-transfer income. Suppose we follow Brookings’ “Future of the Middle Class” initiative in defining the middle class as the middle three fifths of the overall income distribution. Under that definition, a family containing three members in 2016 would have needed at least $49,200 and could have received no more than $126,000 to be a member of the middle class. The lowest income group, consisting of the poorest 20 percent of Americans, were members of families with less than $49,200 in after-tax, post-transfer income. The highest income group, also containing one-fifth of the population, had net family incomes over $126,000 in 2016.
The latest CBO tabulations permit us to track the positions of different age groups over the period from 1979 to 2016. For example, in 1979 about 64 percent of children under 18 were members of households with after-tax, after-transfer incomes in the middle three fifths of the overall income distribution. About 25 percent of youngsters were in households with incomes below the middle-class threshold, and just 12 percent were in the top income class. By 2016 the fractions of youngsters in the lower and middle classes fell modestly, and the fraction in the top income quintile increased 2.5 percentage points. The more startling shift, however, was the sharp drop in the proportion of elderly adults who were in the lowest income class and the growth in the shares in the middle- and top income classes (see Figures 2a and 2b). In 1979, about 28 percent of the elderly were in the lowest income class. By 2016, just 13 percent were in the bottom class. The proportion of aged in middle-class households increased by 8 percentage points, and the fraction in the top quintile increased 7 percentage points, rising to 25.4 percent of the elderly population.
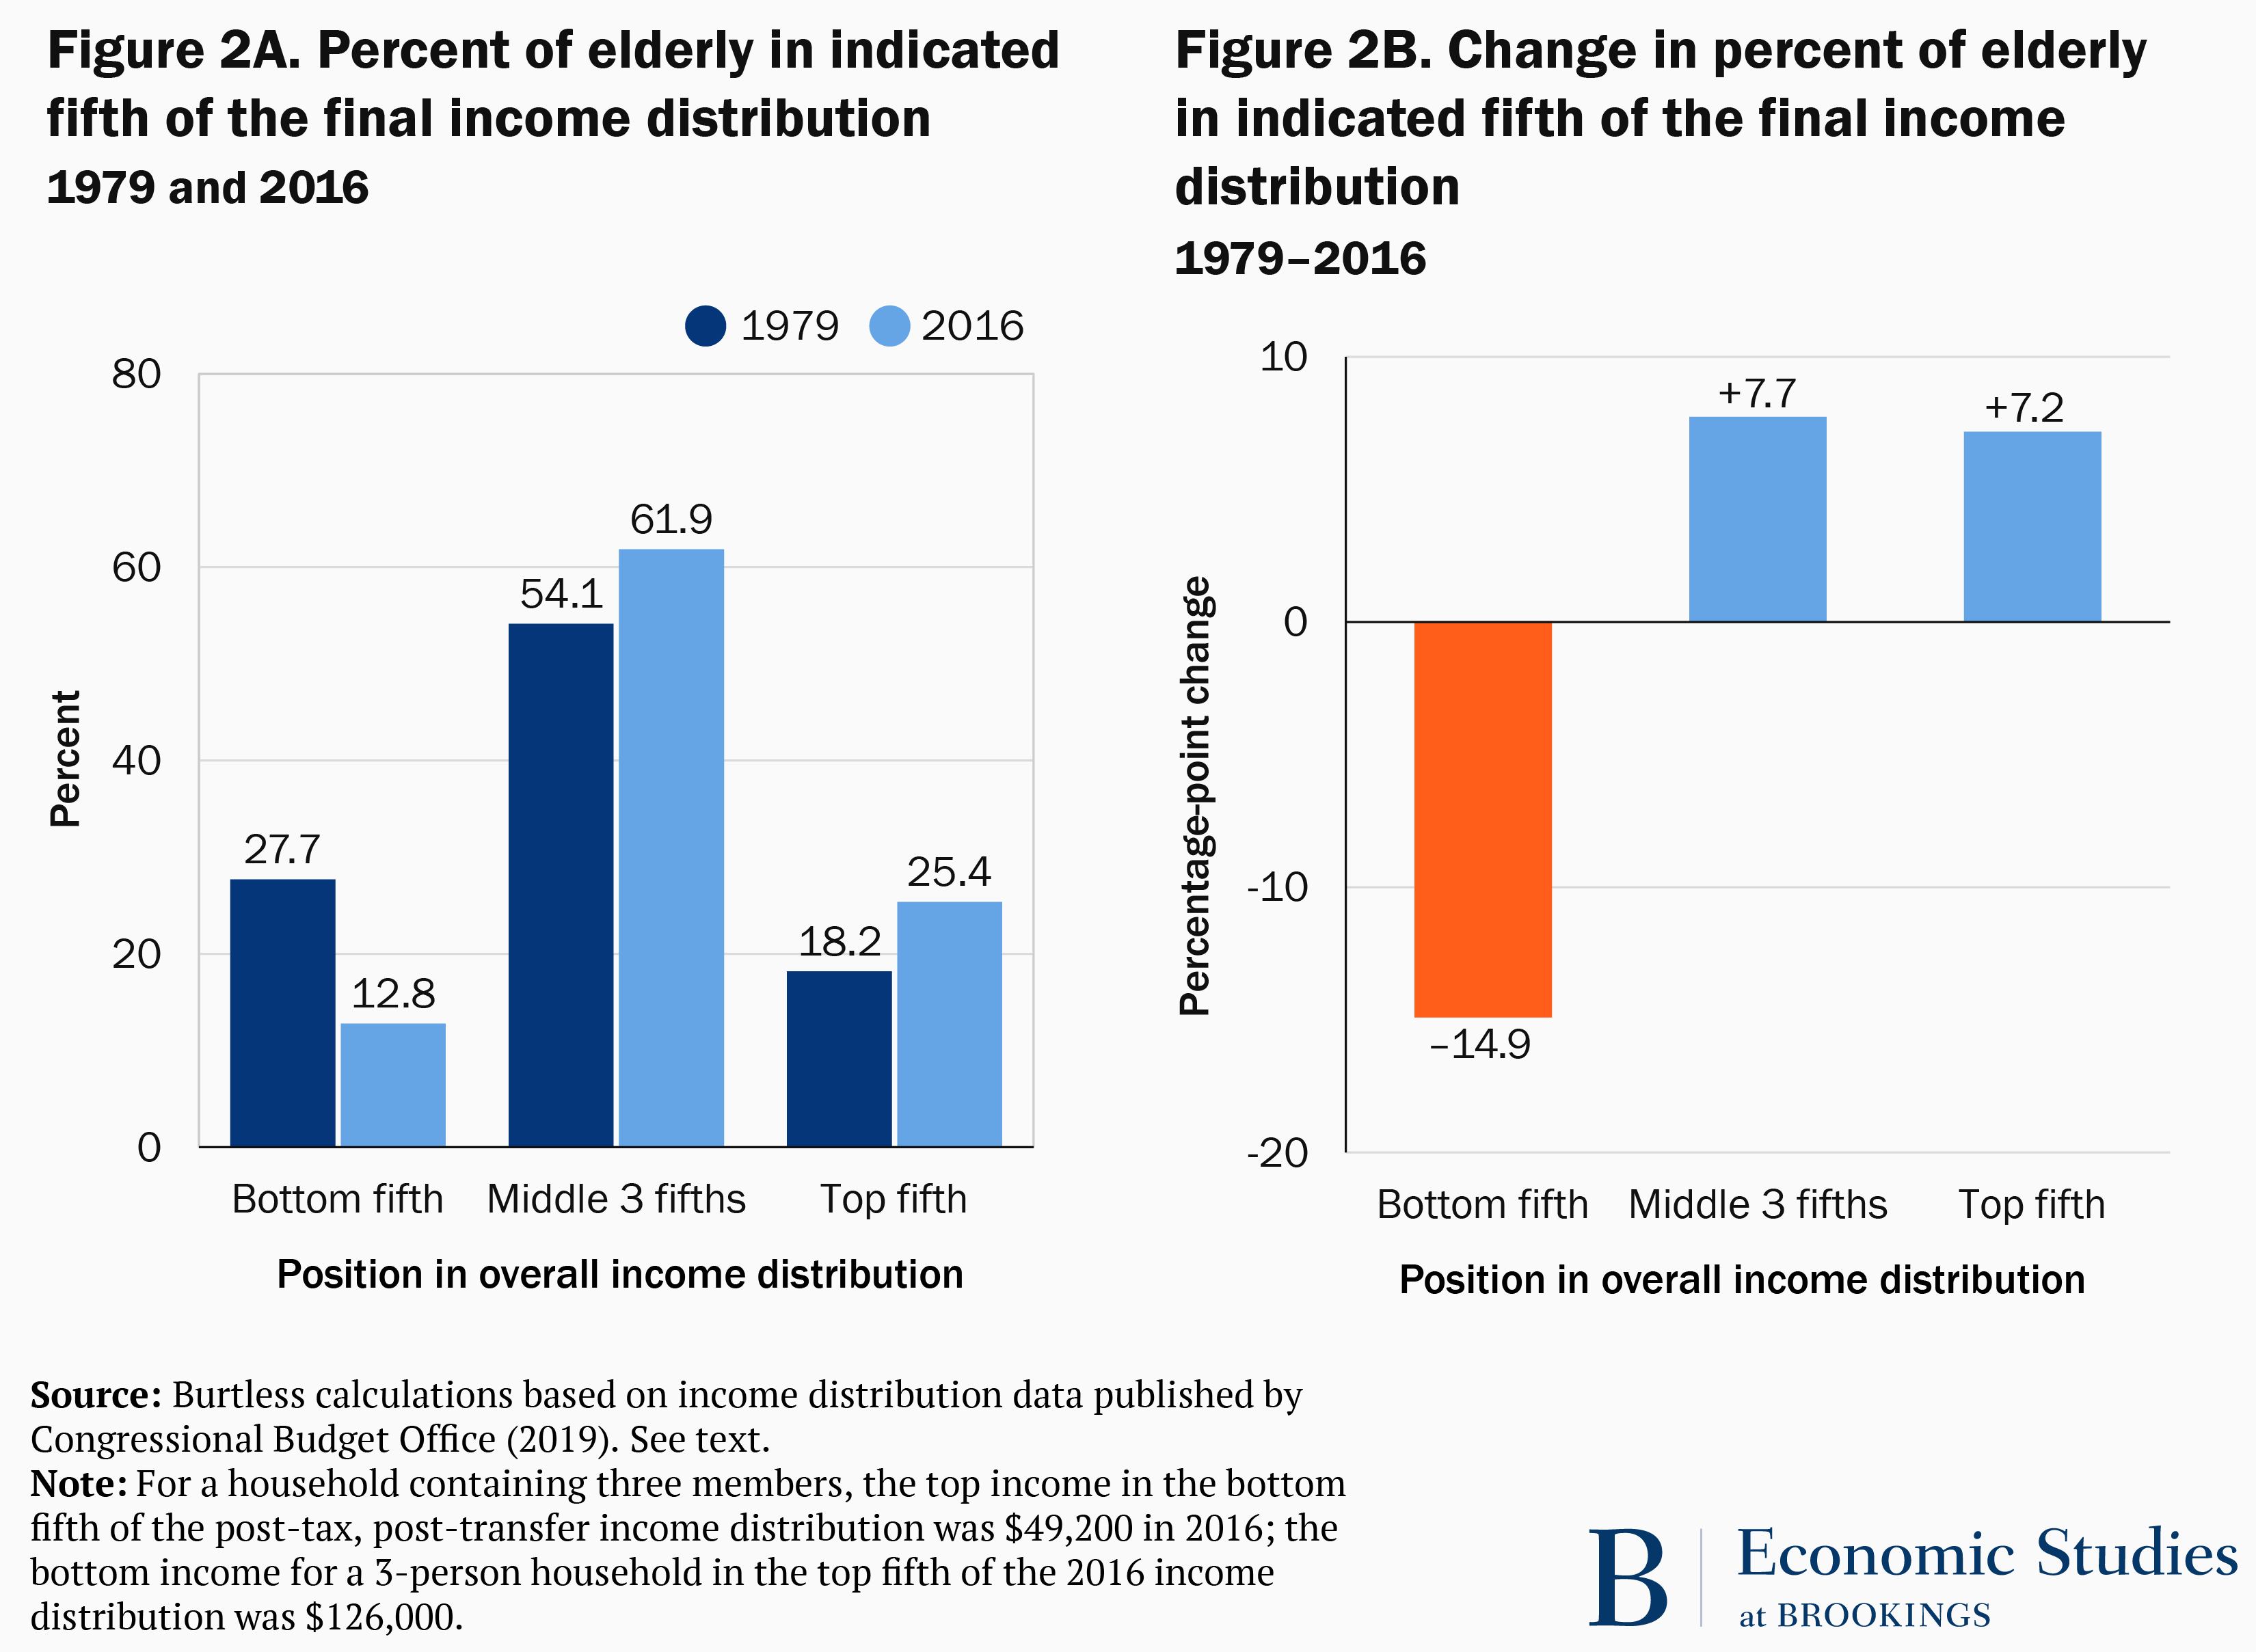
Instead of being over-represented in the lowest income class and under-represented in the middle and top classes, the nation’s elderly population is now over-represented in the middle class and especially in the top income class. Much of the improvement in the relative income position of the elderly has been at the expense of nonaged adults, who have seen a small decline in the fraction in the middle class and a bigger drop in the percentage who are in the top income quintile.
These income shifts reflect two key economic trends as well as a notable feature of the U.S. social safety net. First, the earned incomes of working-age men in the middle and at the bottom of the earnings distribution have lagged those of men and women at the top of the distribution. Second, both the earned incomes and retirement incomes of aged Americans have improved, in part reflecting later retirements and improved earnings prospects and in part reflecting the maturing of the workplace retirement system. The aged have also benefited from a safety net that protects people eligible for Social Security and Medicare much more effectively than it protects working-age adults who are too young to collect such benefits.
Cynics might argue that the improving position of the elderly in the overall income distribution reflects meager income gains for the aged in the midst of stagnant incomes for working-age families. The CBO numbers suggest, however, that both the 20th-percentile and the 80th-percentile real income increased 1.4 percent a year between 1979 and 2016. In the years since the last economic expansion ended in 2007, the 20th-percentile income increased 1.2 percent a year, while the 80th-percentile income rose 0.6 percent a year. Personal income growth for middle-class families may be slow, but it has not ceased.
Critics of the pension system and American saving behavior may be correct that a retirement crisis is just around the corner. The workplace retirement system and our personal saving habits certainly deserve some attention. However, if CBO’s income distribution estimates are approximately correct, the crisis is likely to be the result of a funding crunch in Social Security and Medicare, not a shortcoming in our personal saving habits.
Related Content


Author

The Brookings Institution is committed to quality, independence, and impact.
We are supported by a diverse array of funders. In line with our values and policies, each Brookings publication represents the sole views of its author(s).


Commentary
Op-edDespite scary headlines, America’s elderly continue to prosper
August 15, 2019