The Guardian reported this morning with the headline, “US economy adds just 160,000 jobs in April – further sign of slowdown.” I would argue, however, that the jobs report for April was actually slightly better than expected. Let me explain:
April’s jobs gains, released this morning, indicate that the U.S. added only 160,000 new jobs, “40,000 fewer than had been expected.” This number was produced using a standard filter known as seasonal adjustment. Each month, many thousands of workers across the U.S. lose their jobs, while others find themselves newly employed. The net number of jobs created or lost in all this activity is an important indicator of the nation’s economic health. But the raw number of jobs created or lost from one month to the next doesn’t say much about the underlying economy. Rather, many of these month-to-month changes are the result of predictable seasonal fluctuations. For example, the fact that the last ten Januarys witnessed the economy shedding over 2.5 million jobs simply reflects the fact that retailers slow down after the holidays and says nothing about broader economic performance. “April showers” (which bring May flowers) are expected to alter April’s employment numbers in roughly the same way each year.
The approach for seasonal adjustment that is presently used by the Bureau of Labor Statistics (BLS) puts very heavy weight on the current and last two years of data in assessing what are the typical patterns for each month. In my paper “Unseasonal Seasonals?” I argue that a longer window should be used to estimate seasonal effects. I find that using a different seasonal filter, known as the 3×9 filter, produces better results and more accurate forecasts by emphasizing more years of data. The 3×9 filter spreads weight over the most recent six years in estimating seasonal patterns, which makes them more stable over time than in the current BLS seasonal adjustment method.
I calculate the month-over-month change in total nonfarm payrolls, seasonally adjusted by the 3×9 filter, for the most recent month (column Wright SA). The corresponding data as published by the BLS are shown for comparison purposes (column BLS Official). According to the alternative seasonal adjustment, the economy gained 134,000 new jobs last month, compared to the official BLS total of 160,000. Yes, 134,000 is lower than 160,000, but this alternative seasonal adjustment still does not account for the effect of unusual weather, which was significant for April.
In addition to seasonal effects, abnormal weather can also affect month-to-month fluctuations in job growth. In my paper “Weather Adjusting Economic Data” I and my coauthor Michael Boldin implement a statistical methodology for adjusting employment data for the effects of deviations in weather from seasonal norms. This is distinct from seasonal adjustment, which only controls for the normal variation in weather across the year. We use several indicators of weather, including temperature and snowfall.
Weather was close to normal in April, but it had been milder than normal in each month of the winter. As a result, there was a sizeable “bounceback” in the data. After adjusting for the effects of unusual weather, employment growth was substantially more robust at 229,000 jobs (column Boldin-Wright SWA), significantly higher than the official number of 160,000. Although the weather in early April was roughly in line with seasonal norms, the winter months, including March, were unseasonably mild. Hence, the effect of weather inflated the level of employment upward through March, and an unwinding of the effect distorted the change in employment from March to April downwards. We calculate that the unusual weather accounted for roughly 69,000 jobs (column Weather Effect), which more than compensates for the difference of 26,000 observed between the BLS official number and the alternative seasonal adjustment figure.
I would argue that all of the slowdown that people are talking about for April is explained by weather. On a seasonal-adjustment basis, construction employment was basically flat, a tell-tale sign that weather was a drag on the data. This is a pretty substantial weather effect, and it will almost surely be the last one till next winter.
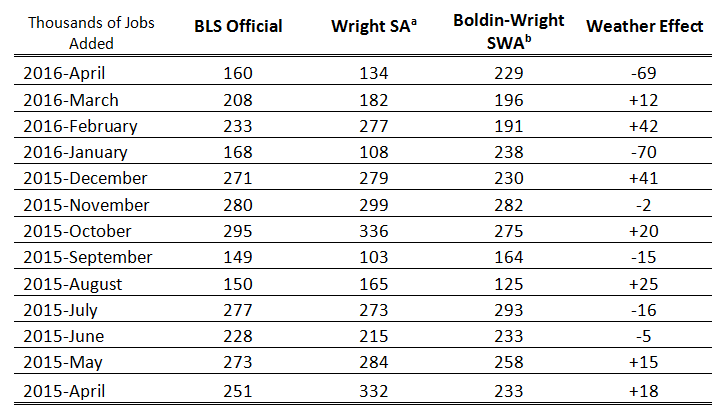
a. Applies a longer window estimate of seasonal effects (see
Wright 2013
).
b. Includes seasonal and weather adjustments, where seasonal adjustments are estimated using the BLS window specifications (see Boldin & Wright 2015). The incremental weather effect in the last column is the BLS official number less the SWA number.
The Brookings Institution is committed to quality, independence, and impact.
We are supported by a diverse array of funders. In line with our values and policies, each Brookings publication represents the sole views of its author(s).


Commentary
Unseasonable weather can fully explain the weak jobs report for April
May 6, 2016