This analysis is part of the USC-Brookings Schaeffer Initiative for Health Policy, which is a partnership between Economic Studies at Brookings and the University of Southern California Schaeffer Center for Health Policy & Economics. The Initiative aims to inform the national health care debate with rigorous, evidence-based analysis leading to practical recommendations using the collaborative strengths of USC and Brookings. We gratefully acknowledge financial support from Arnold Ventures.
At the heart of the policy debate aimed at controlling the price of prescription drugs is a concern that pricing policies, which would reduce revenues for brand name prescription drugs, would result in fewer “new cures.” The logic underlying this concern is as follows: higher prices equate to higher returns to investors that then bring more capital into drug development, which is the lifeblood of innovation. Therefore, the logic goes, reducing prices will reduce returns, which will reduce the capital invested, thus slowing innovation. More colorful versions of this argument include the head of PhRMA, the main pharmaceutical industry association, threatening that recent legislation aimed at negotiating drug prices, known as H.R. 3, would cause a ‘nuclear winter’ for innovation.
To better understand the extent to which innovation and prices are tied together, we identify five important things to know about pharmaceutical research and development (R&D) and its relationships to drug prices and revenues.
- What is the relationship between spending on pharmaceutical R&D and new drugs?
- How much does it cost to bring a new drug to market?
- How is the financial risk of investing in R&D borne?
- When markets for prescription drugs expand or contract, how does that affect the supply of new drugs?
- When markets size changes, how does it affect the supply of new cures; and how innovative are the new drugs?
We assemble extant data and evidence on each of these issues as well as make observations pertaining to these questions.
Observation 1: The relationship between R&D spending and the supply of new drugs is modest
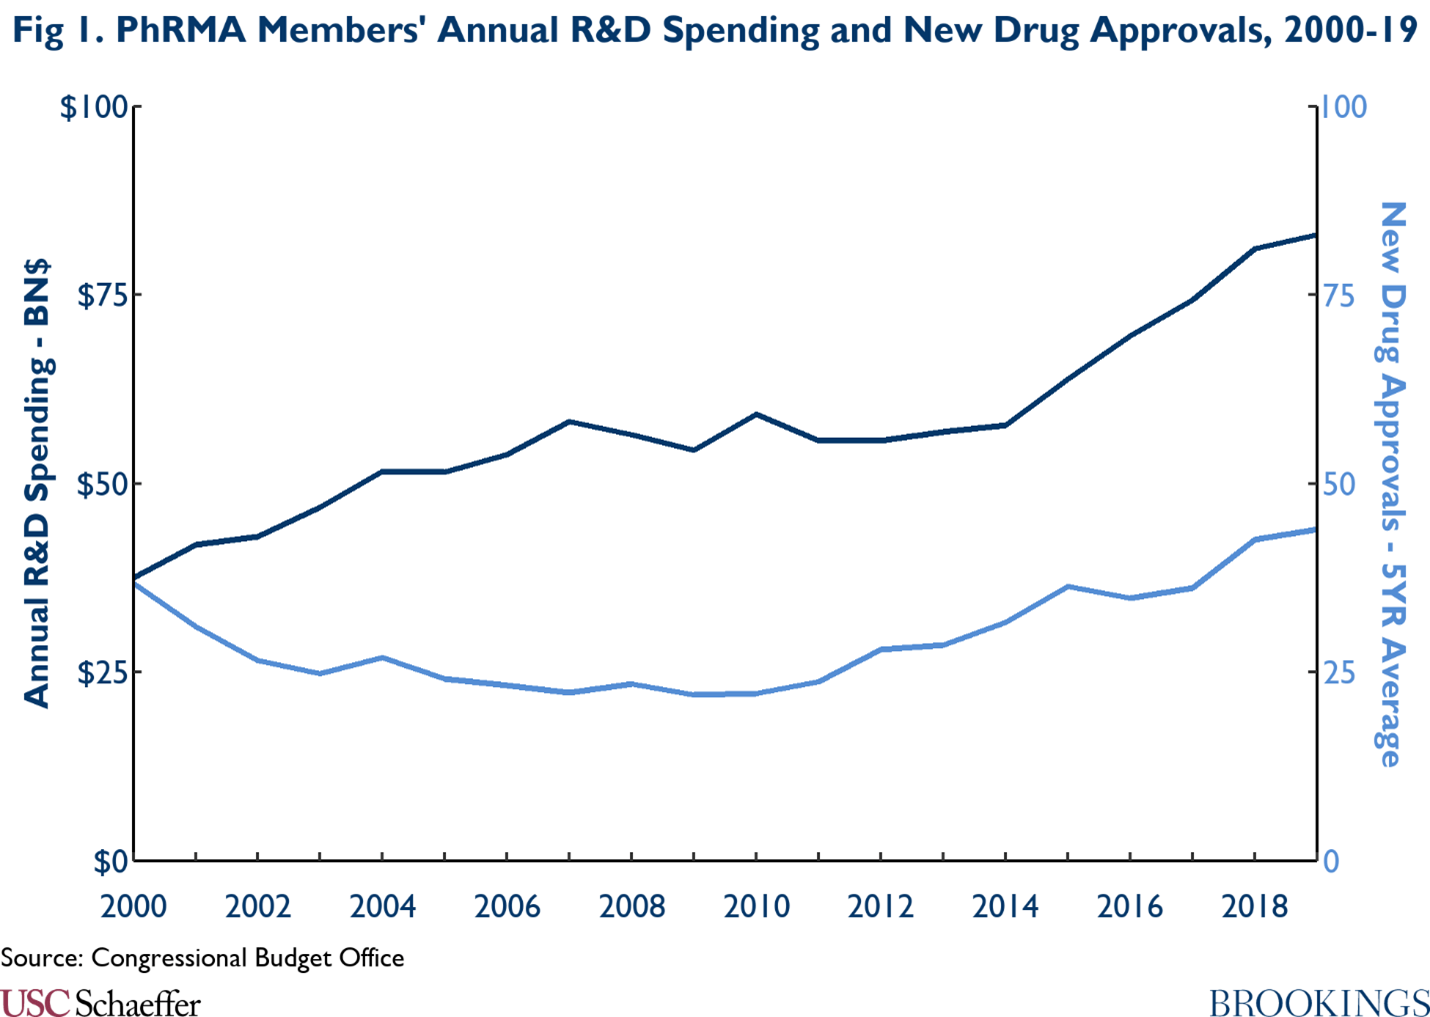
While it may seem in theory that high levels of spending on R&D would result in high production of new drugs, the empirical evidence suggests that the relationship between R&D spending and new drugs is modest. As seen in the graphic below, annual R&D budgets for PhRMA members have been on the rise, growing from $37.5 billion in 2000 to $83.0 billion in 2019. However, during the same time, the 5-year average for new drug approvals went from 36.8 in 2000, then declined for nearly a decade hitting a low in 2009 with 22 new drugs, before the 5-year average steadily increased to 44 new drugs in 2019. Furthermore, the correlation between PhRMA’s spending on R&D and the 5-year average for new drug approvals was only moderately positive at 0.58.
Beyond high levels of spending on R&D by PhRMA members, it is also notable that the sources of innovation are shifting, further complicating the relationship between R&D spending and the supply of new drugs. According to IQVIA’s report “Emerging Biopharma’s Contribution to Innovation,” emerging biopharmaceutical (EBP) companies are defined as companies that spend less than $200 million annually on R&D or have less than $500 million in global revenue. In 2018, EBP companies accounted for 80% of total pipeline projects from discovery to filing, while large pharmaceutical companies, those that have annual global sales over $10 billion, only accounted for 15% of pipeline projects. Further, EBP companies’ dominance over R&D activities has only grown over time. In 2003, EBP companies accounted for 52% of the late-stage R&D pipeline, while large pharmaceutical companies made up 36%. 15 years later in 2018, EBP companies undertook 73% of the late-stage research activity and large pharmaceutical companies’ share fell to 19%. Moreover, in 2021, EBPs originated 53% of all new drugs and accounted for 76% of launches.[1] As demonstrated, EBP companies are driving the majority of innovation with R&D budgets that are smaller than large pharmaceutical companies.
Further evidence from the House Committee on Oversight and Reform and the FDA show how the largest pharmaceutical companies’ sizable R&D budgets do not necessarily coincide with large numbers of new drugs. Through its ongoing investigation of drug pricing, the Oversight Committee recently published total R&D expenditures for 14 of the largest pharmaceutical companies by market capitalization.[2], [3] Combined, these companies’ R&D expenditures totaled $121 billion in 2019. During that year, the FDA approved 50 new molecular entity (NME) applications, of which, only 10 (20%) came from five of these large pharmaceutical companies, while the other nine companies had no NME approvals that year. From 2016-20, these 14 companies spent a total of $521 billion on R&D. During that time frame, there were 236 new molecular entities approved by the FDA. Of the large pharmaceutical companies studied, 11 of the firms accounted for 48 (20%) of those approvals while the other three companies had no new molecular entity approvals in those 5 years.
Observation 2: It costs a lot to bring a new drug to market on average, but the actual amount varies widely.
Remarkably, estimating the cost of bringing new drugs to market has been a source of passionate debate despite the rather dry technical issues involved in developing such estimates.[4] The fever of the debate stems from high R&D costs being used to justify high prescription drug prices. Studies of the cost of drug R&D have covered a range of drug types, a range of therapeutic classes, varying choice of user cost of capital used to make capitalized estimates of R&D costs, and have used diverse samples of manufacturers.[5]The research uses a variety of methods that, in turn, produce a wide range of estimates; thus, the simple comparison of estimates can result in misleading judgments.
The many ways to cut the data and to structure assumptions has unsurprisingly led to a wide range of estimates for the cost of drug development. The most recent and comprehensive review of studies estimating the costs of bringing a new drug to market was delivered by Schlander and colleagues in 2021.[6] The range of estimates of the average capitalized cost of bringing a new drug to market spans from some as low as $161 million (in 2019 dollars) to as high as $4.5 billion. The difference between the mean and median estimates was also large, reflecting the underlying variation in the costs of bringing a new drug to market. There are also disparities in cost estimates based on the observed period of drug development. The weight of the evidence suggests that average capitalized R&D (that includes all phases of R&D) ranges from $1.3 to $2.5 billion. The median capitalized R&D is 5% to 13% lower than the average.[7]
Several parameters vary considerably and underpin some of the observed variation. Among the most salient differences are the composition of the sampled drugs, development times, and the user cost of capital applied. Three parameters are especially important: the sample of drugs studies, the success rates for the R&D process, and the user cost of capital. In one of the most prominent estimation exercises, DiMasi, Grabowski, and Hansen use data for costs and drug launches from a sample of so-called “big Pharma” products.[8] They reported mean and median capitalized R&D costs per new drug to be $2.6 billion and $1.9 billion respectively in 2013 dollars, a 31% difference. If one applies weights to new drugs as they appear in the population of new drugs approved by the FDA instead of the sample used by DiMasi and colleagues, estimated R&D costs fall by over half to a mean of $1.01 billion and a median of $762 million.[9] This finding results from the fact that the share of orphan drugs in the DiMasi, Hansen, and Grabowski sample is much smaller than the share of orphan drugs among all new drugs, as well as the fact that orphan drugs cost less to bring to market.
Additionally, the success rates of human testing vary in a number of dimensions. In the studies reviewed by Schlander and colleagues, reported success rates varied by a factor of more than four (9% to 39%). The success rate varies according to factors such as the types of drug classes studied and the organization of the development process (partnerships, joint ventures, licensing agreements, solo development). The sampling and therapeutic mix of drugs used for estimation can therefore have potentially powerful effects on estimates. For example, the share of licensed-in and partnership arrangements in drug development have increased substantially over time. Recent research shows that these arrangements involve significantly higher success rates. Taking such changing development patterns into account have been projected to drop estimates of average capitalized development costs by 24%.[10]
The third salient parameter driving results in this literature pertains to assumptions about the user cost of capital. The literature, as noted earlier, uses several different user costs of capital assumptions. The user cost of capital parameters most often used are 10.5% and 11%. However, some studies have used 7%, 8%, 9%, and 11.5%. To illustrate the significance of these assumptions, most studies find that the time cost of money component of the capitalized costs accounts for between 35% and 51% of average capitalized costs of R&D. When a lower cost of capital level of 7% was used, the time cost of money accounted for about 21% of the total.[11]
In sum, the samples drawn to study R&D, the success rates applied to the samples, and the user cost of capital assumed can move estimates by 50% or more, which suggests much uncertainty about the true costs of new drugs and the likely costs of future development efforts.
Observation 3: Pharmaceutical companies allocate retained earnings and other financial resources to R&D and shareholder payouts.
During a recent Senate hearing on pharmaceutical policy, a representative of the industry claimed that “companies depend on profits to sustain biopharmaceutical investments.”[12] This declaration creates the impression that profits finance R&D. Clearly, this conclusion does not generalize, since many innovative emerging pharmaceutical manufacturers bring new drugs to market prior to collecting any revenues. Recent analyses of industry balance sheets also reveal a more complicated picture. The average percent of global revenue accounted for by shareholder payouts from 2009-2018 was 29%, or 106% of net income. Shareholder payments include stock buybacks and dividend payments. The average percent of global revenue accounted for by R&D was 17%, or 93% of net income. Thus, for the largest pharmaceutical companies in the world, R&D plus shareholder payouts sum to 199% of net income. Clearly, R&D is not being funded primarily by retained earnings. Debt during the 2009-2018 period for the top 18 firms averaged around 58% of global revenues, or over 200% of net income. Debt has more than doubled since 2009, suggesting that there is more to R&D funding than simple retained earnings. This is in large measure due to the high levels of payouts to shareholders in the form of dividends and stock buybacks.[13]
A recent report delves further into the finances of the pharmaceutical industry. Studying the world’s 27 largest pharmaceutical companies from 2000 to 2018, researchers found that the industry has undergone “mass financialization” during this time. Between 2000 and 2018, net revenues among the 27 companies grew over 240% from $300 billion to almost $725 billion. During that same time period, R&D spending as a percentage of net sales grew modestly from 12% to 17%. Investor payouts and stock buybacks, however, grew from $30 billion (10% of net sales) to $146 billion (20% of net sales) accounting for $1.54 trillion in total over the time period studied. As a percentage of R&D spending, dividends grew from 88% of total investment in R&D in 2000 to 123% in 2018. Furthermore, operational investments in fixed capital, such as machines and buildings, shrunk during this period, while financial investment in intangible assets, such as intellectual property rights and goodwill, grew substantially from 13% of total assets in 2000 to 51% of total assets in 2018. The graphic below details how R&D, dividends, fixed capital, and debt as a percentage of net sales have changed over time.

Observation 4: The number of new drugs is a poor metric for drugs that expand treatment capabilities and offer “new cures.”
The House of Representatives’ version of Build Back Better (HR 5376 or BBB) would reduce global revenues for pharmaceutical U.S. manufacturers by about 7%. The CBO score for the legislation projected that this decrease would result in two fewer drugs in the first decade, 23 fewer in the second decade (5% decline), and 34 in the third (8% decline).[14] The pharmaceutical industry claimed that this projection was too low, suggesting the impact on new drug launches would be much greater.
Most of the evidence on which all sides base their claims come from the same “natural experiment” of when Medicare expanded to include the drug benefit (or Medicare Part D) in 2006. Research consistently showed that as the market grew due to the expansion of drug coverage stemming from implementation of Medicare Part D, the number of new drugs that came on the market significantly increased.
The key policy question for assessing the trade-off between price and innovation is: what is the likely impact of reduced revenues for a set of “high priced” drugs on the supply of “new cures”? This is where the story gets complicated. Interpretations of the evidence on the trade-off between prices and reduced innovation turn on several points: (1) What are the health impacts of new drugs? (2) What do market expansions-contractions do to science? and (3) Can policy design affect the quality of new drugs launched?
The evidence shows that when Medicare expanded to cover drugs under Part D, the number of drugs coming to market increased, which was the basis for projecting declines in new drugs when revenues fall. However, research by Dranove and colleagues show that the new launches following Part D implementation were almost entirely in areas where there were already existing therapies (five or more, rather than two or fewer). [15] They also found that few were truly innovative.
Research by Amy Finkelstein provides some insight into the possible mechanisms behind the Part D expansion. [16] Her work argues that companies took existing products that were “on the shelf,” but not sufficiently profitable with the smaller market, and launched them as the market grew. Research by Byrski and colleagues extends this line of analysis. [17] They examine the same data on the impact of the creation of Part D and then looked at the impact of the market expansion on new drugs, new patents, and new published science. The authors found that they could replicate the increase in new drugs found by prior studies. They also found no overall evidence of increases in patenting or new published science.
The implication of these results is that while market expansions increase the number of product launches, the drugs that result do not broadly offer significant health impacts and they do not drive overall scientific advances. Thus, new science and new cures are not primarily driven by price.
Observation 5: Much of big PhRMA’s R&D is directed at extending the franchises of existing drugs through line extensions.
We reviewed all FDA approvals of brand name products for the period 2011-2021.[18] We identified product launches that consisted of New Molecular Entities (NMEs) and combination products involving an NME. We call these new drugs. All other brand name product launches involve only existing products. This includes adding new indications to labels, developing new formulations, changing dosage strengths, and new combinations of existing drugs. Using our definition of new drugs, NMEs, account for 36% of the brand-name launches. If we were to count new combinations, the new product share rises to 46%. In any case, much activity that falls under the heading R&D does not involve new drugs. This is exemplified by industry reports highlighting large R&D investments in new formulations for existing blockbuster drugs. For example, Bristol-Myers spent a large part of its 2018-19 R&D dollars for line extensions for existing blockbusters Opdivo and Yervoy, and Sanofi testified in the Senate that only 33 of its 81 R&D projects were for new chemical entities.
Concluding Observations
Much has been made of the threat to new drugs and “new cures” posed by legislation such as Build Back Better. However, looking carefully at the data on R&D patterns and evidence on how the industry responds to market expansion suggests a less dramatic impact of reduced revenues on R&D. Thus, modest changes in the size of payments to the pharmaceutical industry would likely have little impact on the future health of Americans. This is especially the case since the Build Back Better legislation promises three things: 1) a focus on drugs that have exceeded “normal” durations of market exclusivity; 2) safe harbors for drugs developed by smaller biotechnology companies; and 3) that the U.S. will continue to pay the highest prices for brand name drugs in the world by a significant margin.
The Brookings Institution is financed through the support of a diverse array of foundations, corporations, governments, individuals, as well as an endowment. A list of donors can be found in our annual reports published online here. The findings, interpretations, and conclusions in this report are solely those of its author(s) and are not influenced by any donation.
[1] IQVIA, Global Trends in R&D: Overview through 2021, February 2022.
[2] Committee on Oversight and Reform, Drug Price Investigation: Industry Spending on Buybacks, Dividends, and Executive Compensation, July 2021.
[3] The 14 companies include: AbbVie, Amgen, AstraZeneca, Bristol Myers Squibb, Eli Lilly, Gilead, GlaxoSmithKline, Johnson & Johnson, Merck, Novartis, Novo Nordisk, Pfizer, Roche, and Sanofi.
[4] See for example: Light DW, R Warburton, 2005, Extraordinary Claims require extraordinary evidence: comment, Journal of Health Economics 24(5):1030-1033.
[5] Drug types include orphan, small molecules, biologic. Therapeutic classes include cancer drugs, anti-infectives, influenza vaccines. Varying choice of user cost of capital used to make capitalized estimates of R&D costs include 7%, 9%, and 11%. Diverse samples of manufacturers include big Pharma, biotech, and overall industry.
[6] Schlander M, K Hernandez-Villafuerte, C-Y Cheng, et al, 2021, How much does it cost to research and develop a new drug? A systematic review and assessment; PharmacoEconomics 39:1243-1269.
[7] Authors calculations based on Schlander et al Table 1.
[8] DiMasi JA, RW Hansen, HG Grabowski, 2016, Innovation the pharmaceutical industry: new estimates of drug development costs, Journal of Health Economics 47(1): 20-33.
[9] US DHHS, 2016, Prescription Drugs: Innovation, Spending and Patient Access, Report to Congress, December.
[10] Authors’ calculation based on DHHS 2016 Tables 2 and 6.
[11] Prasad V, S Mailankody, 2017, Research and development spending to bring a single cancer drug to market and revenues after approval, JAMA Internal Medicine 177(11):1569-1575.
[12] Ezell SJ, Testimony Presented at Senate Finance Committee Hearing on Drug Price Inflation: An Urgent Need to Lower Drug Prices in Medicare, March 16, 2022.
[13] Sources for this paragraph are as follows: Financialization of the U.S. Pharmaceutical industry William Lazonick, Öner Tulum, Matt Hopkins, Mustafa Erdem Sakinç, and Ken Jacobson, The Academic-Industry Research Network December 2, 2019; and Private gains we can ill afford The financialization of Big Pharma April 2020 s Sarphatistraat 30 1018 GL Amsterdam The Netherlands T: +31 (0)20 639 12 91 F: +31 (0)20 639 13 21 [email protected] www.somo.nl The Centre for Research on Multinational Corporations (SOMO) plus recent reviews of Form 10Ks.
[14] The CBO estimates rise over time because revenue impacts matter more in out years when fewer initial investments have been locked into place.
[15] Dranove, D., Garthwaite, C. and Hermosilla, M., 2014. Pharmaceutical profits and the social value of innovation (No. w20212). National Bureau of Economic Research.
[16] Finkelstein, A. (2004). Static and Dynamic Effects of Health Policy: Evidence from the Vaccine Industry. The Quarterly Journal of Economics 119(2), 527—564.
[17] Byrski, D, F Gaessler, MJ Higgins, Market Size and Research: Evidence from the Pharmaceutical Industry; Max Planck Institute Research Paper 21-16, May, 2021.
[18] Drugs@FDA data from 1/2011-1/2021
Authors


The Brookings Institution is committed to quality, independence, and impact.
We are supported by a diverse array of funders. In line with our values and policies, each Brookings publication represents the sole views of its author(s).


Commentary
5 things to understand about pharmaceutical R&D
June 2, 2022