With the collapse in travel triggered by COVID-19, tourism dependence was a key factor in explaining why some countries took a bigger hit in economic growth than others during 2020. Europe was no exception: the drop in tourism was one big reason that the pandemic hit the economies of Greece, Italy, Portugal, and Spain particularly hard.
In January 2020, the IMF projected that the euro area would grow by 1.3 percent that year. With the onset of the COVID-19 pandemic, outcomes were far grimmer—the euro area economy contracted by 6.4 percent. While every country in the euro area was hit hard, there were notable differences in the depth of the recession: for instance, the Lithuanian economy contracted by less than 1 percent and Germany by 4.6 percent, but Italy by 8.9 percent and Spain by 10.8 percent.
Clearly the severity of the pandemic in different countries played a role—COVID-related deaths in Italy and Spain were much higher than in Germany or Lithuania in relation to population size, and the associated lockdowns over the course of the year were more stringent. But other factors also played a crucial role. This was a recession like no other, which hit contact-intensive sectors particularly hard. As shown in a recent blog, international tourism came to a standstill, with devastating consequences for the affected sectors and countries relying more heavily on those sectors.
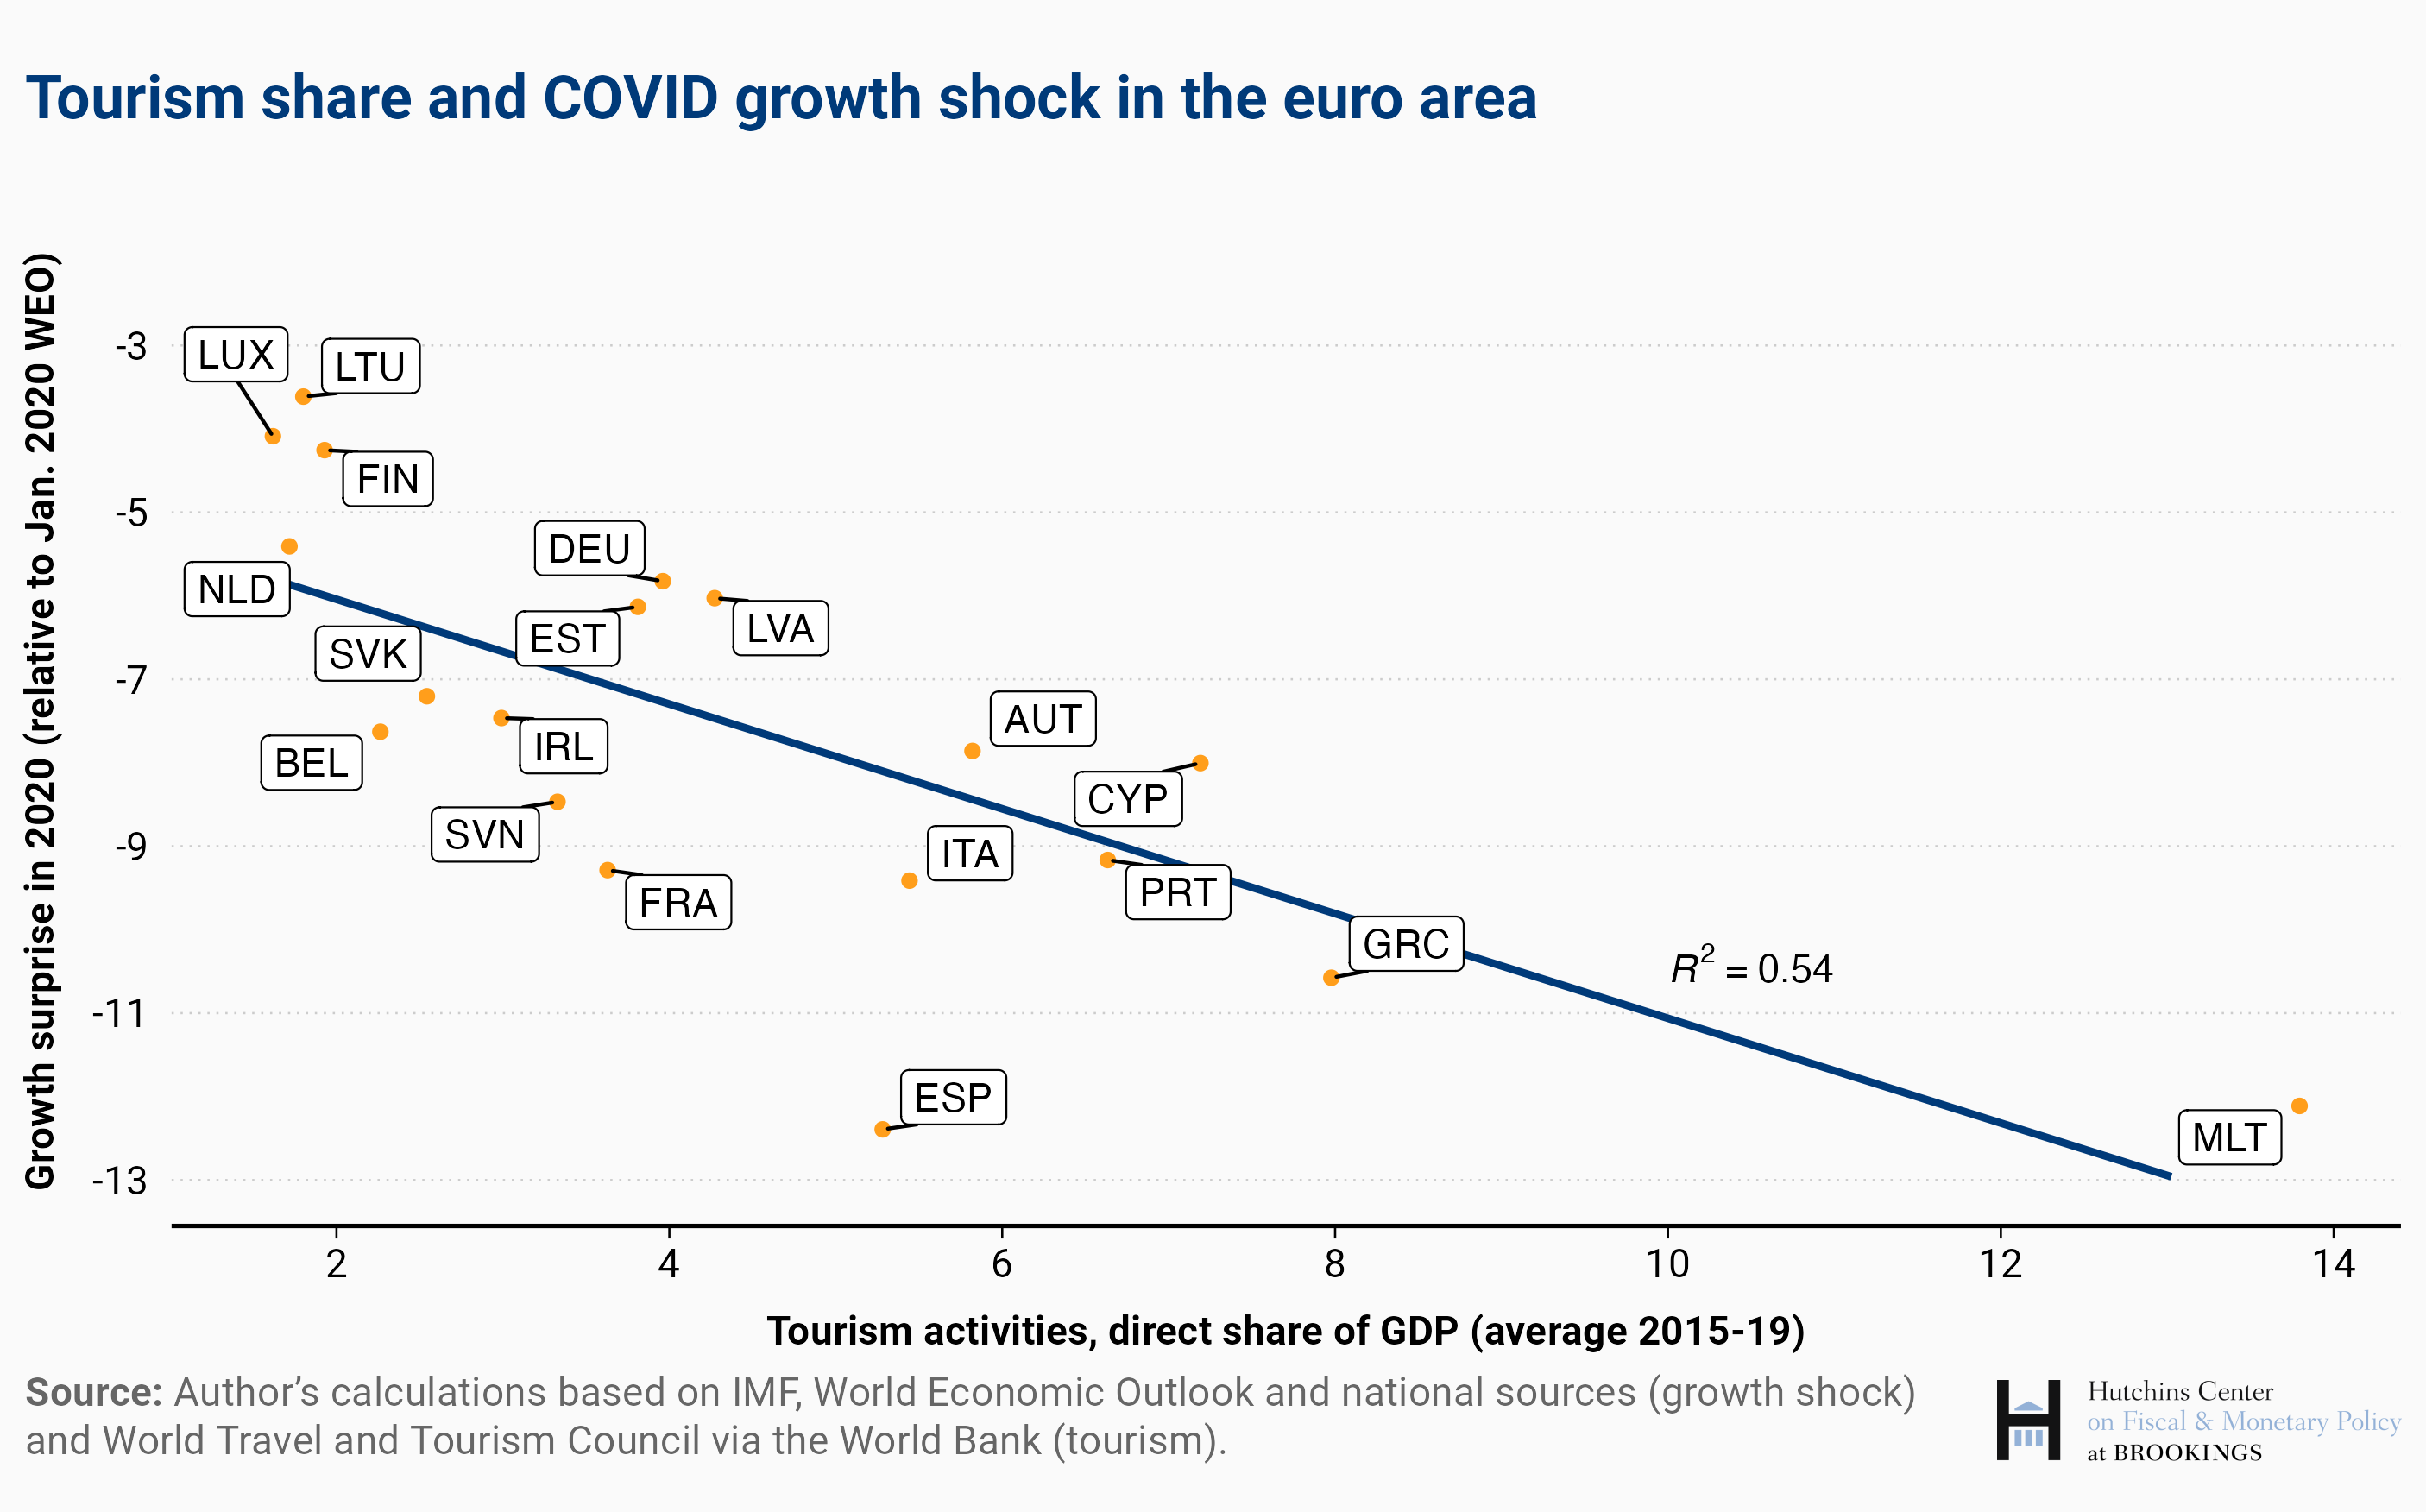
The chart above illustrates the importance of the size of the tourism sector relative to overall GDP in understanding the economic consequences of the pandemic in the euro area. It depicts the average share of tourism in GDP over 2015-19—prior to the onset of the pandemic—on the horizontal axis, and the depth of the COVID-induced contraction in 2020 (relative to pre-COVID forecasts) on the vertical axis, and the associated statistical relation between the two.[1] [2]
In sum, tourism dependence alone can explain over half of the cross-country variation in growth performance among euro area countries last year. For instance, the statistical relationship between the share of tourism and the intensity of the subsequent recession suggests that a country with the tourism share of Italy or Spain (over 5 percent of GDP) would contract by better than 2 percentage points more than a country like Lithuania or the Netherlands (where the tourism share is below 2 percent).
The logical next step is to add to this model variables measuring the intensity of the pandemic and associated production restrictions, such as COVID-related deaths in proportion to the population and the stringency of lockdowns throughout 2020 (measured by Oxford University). When we do so, we explain 80 percent of the cross-country variation in growth among euro area countries.
Economies across the euro area are staging a recovery this year, but the stress on the most affected sectors persists. Until tourism and recreational activities recover more fully, we will likely see differences in the speed of recovery towards pre-pandemic trends.
[1] The tourism share depicted here is an estimate of the value added directly accounted for by tourism activities. Results using a more comprehensive tourism measure which also includes related investment spending and domestic inputs purchased by the tourism sector are virtually identical.
[2] For Ireland we use a corrected measure of economic activity (the so-called “adjusted gross national income”—GNI*) instead of GDP. GNI* better captures domestic economic activity by excluding the repercussions on economic accounts of financial operations by multinational corporations, particularly those involving intellectual property transfers.
The Brookings Institution is financed through the support of a diverse array of foundations, corporations, governments, individuals, as well as an endowment. A list of donors can be found in our annual reports published online here. The findings, interpretations, and conclusions in this report are solely those of its author(s) and are not influenced by any donation.
Author

-
Acknowledgements and disclosures
The author is grateful to Philip Lane for asking the euro area-specific question addressed in this blog, to David Wessel for useful comments, and to Manuel Alcala Kovalski for research assistance and help with the chart.
The Brookings Institution is committed to quality, independence, and impact.
We are supported by a diverse array of funders. In line with our values and policies, each Brookings publication represents the sole views of its author(s).


Commentary
Economic repercussions of the COVID-induced tourism collapse in the euro area
August 24, 2021