It is rare to talk to federal administrators and not hear something about “data-driven decision making.” Administrators dedicate significant time and information technology resources to decisions about their agency’s viability and to defending their standing in appropriations discussions. However, the questions asked of the data by senior officials for these purposes are dramatically different than the questions asked by a front line case manager for a social service organization. Unfortunately, it is the former that has the loudest voice in procurement and system design conversations. The prevailing top-down approach to data collection and use also puts little actionable information in the hands of the people responsible for gathering data. As a result, the incentive to collect data is diminished while opportunities for informed program improvements and abilities to measure outcomes against costs are missed. A small shift in our approach to data collection and visualization could lead to big improvements in the effectiveness of social service delivery.
While the effort to collect and analyze data gives the impression of transparency, we are actually looking at our institutions through a fun house mirror. Frameworks are geared toward only answering a small set of high-level questions, creating a false sense of openness that limits the policy discourse around those agencies to their funding—not their effectiveness.
It is time for this “good on the surface” notion to die, and in its place we must re-orient our data collection strategies to inform our work as it happens.
Make no mistake—for the vast majority of agencies this is a wholesale paradigm shift with significant implications for design, implementation, and evaluation of social service delivery.
Collecting the wrong data
Take the case of homelessness organizations. Social workers across the country bring homeless families into a network of wrap-around services available through several state and local agencies. With every meeting, they collect qualitative and quantitative data about clients and update the case management system that loosely connects to that network of providers. If effectively analyzed and visualized, this information would likely help spot warning signs of future trouble for the family and would give social workers a chance to make a meaningful early intervention. Visualizing the data could also inform the network of providers of interventions that are working so they can put resources to the most effective programs.
However, the data entered in the system is often not used to produce the types of insights needed to help best manage cases. Instead, the data is sent to analysts at The Department of Housing and Urban Development (HUD) who, once a year, release large, static reports including the Annual Homeless Assessment Report (AHAR), Annual Progress Report (APR), and HEARTH Performance Measures. HUD has strict guidelines and complex coding systems for how data can be entered, stored, and used by community service providers. The mandated once-yearly reports are the primary form of feedback case managers receive from the information they’ve entered and contain very little useful information for day-to-day client service.
Where this backward looking systemic analysis is valued is among the policymakers making budgetary decisions. Forensic analysis of program effectiveness is usually measured along broad performance indicators like individuals served, cost-per-beneficiary, number of people who have exited from system dependence. But these reactive measures do very little to help social workers ensure that client families make progress and don’t slide back into poverty. Without that direct connection to their work, it is inevitable that data collection and analysis becomes an infrequent and low-value administrative task on top of an already large workload.
Shifting mentalities
As Andrew Means describes it, we need to “upgrade from an output mentality to an input plus output mentality” when it comes to using data in this context. Means, the founder of Data Analysts for Social Good and The Impact Lab, works with organizations to update data collection techniques and use data science to solve longstanding social problems. He argues that too many public institutions view data exclusively an output of a program to show whether or not the original design was effective.
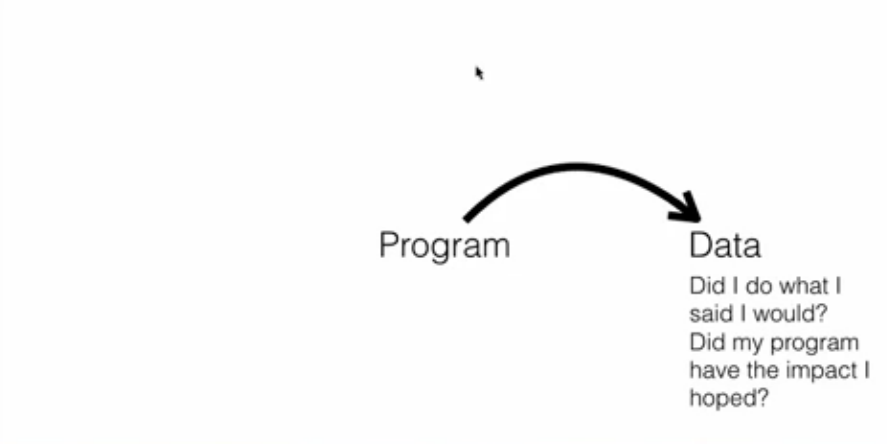
Output mentality
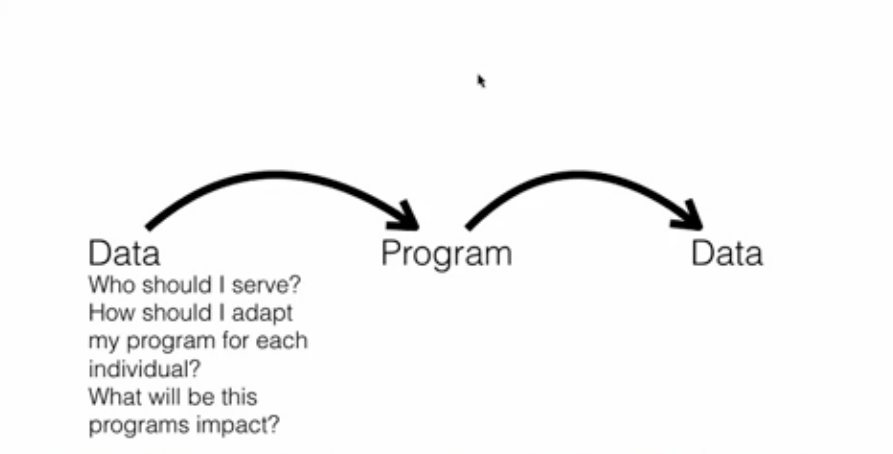
Input mentality
Instead, Means advocates for primarily viewing data as an input—information that establishes a baseline of understanding and makes predictive modeling possible alongside forensic analysis. He has seen how individuals who see a far greater value in the data are more likely collect data faithfully and accurately. Better data leads to better analysis helping inform programs, making more targeted, efficient, and effective program work is possible.
Drawing on our previous example, using data as an input allows agencies to estimate which beneficiaries are most likely to drop out of a homeless support program or which program they would be best served by. This is clearly in an agency’s best interest. Not only is the agency able to focus human and financial resources where they are most effective, but overall improvements in outcomes will reflect positively in conventional budgetary discussions.
Higher value data = better transparency
This brings us back to the question of transparency and value. Data that is not valued is not rigorously collected or validated. Moreover, because the analysis is only interesting to a small group of administrators, reporting is an afterthought. That is why agencies often dump a 25 column, comma-delimited file with 10,000 rows of data on their website and assume they are meeting their disclosure obligations. This information is virtually inaccessible to the average person in that form. It exists to validate past decisions instead of informing future ones, and the by-product of that approach is a policy discourse that cannot leverage data to advance our service delivery beyond the status quo.
For social workers, agency directors, and funders, the challenge is not to simply make the data available but to make it useful for everyone in the decision chain. By using contextual resources like data visualization, individuals are empowered to act and ask more, better questions of the data. For a social worker, this could be an opportunity to use data in their work with individuals or to coordinate with partners who provide additional services to clients. Further upstream, institutions have an opportunity to articulate their value, showcase their progress, and advocate for a broader understanding of issues critical to their work.
Not only will this increase public understanding of key issues, but also increase the accountability of agencies and decision makers to their constituencies to the benefit of our broader society.
By taking a grassroots approach to data system design, we can put analytical power back into the hands of the people who can most effectively use it for change. For example, the Community Technology Alliance partnered with our organization to put the HUD data discussed above into a series of interactive reports that will help homelessness agencies nationwide and give them an opportunity to combine that data with their proprietary data to draw out more valuable insights. Modeled as a nationwide Data Fellowship, the program trains a group of 20 homeless services data enthusiasts across the country on analytical tools and visualization best practices. In addition to building a first set of field-usable visualizations, the fellows will also train their peers on the value of collecting and using data in their work.
This is not just an effort to tackle homelessness and create change within one social service organization’s reporting system. It is an effort to create a new standard for information utility and transparency that all organizations can follow based on a few simple principles:
- Data must be useful to those responsible for collecting it and acting on it.
- More useful data for local decision-makers means better data for federal and state funding agencies as well as taxpaying citizens
- Data and the story it tells must be accessible and easily understood at all levels
This is our challenge to government information technology leaders—let the old output-only notion of data driven decision making die. Build systems from where the information is most valuable, easily understood, and actionable and let them yield better data. Encourage transparent institutions using better data, and enrich the public discussion about an agency’s value to society.
Read more essays in the Ideas to Retire series here.
The Brookings Institution is committed to quality, independence, and impact.
We are supported by a diverse array of funders. In line with our values and policies, each Brookings publication represents the sole views of its author(s).


Commentary
Idea to retire: Viewing data as an output
March 10, 2016