The labor market continued to improve last month, according to the Bureau of Labor Statistics. In February, the economy added 236,000 jobs and the unemployment rate edged down to 7.7 percent. Over the last twelve months, the private sector has added 2.1 million jobs; in contrast, employment in state, local, and federal governments has declined by more than 100,000 jobs.
Despite this progress, millions of Americans are still experiencing the effects of the Great Recession; indeed, many workers have suffered protracted periods of joblessness or lower wages. A range of government safety-net programs have assisted those Americans who have found themselves struggling in a weak economy. But recent budget cuts, notably the sequestration that went into effect on March 1, threaten to weaken this social safety net even while employment remains far from pre-recession levels.
In this month’s employment analysis, The Hamilton Project looks at current poverty trends in the United States, the important role of government support programs, and how sequestration could damage critical aspects of the safety net in the midst of continued labor-market weakness. We also continue to explore the “jobs gap,” or the number of jobs that the U.S. economy needs to create in order to return to pre-recession employment levels.
A Look at America’s Poverty Rate
According to the official poverty rate as measured by the U.S. Census Bureau, 12.5 percent of Americans lived in poverty in 2007, prior to the start of the Great Recession, a figure only slightly below the poverty rate in 1980. In the wake of the recession, the official poverty rate has increased significantly, reaching 15.1 percent in 2010—its highest level in recent decades—and remained at that elevated level in 2011. At first glance, then, it might appear that the nation has made little progress—or even gone backwards—in fighting the war on poverty, but this official rate doesn’t tell the whole story.
Some experts argue that the official rate is an inaccurate measure of the well-being of low-income Americans because it omits the effects of taxes and many anti-poverty programs that provide valuable support for low-income American families. In a 2008 discussion paper for The Hamilton Project, Rebecca Blank and Mark Greenberg explain why the official poverty rate is flawed and how it could be improved.
Blank and Greenberg advocate using an alternative measure of poverty, developed by the National Academy of Sciences (NAS) in the 1990s. This NAS rate accounts for changes in the costs of goods other than food—notably, health care—and makes different adjustments for family size and inflation. But most importantly, the official poverty rate only considers a family’s pre-tax money income, while the NAS measure also accounts for tax credits and noncash benefits like the earned income tax credit (EITC), child tax credit, housing stipends, energy assistance, and food and nutrition programs like the Supplemental Nutrition Assistance Program (SNAP, formerly food stamps).
The graph below, based on measures from a recent paper by Bruce Meyer and James Sullivan, illustrates the difference between these two poverty metrics.
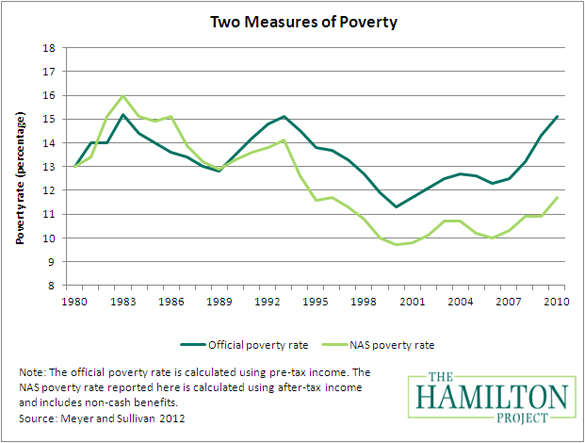
A frequent criticism of anti-poverty programs is that they incentivize people to work less, which in turn raises the official poverty rate. While certain programs, such as unemployment insurance, may have this effect for some individuals (although evidence suggests that this effect is not very large), Bruce Meyer and Dan Rosenbaum and Nada Eissa and Jeffrey Liebman have shown that other key anti-poverty programs like the EITC actually provide very strong work incentives. While the overall effect of anti-poverty programs on the official poverty rate is, therefore, ambiguous, it is clear that government programs have greatly reduced the more-accurate NAS poverty rate.
The Role of Policy in Alleviating Poverty
The striking fact about the above graph is that, since the 1990s, the NAS poverty rate has fallen significantly and was 3.4 percentage points below the official measure in 2010. In human terms, this means there are more than 10 million fewer people living below the poverty line, according to the NAS rate. Intuitively, this makes sense: the development and expansion of effective anti-poverty programs like the EITC, expansions in health insurance for low-income children and families, and more recent temporary expansions in the safety net during the Great Recession have reduced the number of Americans living in poverty over time. What’s more, the temporary recovery measures that policymakers enacted during the recession cushioned families against the most devastating effects of the weak economy.
Many of the current anti-poverty programs, therefore, are having a very real and positive impact that is not reflected in official poverty statistics. While too many Americans are still living in poverty, even more families would struggle to get by in the absence of support programs that have been enacted and expanded during the past three decades.
Despite the success of these policies in assisting at-risk families, some of these programs will be scaled back significantly as a result of the March 1 sequestration. The Center on Budget and Policy Priorities, for instance, estimates that the extended unemployment benefits that were enacted during the recession kept 3.4 million Americans above the poverty line in 2010 alone. Yet under sequestration, extended unemployment benefits will be cut by almost 10 percent. Other longer-term safety-net programs that have been important in reducing the NAS poverty rate in recent years—including housing vouchers for very low-income Americans and the Special Supplemental Nutrition Program for Women, Infants, and Children (WIC)—will also be reduced. Sequestration, therefore, could have disproportionately negative impacts on those Americans who most need assistance in recovering from the recession.
Recently, The Hamilton Project released 15 Ways to Rethink the Federal Budget, a report including a range of proposals—written by experts from many policy and political backgrounds—for reducing the deficit through pro-growth policies that do not hinder the United States’ recovery efforts. While there has been progress on improving the deficit and labor-market situations over the last few years, it is clear that more work remains to be done to help many American families in their transition back to full employment.
The February Jobs Gap
As of February, our nation faces a “jobs gap” of 10.2 million jobs. The chart below shows how the jobs gap has evolved since the start of the Great Recession in December 2007, and how long it will take to close under different assumptions of job growth. The solid line shows the net number of jobs lost since the Great Recession began. The broken lines track how long it will take to close the jobs gap under alternative assumptions about the rate of job creation going forward.
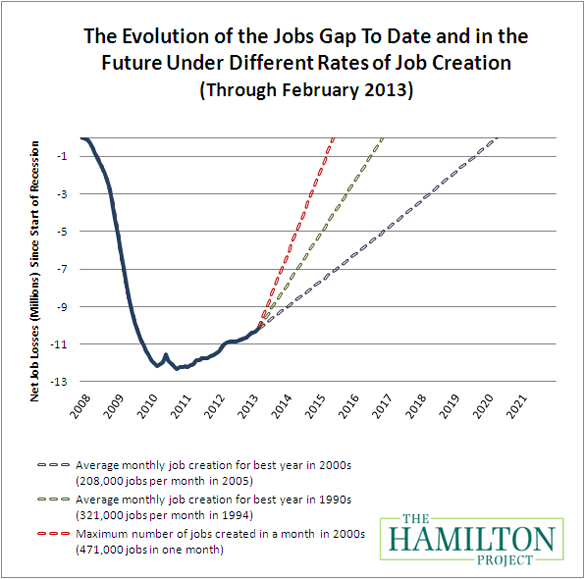
If the economy adds about 208,000 jobs per month, which was the average monthly rate for the best year of job creation in the 2000s, then it will take until April 2020 to close the jobs gap. Given a more optimistic rate of 321,000 jobs per month, which was the average monthly rate of the best year of job creation in the 1990s, the economy will reach pre-recession employment levels by November 2016. You can also try out our interactive jobs gap calculator by clicking here and view the jobs gap chart for each state here.
Conclusion
Although poverty—by any measure—has increased since the beginning of the recession in 2007, the evidence suggests that many anti-poverty programs enacted during the past several decades and the federal government’s response to the recession have played an important role in keeping many American families above the poverty line. Indeed, while much work remains to be done in supporting low-income families, the nation’s social safety net has been successful over the past few decades in giving many Americans the support they need to get ahead. Sequestration threatens to throw many American families back into poverty during the economic recovery by cutting the very programs that are helping them stay above water.
In the coming months, The Hamilton Project will continue to look at trends in poverty and how the federal government can do more to provide low-income Americans opportunities to become self-sufficient and succeed. From increasing access to post-secondary education to increasing incentives to work, there are many ways for government to reduce poverty in a way that promotes broad economic growth. Pursuing such policies will improve the lives of millions of Americans and strengthen our economy.
The Brookings Institution is committed to quality, independence, and impact.
We are supported by a diverse array of funders. In line with our values and policies, each Brookings publication represents the sole views of its author(s).

Commentary
Sequestration’s Threat to America’s Most Vulnerable
March 8, 2013