To kick off the Future Development blog in 2022, we present the second piece in a series on potential positive stories for the year ahead.
The editors of this blog decided we should strike a hopeful note in 2022, so I thought I would write about climate change. I’m not joking. There are obviously reasons to be worried: We are already seeing massive destruction from natural disasters and declines in biodiversity; and the Intergovernmental Panel on Climate Change (IPCC) announced, last year, that global emissions kept rising to the point that meeting the 1.5 degrees Celsius target of the Paris climate agreement is a herculean task and almost impossible to meet? But I believe there is also plenty of ground to be hopeful that this year will be different.
The climate emergency is hitting very close to home, even in rich countries. Last year, my home country, Germany, experienced flash floods that destroyed vast swaths of land, killed at least 180 people, and caused at least 8 billion euros in damages. This was Germany’s worst natural disaster since the end of World War II. Alas, this was just one example among many across the world.
Climate change is caused by greenhouse gases (GHG) we pump into the air. There are two main types of GHG: CO2 (released when we burn fuel in factories, power plants, and vehicles), which accounts for 72 percent of GHG emissions, and methane, which is responsible for 21 percent (coming mostly from agriculture, solid waste, and as a byproduct during oil and gas extraction and usage). Finally, there are various other gases (nitrous dioxide, fluorites) that account for the balance (see Figure 1).
Figure 1. Where do emissions come from?

Source: World Data Lab based on Minx et al (2021). For consistency with table 2, this excludes more than 2GT in LULUCF emissions and bunker fuels (i.e., international aviation and shipping) as allocation to countries is not possible yet.
For most of history, man-made climate change was not a major issue. Until around 1850 the whole world produced just around 1 gigaton (GT) of emissions each year. However, with the Industrial Revolution and the widespread use of fossil fuels, emissions increased dramatically. Today we are emitting more than 50 gigatons of GHGs every year (see Figure 1), which is equivalent to around 100,000 tons per minute. Most of these emissions come from developed and leading emerging markets: the group of G-20 economies is responsible for more than three-quarters of total emissions.
Thus, should we not expect this to worsen when more countries grow, industrialize, and develop as we would like them to? Actually, there are two main reasons for hope in 2022.
First, we are at long last coming to a common definition of the problem. Building on decadelong research, we can now quantify the drivers of climate change (basically CO2 emissions and their equivalents), classify them, and calculate them, all with increasingly better data. The next step is to develop real-time estimates and robust future projections. This is also why Germany’s G-7 presidency has commissioned the development of a “World Emissions Clock” to estimate emissions in real-time—building on the concept of the World Poverty Clock.
Second, while the world as a whole keeps increasing emissions, several countries have begun to reduce their climate footprint (see Table 1). In fact, some 41 countries, including major economies such as the U.S., Germany, and the U.K., have been reducing their emissions since 2000. In another 30 countries, emissions have declined on a per capita basis. This is still too little, but it shows that it is possible to reduce emissions while still growing the economy. A small but growing group of countries have already achieved net-zero emissions and have formed a formal alliance at COP26, underscoring their will to stay at net zero.
Table 1. A taxonomy of CO2 emitters
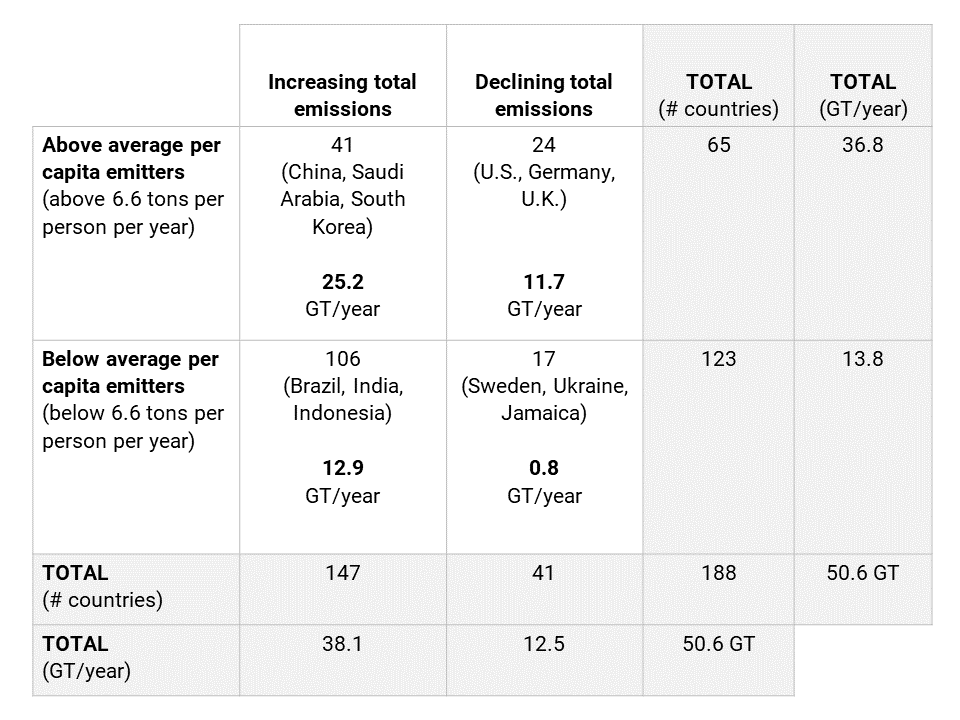
Source: World Data Lab analysis based on Minx et al (2021)
Among advanced economies, Germany wants to lead the way in the transition to clean growth. This will take a lot of effort because the starting point is very high. At the turn of the century, Germany’s emissions stood at 1.1 GT per year. Over the last 20 years, Germany managed to cut emissions by roughly 10 megatons (MT) tons each year. Still, it remains among the world’s top 10 emitters (accounting for approximately 1.7 percent of global emissions) and it won’t reach net zero by 2050—or 2045 (as the new commitments state) if it continues at this pace. In fact, it would still emit close to 600 MT by 2050 (see Figure 2).
Figure 2. Germany’s path to zero emissions
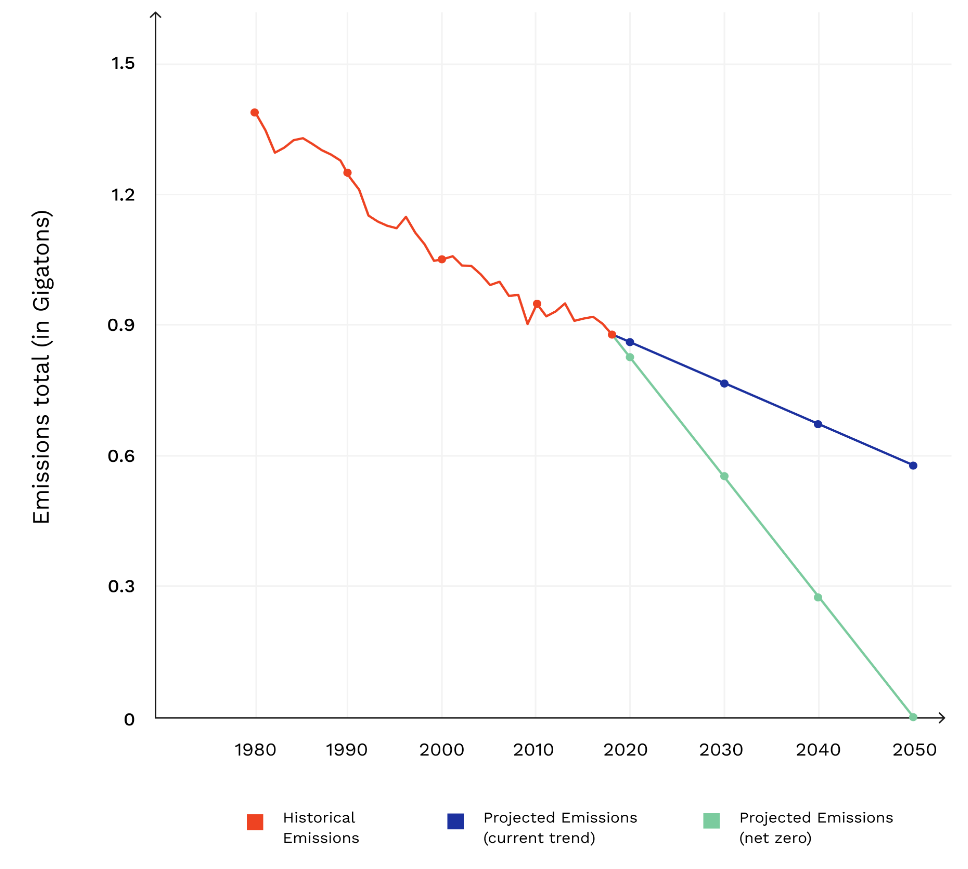
Source: World Data Lab analysis based on Minx et al (2021)
Reaching net zero in 2050 means tripling the current pace of emissions reductions (to around 30 MT per year). Where will the additional 20 MT come from? The coal and transport transitions are central as coal-based energy and transport account for around 40 percent of Germany’s emissions. If Germany would stop using coal and make all road transport clean, it would “save” around 360 MT (20 MT per year for 18 years) (see Table 2).
Table 2. How Germany could get an additional 20 MT in CO2 reduction every year
| 20 MT is equivalent to… | Notes | |
| Energy: Phasing out of coal | 7-8 plants (average size) | Germany has 73 large coal fired plants that emit around 200MT |
| Transport: Electric cars | 4.4m cars running on fossil fuels | Germany has around 48 million cars in operation; only half a million are electric |
| Industry: Cement production | Producing around 22 million tons of cement | Germany produced around 34 million tons of cement in 2018 |
| Agriculture: Beef Consumption | Consuming around 330 million kilograms of beef | Germans consume around 800 million kg of beef each year |
Source: World Data Lab estimates
Thus, it will take a wide mix of policies to get to net zero by 2050 (and preferably earlier): measures in the electricity-producing sector and transport, but also industrial production and construction. And this is my final point: We will need real numbers to be able to make the most impactful decisions. Who would have thought that the global cement industry emits three times as much as the aviation industry? Who knew that trucks and buses represent 5 percent of global emissions, only slightly below personal transport? Producing these numbers in real-time by country and subsector will go a long way to help policymakers make the most impactful decisions and add perspective to an increasingly heated debate.
Related Books

Related Content

Authors

-
Acknowledgements and disclosures
Many thanks to Lukas Vashold for his inputs. Any questions on the data model should be directed to [email protected].


Commentary
Could 2022 be a year of hope for climate?
January 14, 2022