Five years ago, I wrote the following passage right here on the Brown Center Chalkboard:
As we approach the annual celebration of Dr. King’s life, it is worth examining the difference in how our schools discipline Black and white children. In public schools in the United States, Black children are twice as likely as white children to be subject to corporal punishment.
The intervening five years have seen public conversations around racial inequities and systematic racism reach a crescendo, and these conversations presumably penetrate school and classrooms, too. Generally, social norms on issues like corporal punishment schools evolve very slowly. It’s worth checking in to see what—if anything—has changed.
Has there been progress over the last five years? In some ways, not so much. Black children are still twice as likely to be beaten in school compared to white children. But overall, the incidence of corporal punishment is noticeably lower for children of all races. What has changed—and what has not—is easily seen in the following figure, which compares the 2012 data (that which was available five years ago) with the most recently available data, which is for 2018. The data is as reported by the states and counts corporal punishment only in grades K-12. (Marie Falcone, Diana Quintero, and Jon Valant discuss the use of corporal punishment during preschool in the 2020 Chalkboard post, “Ending corporal punishment of preschool-age children.”)
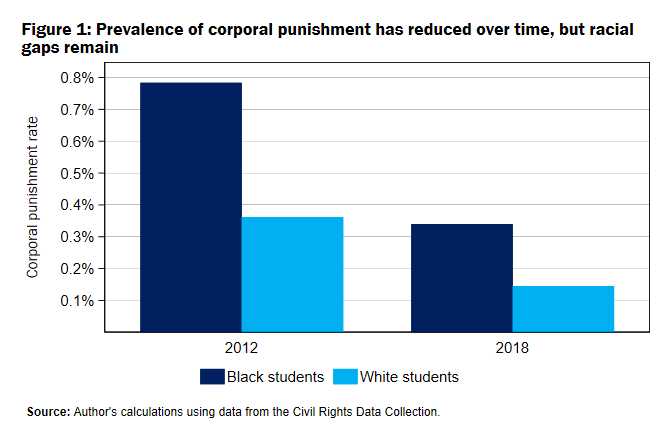
Figure 1 reveals both a change and a persistence: While the use of corporal punishment decreased greatly overall, the ratio of Black versus white incidence actually rose a small amount. (Schools also use discipline short of corporal punishment, of course, and similar trends are evident in their use of suspensions.)
Nationally, Black schoolchildren are twice as likely to be physically punished by school staff. However, there are only four states where the ratio is this high. The national numbers are largely explained by the fact that some states with a high rate of corporal punishment are also states with a large number of Black students. (Statisticians call this Simpson’s Paradox.) Notably, both the fraction of students who are Black and the overall incidence of corporal punishment are quite high in Alabama, Louisiana, and Mississippi.
Looking at the overall numbers hides some very interesting details that reveal where progress is being made. Figure 2 cleverly packs a lot of information into one picture. (I should say that the cleverness is entirely due to the UC-Santa Barbara undergraduates helping me, Leshan Xu and Karen Zhao.)
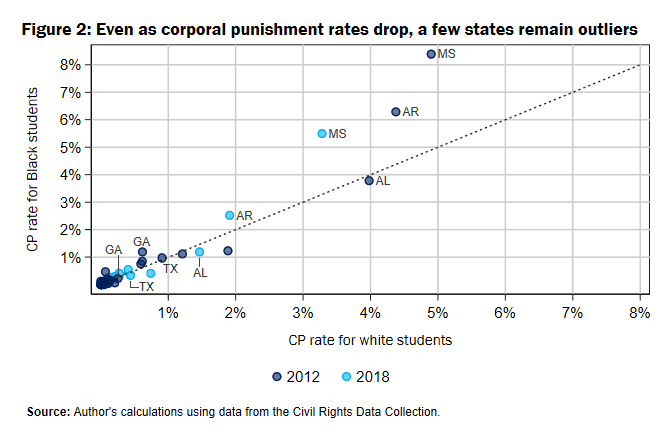
The x-axis and y-axis represent rates of corporal punishment percentages for white and Black students, respectively. States toward the top of the graph have high corporal punishment rates for Black children, and states toward the right of the graph have high corporal punishment rates for white children. The dark blue circles show the data for 2012, the light blue circles show the data for 2018. Above the dashed line, rates are disproportionately higher for Black students (and below the line, rates are higher for white students). To help understand the scaling, the nationwide rate of children corporally punished is 0.34% for Black students and 0.15% for white students—way, way down in the lower left of the graph. The visible outliers in the chart really are far from the American norm.
What’s immediately striking is how different Mississippi, Arkansas, and Alabama are from the rest of the country. These three states account for 71% of the total number of Black students who experienced corporal punishment in 2018. Incidentally, they also account for more than half of the corporal punishment of white students. The other states where the largest number of Black children are corporally punished include Texas and Georgia. As of 2018, Texas has a high rate of corporal punishment, but the rate is slightly higher for white than for Black students. Black children are almost 50% more likely than white children to be punished in Georgia schools, but it is noteworthy that the rates of corporal punishment for both races have dropped by a factor of three in the state since our last look at the data.
Also notable in the graph above is how much some states have made progress on this issue. They may still have far to go, but their progress should not be overlooked. Nationwide, the majority of states report zero rates of corporal punishment. In Alabama, the rate of corporal punishment is lower for Black students than for white students. This is was also true in 2012, but the gap has actually grown in the most recent data. (Note that this doesn’t necessarily mean that white students are more likely to experience corporal punishment than Black students in the same school. It could reflect different uses of corporal punishment across different schools.) Alabama continues to have a very high rate of corporal punishment overall, but it is also true that the rate has dropped considerably from what it was in the past. In Arkansas, racial application of corporal punishment was very disproportionate; it is somewhat less so now. More notably, the overall rate—while it remains very high—has fallen to less than half of what it was.
And then we come to Mississippi. In 2012, Mississippi schools had the highest rate in the nation of corporal punishment for Black children—and the highest for white children as well. In 2018, Mississippi still had the highest rate in the nation of corporal punishment for both Black and white children. And while discipline in Mississippi remains very much out of line with the nation as a whole, it is also true that Mississippi has reduced its use of corporal punishment substantially.
It appears from the state-level data that attitudes in Mississippi toward how schoolchildren should be treated differ greatly from America’s overall values. I would venture an argument that what we see in Mississippi does not even reflect dominant attitudes in Mississippi. Rather, what we see is a fairly small number of school districts where the behavior deviates substantially from Mississippi values. In the majority of Mississippi schools, the reported incidence of corporal punishment was zero. In fact, 74 of the 955 schools in Mississippi—less than 10%—account for half of all students suffering corporal punishment in the state.
In other words, most of the use of corporal punishment comes from schools out of step with the rest of Mississippi. Corporal punishment is particularly prevalent in a number of small districts. The overall rate of corporal punishment in Mississippi is four per 100 students, but it’s above 25 per 100 students in four districts. To name names: Aberdeen, Attala County, East Tallahatchie Consolidated, and West Jaspar Consolidated. In fact, 11 small districts—each with fewer than 4,000 students—account for 20% of corporal punishment in Mississippi.
Five years ago, I wrote:
Every time a child is beaten in school … something or someone has failed that child along the way, regardless of the “reason” for the punishment. So long as these failures fall disproportionately on Black children, we are not yet living up to the dream that “children will one day live in a nation where they will not be judged by the color of their skin but by the content of their character.”
Progress has been made, and progress has been made notably in the South. Perhaps, if a relatively small number of locales choose to follow the examples set by nearby neighbors, the only update that needs to be made in another five years will be a celebratory report.
The author is grateful to UC-Santa Barbara undergraduates and Gretler Fellows Leshan Xu and Karen Zhao for research assistance.
Related Content
Author

The Brookings Institution is committed to quality, independence, and impact.
We are supported by a diverse array of funders. In line with our values and policies, each Brookings publication represents the sole views of its author(s).