


College student loan debt has become a central focus of students and policymakers in the United States. Over the past ten years, the volume of outstanding college student loan debt has tripled, reaching more than $1 trillion and raising concerns for both students and policymakers. At the same time, enrollments in for-profit colleges spiked, rising from about 650,000 in 2000 to close to 2.5 million in 2010. Increased scrutiny and regulation of the for-profit sector has contributed to declining enrollment in recent years, but concerns remain over the high debt burdens and default rates of for-profit students.
Borrowing behavior across sectors and over time
In a Brown Center report we released today, we explore the trends in students’ borrowing across sectors and examine how they have changed over time. Overall, the patterns of for-profit student borrowing look most similar to private nonprofit student borrowing. Relative to students in the public sector, for-profit and private nonprofit students are much more likely to borrow to finance their higher education, they borrow larger amounts of money, and also supplement federal borrowing with borrowing from nonfederal sources, which tend to have less-favorable terms.
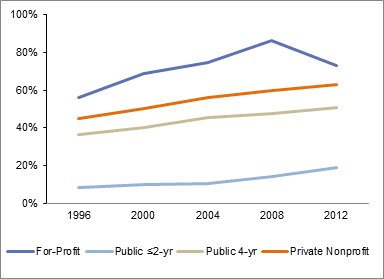
Figure A displays the trend in the percentage of students who borrow (from any source) from 1996 to 2012. While the relative position of schools in this trend stays constant, and all schools experience an overall positive upward trend in the percentage of students borrowing, the for-profit sector experienced a steeper initial climb followed by a sharp decline in recent years. Between 1996 and 2008, the for-profit sector experienced a 30 percentage point increase in the proportion of students borrowing. But between 2008 and 2012, for-profit borrowing dipped—dropping from its peak of 87 percent back to just under its 2004 level of 73 percent.
Figure A. Percentage of Students Borrowing
What explains student borrowing?
1. Academics and demographics
There are some obvious differences across sectors in the credentials that students seek. For-profit students are more likely than students in other sectors to be enrolled in certificate or associate’s degree programs (59 percent). Only about 40 percent of for-profit students are enrolled in bachelor’s degree programs, compared to roughly 90 percent of students in 4-year public and private nonprofits institutions.
Although for-profit students’ borrowing patterns are similar to private nonprofit students’, their demographics are a stark contrast. For-profit students are demographically most similar to public two-year students, but even between these two sectors, many important differences remain. For-profits have the highest proportion of female and minority students, they come from families with the lowest levels of parental education, are the most likely to be single parents, and have the highest average number of dependents among the sectors.
2. Financial resources and employment
Given the demographic composition of the student body, it should come as no surprise that for-profit students are most similar to, but in many ways still less affluent than, public two-year students who pay much lower costs for their higher education. For-profit students have the lowest average annual household income and are closest, on average, to the poverty line. Although the proportions of students who work are similar across sectors, for-profit students are the most likely to work full-time and log the most hours per week. For-profit and public two-year students are also most likely to have jobs off campus, which may increase commuting times and reduce campus integration.
3. Cost of education
Private nonprofits have average yearly gross tuition and fees totaling over $21,000—more than $11,000 higher than for-profits—while for-profit institutions have much higher average tuition and fees than public sector institutions. Compared to students at public two-year colleges, average gross tuition and fees of for-profit students are nearly seven times higher.
What really sets for-profit students apart, though, is the amount and composition of grant aid they receive. For-profit students have higher average levels of federal grants than all other sectors—due to having the highest financial need among all student bodies and their high rate of application for aid. Yet, they have far lower levels of other types of grant aid, particularly in the form of aid from the college itself. While institutions in the private nonprofit sector appear to be trying to make tuition increases less painful for their students through the generous provision of institutional aid, there is no evidence that for-profits have made any significant effort, which leaves a gap in resources that has generally been filled by student loans.
Unexplained borrowing
We decompose the difference in borrowing rates between for-profit and public two-year colleges into explained and unexplained variation. Of a total difference of 63 percent, the observable factors described above explain about 38 percent of the differential. The relatively high for-profit cost is by far the largest predictor of this explained variation, implying that for-profit student borrowing would be lower if costs were more similar to those in public community college. Observable demographics, academics, location, and even student resources contribute much less to differences in borrowing between sectors when compared to the net costs of attendance. In addition, we find that our variables can explain roughly half of the difference in loan amounts between the for-profit and public two-year sector.
Several factors may play a role in accounting for the unexplained borrowing variation between sectors.
First, financially independent students in for-profit colleges may have unmeasured need or less access to other types of non-loan aid relative to students in other sectors, making them more reliant on student loans. For example, they could have less money in personal savings—which is not counted in financial aid formulas for low-income students—on hand to pay for their higher education expenses.
Second, for-profit students (more than students in other sectors) may lack access to information about their educational options, college finance, or their expected labor market outcomes. For-profit students are least likely to have parents who completed college. Along with public two-year students, for-profit students appear to receive less advice about aid from family and friends and conduct less internet research about their options. This may cause them to be overly optimistic about their expected earnings. The lack of information and college-going networks on which they can rely also makes for-profit students particularly susceptible to the types of misrepresentation about aid and job market prospects that have been reported at some for-profit colleges.
If informational deficiencies are at least partly to blame for the high and unexplained student borrowing in the for-profit sector, the increased public scrutiny and investigations of the for-profit sector—beginning around 2010—may have raised student awareness or changed the behavior of institutions. These changes may be reflected in the declining enrollment and borrowing in the sector that we observe between 2008 and 2012. Furthermore, new tools and policies, like the College Scorecard and the disclosure requirements under Gainful Employment, hold promise for improving student decision-making. However, these initiatives may not be sufficient for all students to make complex college choice and financial aid decisions. More work is needed to understand how to deliver such information and whether more intensive supports are needed for some students. Scalable interventions that couple information provision with personalized student support may hold promise for students considering enrolling in for-profit institutions.
Grant Michl and Diana Quintero contributed to this post.
Related Content


Related Books
The Brookings Institution is committed to quality, independence, and impact.
We are supported by a diverse array of funders. In line with our values and policies, each Brookings publication represents the sole views of its author(s).