Editor’s Note: This blog is part of a collection of posts discussing sub-Saharan Africa’s high youth unemployment rate and policies to combat it. In this series, scholars explore the complex challenges around youth unemployment facing policymakers in South Africa, Ghana, Kenya, Uganda and Nigeria.
Introduction and Incidence of Unemployment in Kenya
The unemployment problem is global and presents a particularly difficult labor market experience for youth. In Africa especially, unemployment and underemployment continue to be major obstacles to the full utilization of human resources despite relatively strong growth in the region over the last decade.
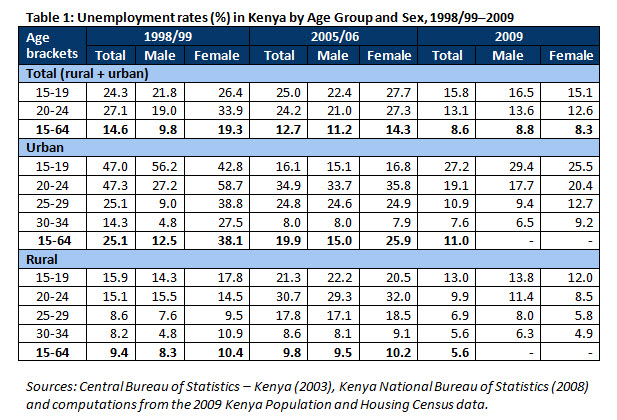
Youth in Kenya are experiencing much higher unemployment rates than the rest of the Kenyan population, as seen in Table 1. In 2005/06, youths aged 15-19 and 20-24 years had unemployment rates of 25 percent and 24 percent, respectively—about double the overall unemployment of 12.7 percent for the entire working-age group. Based on the 2009 census, the open unemployment rates declined for youth, but among youth aged 15-19 and 20-24 years these rates were about 15.8 percent and 13.1 percent, respectively—relative to a total unemployment rate of 8.6 percent. Interestingly, in recent years, the unemployment rates of females and males aged 15-19 and 20-24 years are quite comparable, though this trend is similar across all age groups in Kenya. For example, in 2009, male youth aged 20-24 years had an unemployment rate of 13.6 percent relative to the females’ rate of 12.6 percent.
There is a substantial variation in unemployment rates in urban and rural regions. In 2005/06 as well as 2009, the respective urban total unemployment rates of 19.9 percent and 11.0 percent were about twice as large as the rural rates. Like the national trends, within these regions, youth unemployment was much larger than that of the working-age population. In urban areas in 2009, for instance, the overall unemployment rate was about 11.0 percent relative to a youth (20-24 years) unemployment rate of 19.1 percent.
Unemployment Versus Related Labor Market Challenges
In a developing country such as Kenya, the estimated unemployment rates underestimate the enormity of the labor market challenge because a large number of individuals are inactive
[1]
rather than unemployed, and most of the individuals in employment are engaged in informal jobs. It is thus important to look at other related challenges, such as inactivity and informal employment, for a fuller appreciation of the labor market challenge facing youth (Boateng, 2000).
Figure 1 illustrates a broader representation of the challenges relating to youth employment. A key message emanating from Figure 1 is that unemployment, using the narrow or broad definition, is just one of the labor market challenges facing the Kenyan youth. The largest share of Kenyan youth—about 48.6 percent—was employed in 2009, and nearly 33 percent were full-time students. Even though a large share of youth is employed, most are engaged in informal activities. In 2009, about 84 percent of employed youth aged 15 to 24 years were in informal employment (which provides a rough estimate of individuals engaged in vulnerable jobs). Importantly, the proportion of inactive youths exceeds the proportion that is unemployed; about 10.2 percent were inactive (mainly “homemakers”) while an 8 percent share was unemployed.
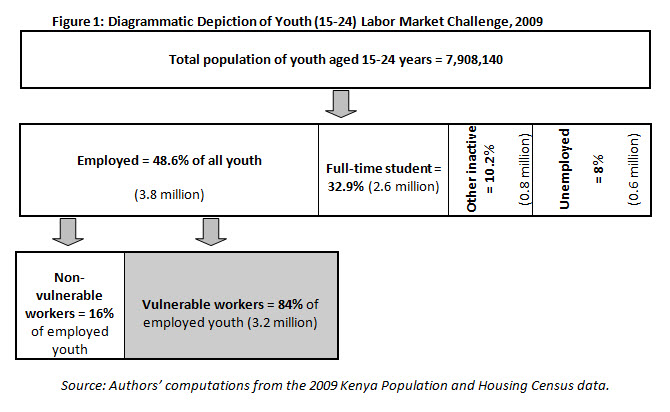
Clearly then, besides addressing unemployment, policy interventions should focus on the issues of job quality and youth inactivity. In terms of policy interventions, the demarcation of the related challenges is vital, since what might work in reducing unemployment may not address poor quality jobs or inactivity.
Educational Attainment and Labor Market Status of the Youth
A second key point this article seeks to convey relates to education. A majority of youth are still stuck at low levels of educational achievement. Specifically, 62 percent of youth aged 15-34 years have below secondary level education, 34 percent have secondary education, and only 1 percent have university education.
Educational attainment appears to have a strong influence on an individual’s labor market activity. Compared to employed individuals, the openly unemployed and inactive youths have a higher proportion of individuals who “never went to school.” In addition, about 90 percent of all employed individuals whose highest level of education is primary school are engaged in vulnerable jobs, compared to 61 percent and 21 percent for those with at least secondary and university qualifications, respectively. Other census-related data indicates that about 40 percent of Kenya’s youth either “never attended school” or “did not complete primary education.”
Despite the country’s free primary and secondary education policy that greatly subsidizes basic education, it is estimated that about 14 percent of the approximately 10.6 million children (aged between 5 and 14 years) left school or never attended school in 2009, and about 68 percent of secondary school-age youth (between 14-17) were not in school. These children are likely to become youths with little employable labor market skills over the next decade.
A Review of Public Policies
Because unemployment has been viewed to be generally high in the recent past, it may be difficult to identify relatively successful public policies. But in one way or another, different policy interventions had their own successes and failures. Broad policy frameworks such as the Economic Recovery Strategy for Wealth and Employment Creation (ERSWEC) (Government of Kenya, 2003) are credited for the upturn in economic growth beginning in 2003 (and averaging 5.44 percent in 2003-2007 compared to 1.72 percent in 1998-2002) and whose momentum continues to date (but was briefly interrupted by the post-election violence in 2007-2008). However, the economic growth rate was perhaps not large enough to reduce unemployment rates significantly. Employment creation grew at about half a million jobs per year, but most of the jobs created were in the informal sector. The economy thus failed to create good quality jobs for its ever-growing labor force.
Not-So-Successful Policies
The International Labor Organization (ILO) sent a Comprehensive Employment Mission to Kenya in 1972. The multi-disciplinary mission analyzed and gave recommendations on a report titled “Employment, incomes and equality,” in which it coined the phrase “informal sector.” The report considered the informal sector instrumental in creating employment and income generation (ILO, 1972). The ILO mission noted that the “informal sector activities were largely ignored, rarely supported … and sometimes actively discouraged by the Government” despite the “sector’s resilience.” Up until now, the informal sector in Kenya has grown and currently employs about 81 percent of workers. And for a long time, the government has generally lacked policy interventions addressing the issue of informality and small and medium enterprises.
Two notable interventions were the Sessional Paper No. 2 of 1992 on Small Enterprise and Jua Kali Development in Kenya, and Sessional Paper No. 2 of 2005 on Development of Micro and Small Enterprises for Wealth and Employment Creation for Poverty Reduction, which puts emphasis on the micro and small enterprise (MSE) sector (Gitonga, 2008). The Sessional papers concentrated on creating an enabling environment for these businesses, providing credit, and developing non-financial promotional programs.
Even so, gaps still remain. First, the policies failed to clearly demarcate the formal from the informal economy/sector, and thus failed to provide clear incentives for firms to formalize. Within policy circles, the terms MSEs, Jua Kali and “informal sector” are used interchangeably, yet not all MSEs are actually informal. In addition, the policy does not demarcate between survivalist and growth-oriented enterprises (Gitonga, 2008). Interventions are thus blind to the different needs of the heterogeneous establishments. Second, with respect to taxation and statutory requirements, formal MSEs tend to be treated in a similar manner to large firms, hence diminishing incentives for informal MSE firms to formalize their operations.
Another challenge is that access to formal credit by a majority of MSEs is relatively low. The majority of non-agricultural small enterprises (74 percent) rely on either their own savings or funds from family members for their initial capital. The study concludes that there is significant room to improve access to credit for better performance of the MSE sector.
Relatively Successful Policies
The Kenya Jua Kali Voucher Programme—an intervention aimed at making training systems work better for young people—was an example of a relatively successful unemployment policy. It was initiated in 1997 as a pilot scheme under the Micro and Small Enterprise Training and Technology Project and addressed training market failures by making information available, providing credit and other financial incentives, and reducing location-related barriers.
Eligible unemployed persons (mainly the disadvantaged youth) were given vouchers that they could use to pay for training at a provider of their choice. This design had two advantages: First, it ensured a better match between the participant and the training course; and second, it generated competition among training providers (mainly master craftsmen), hence improving the quality of training. About 37,606 vouchers were issued in firms with 50 or fewer workers in 1997–2001. Participants paid only 10 percent of the cost of the voucher, while the government subsidy covered the rest.
Evidence suggests that the scheme increased employment and assets of participants in comparison to a control group. However, it highlighted a number of implementation challenges that such schemes might face. First, programs like these are complex and costly to establish. Second, it is difficult to phase out the training subsidy, which in itself may be a source of distortion of the training market.
Such challenges can be overcome by having an exit strategy upfront before rolling out the scheme, and promote willingness of clients to pay for training. It is thought that the private sector may be a more successful channel through which the subsidy could be channeled.
Other ongoing interventions include the Youth Enterprise Development Fund, which provides loans and other support to youth enterprises, and the Uwezo Fund, which provides grants and interest-free loans to women and youth. While no impact evaluation has been done to assess the effects of these initiatives, it is hoped that they will contribute to addressing Kenya’s youth unemployment challenge.
Conclusion
Unemployment rates estimated in the last two national surveys and the 2009 Kenya Population Census suggest that open unemployment among youth aged 15-19 and 20-24 years is significantly larger than that of the entire working age group.
Although the government and other stakeholders tend to put more focus on unemployment, there should be sustained effort to address labor market related challenges that encompass remedies for “inactivity” and “poor quality jobs” as well. This is because inactivity and poor quality jobs actually affect a larger share of youth relative to those openly unemployed.
There is a case for an urgent enhancement of interventions that promote access to quality basic education for the youth for better labor market outcomes. This is because many youths are still stuck at low levels of educational achievement—and education appears to have a strong influence on an individual’s labor market activity. In addition, some policy interventions such as the MSE sector interventions have had their shortcomings. A key lesson for the government and other stakeholders is the need to effectively diagnose the challenges, and also monitor and evaluate policy interventions to inform subsequent interventions.
Note:
Boaz Munga is a policy analyst in the Social Sector Division of the Kenya Institute for Public Policy Research and Analysis (KIPPRA). Eldah Onsomu is a policy analyst in the Social Sector Division of KIPPRA. KIPPRA is one of the Brookings Africa Growth Initiative’s six local think tank partners based in Africa. This blog reflects the views of the authors only and does not reflect the views of the Africa Growth Initiative.
[1] The inactive include: homemakers, those not working but who took “no action” in seeking work, the incapacitated and the retired. In some cases, full-time students are included. But in this analysis full-time students are excluded from the inactive category.
References
Boateng K. (2000). “Economics of the Labour Market and the Ghanaian Experience”, Department of Economics, University of Ghana.
Central Bureau of Statistics (CBS) (2003). Report of 1998/99 Labour Force Survey. Nairobi: Government Printer.
Fashoyin and Tiraboschi (Eds), (2012). Youth Unemployment and Joblessness: Causes, Consequences, Responses. Tyne: Cambridge Scholars Publishing. Accessed: http://www.adapt.it/englishbulletin/docs/flyer_book3.pdf
Gitonga (2007). Factors Affecting Growth of Small and Micro Enterprises in Kenya. Kenya Institute for Public Policy Research and Analysis Discussion Paper No. 88. Nairobi: KIPPRA. Accessed: http://www.kippra.org/index.php?option=com_docman&task=cat_view&gid=7&limit=5&limitstart=50&order=name&dir=ASC
Government of Kenya (1985). Sessional Paper No. 2 of 1985 on Unemployment. Nairobi: Government Printer.
Government of Kenya (2003). Economic Recovery Strategy for Wealth and Employment Creation 2003-2007. Nairobi: Government Printer. Accessed: http://siteresources.worldbank.org/KENYAEXTN/Resources/ERS.pdf
Government of Kenya (2005). Sessional Paper No. 2 of 2005 on Development of Mirco and Small Enterprises for Wealth and Employment Creation for Poverty Reduction. Nairobi: Government Printer.
Government of Kenya (2008). Sessional Paper No. 7 of 2005 on Employment Policy and Strategy for Kenya. Nairobi: Government Printer.
Government of Kenya (1965). Sessional Paper No. 1 on African Socialism and its Application to Planning in Kenya. Nairobi: Government Printer.
International Labour Organization (ILO) (1972). Employment, Incomes and Equality. A Strategy for Increasing Productive Employment in Kenya. Geneva: ILO. Accessed: http://www.ilo.org/public/libdoc/ilo/1972/72B09_608_engl.pdf
Johanson, Richard and Arvil V. Adams (2004). Skills Development in Sub‐Saharan Africa. Regional and Sectoral Studies, World Bank, Washington, DC. Accessed: http://siteresources.worldbank.org/EDUCATION/Resources/278200-1126210664195/1636971-1126210694253/Skills_Development_Africa.pdf
Kenya National Bureau of Statistics (KNBS) (2008). Labour Force Analytical Report – Based on the Kenya Integrated Household Budget Survey (2005/2006). Nairobi: Government Printer.
Kenya National Bureau of Statistics (KNBS) (1990 to 2013). Economic Survey. Nairobi: Government Printer. Accessed: http://www.knbs.or.ke/index.php?option=com_phocadownload&view=category&id=107&Itemid=1181
Pollin, R., Githinji, M. and Heintz, J. (2007). An Employment-Targeted Economic Programme for Kenya. Political Economy Research Institute (PERI). Amherst, MA. Accessed: http://www.peri.umass.edu/fileadmin/pdf/other_publication_types/Kenya_UNDP_Study_10-27-07.pdf
Ryan, T.C.I. (2002). Policy Timeline and Time Series Data for Kenya: An Analytical Data Compendium. Kenya Institute for Public Policy Research and Analysis (KIPPRA) Special Report No. 3. Nairobi: KIPPRA. Accessed: http://www.worldcat.org/title/policy-timeline-and-time-series-data-for-kenya-an-analytical-data-compendium/oclc/123376839
World Bank (2005). Jobs in Kenya: Concept Note. Manuscript. Washington DC: World Bank.
World Bank (2008). Kenya: Accelerating and Sustaining Inclusive Growth. Washington DC: World Bank. Accessed: http://s3.marsgroupkenya.org/media/documents/2011/02/13feaeaf037e1ce809051509d67c9039.pdf
The Brookings Institution is committed to quality, independence, and impact.
We are supported by a diverse array of funders. In line with our values and policies, each Brookings publication represents the sole views of its author(s).


Commentary
State of Youth Unemployment in Kenya
August 21, 2014