When considering the levels of income poverty and inequality in post-apartheid South Africa, we see that poverty has not changed significantly, but income inequality has increased dramatically. However, this is only part of a bigger story, and it masks the significant changes that have taken place in terms of access to public assets and service delivery in the country.
Economists most often examine the impact of economic growth on income poverty (and sometimes inequality) when attempting to assess welfare outcomes in a society. Less often, but equally important, is the need to estimate the impact on welfare in terms of the delivery of assets and services to the poor. A consideration of South Africa’s household data around its targeted post-asset delivery program certainly tells a story of improved welfare.
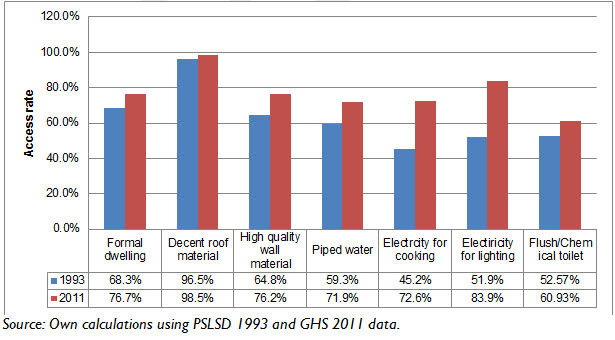
Twenty years ago, South Africa was characterized by significant asset and service deficits—a key legacy of the apartheid regime. For example, in 1993, 51 percent of households did not have access to electricity, 40 percent were without access to piped water, and 30 percent of all individuals had no formal dwelling. Figure 1 presents the access rate to various public assets before apartheid officially ended, alongside the access rates experienced 18 years later. From this figure, it is evident that the situation has markedly improved: The percentage of households with formal dwellings, decent roof material, high-quality wall material, piped water, electricity for cooking, electricity for lighting, and flush or chemical toilets all increased steadily between 1993 and 2011.
Figure 1: Household access to public assets, 1993-2011
The rapid rise in asset delivery by the state and the concurrent reduction in asset poverty and inequality were outcomes of a targeted set of programs. In terms of housing, for example, large parts of South Africa’s national budget were dedicated to building new homes as well as upgrading of existing informal housing. The data show that the number of formal dwellings post-apartheid increased from 5.8 to 11.3 million in 2011. In other words, almost a million additional people per annum were provided with formal shelter over the 18-year period.
As part of a household electrification program, the number of households with access to electricity increased from 4.4 million to 12.4 million, ensuring that 441,000 new households were given access to electricity every year. This was to some extent due to the introduction of the Electricity Basic Services Support Tariff in 2002, which provides 50 kW of free electricity to all households, so as to attend to the basic electrical needs of a household such as lighting and cooking.
In terms of water services, in 1994 a free basic water and sanitation services policy was introduced by the new government of Nelson Mandela, specifically targeting poorer households. As a consequence, the number of households with piped water increased dramatically from 5 to 10.6 million over the 1993-2011 period.
To measure non-income welfare, an index of public assets such as housing, electricity and water at the household level can be estimated. This index value reflects a “basket” of public assets, where a higher value indicates an asset wealthy household. For each of the four years considered since 1993, the asset index for South Africa increased continuously—implying that the average household became less asset poor over the period. In other words, the index shows that the asset delivery program was successful in achieving its primary aim: to target the households that were marginalized in 1993. Furthermore, the changes in the values of the asset index suggest a larger improvement between 1993 and 1999 (the mean asset index increased more rapidly in this six-year window), compared with the 1999-2005 and the 2005-2011 periods.
The asset index was also used to derive asset poverty lines, which showed a significant decline in the number of households below the asset poverty headcount between 1993 and 2011. In 1993 there were many more female-headed households that were suffering from lack of access to services and assets than male-headed households, but the data shows that over the 18 years the gap narrowed. During this time, the actual number of female-headed households below the poverty line declined by almost 18 percent whereas the number of male-headed households below the line declined by only 12 per-cent. This may suggest that there has been a positive gender bias in terms of asset delivery.
Our analysis shows that through the intervention of the state, asset poverty declined significantly in the post-apartheid period in South Africa. Hence, despite an increase in income inequality, the welfare trend here demonstrates a phenomenally successful pro-poor state delivery program. While there are many households that still do not have access to basic services and others that are not satisfied with the quality of service they do receive, they are far fewer now than 20 years ago. For the large majority of the population, the standard of living by these indicators has certainly improved.
This is an important lesson in how welfare should be measured, and how a non-income approach can paint a very different, and at times a far more positive, picture. An asset poverty index is a powerful tool for measuring development and the effectiveness of state-run programs, which is especially useful in the developing country context.


Commentary
South Africa’s Welfare Success Story I: A Rapid Asset Delivery Program
January 24, 2014