Introduction
The admissions and pricing practices of selective American colleges and universities have come under intense scrutiny recently. One main target is the expanding enrollment of students who apply through the early decision (ED) process. Students who apply ED submit their applications—and receive a decision—earlier in the fall for entry the following year. But they have to agree to attend if they are accepted, and they cannot apply ED at another college. Accepted students can decline to attend if they cannot afford the price.
Concerns about the practice abound, as observed in the mainstream media. It is said to reduce options for students, divorce admission from merit, and demonstrate colleges’ desires to increase the share of admitted students who enroll (“yield”).
This analysis focuses on the concern that ED disadvantages lower-income students. They are less able than their higher-income counterparts to commit to a particular college without seeing all their financial aid offers. Colleges may use ED to enroll more higher-income students, who pay more. ED may also reduce competition between colleges, allowing them to charge higher prices to these higher-income students. This argument that ED reduces competition is the basis of an anti-trust lawsuit against several institutions that use ED.
Some evidence supports the idea that ED advantages wealthier students. For instance, one study found that among students with strong academic records, those from families with annual incomes over $250,000 (in 2013$; $350,000 today) were almost twice as likely to apply ED compared to those with incomes below $50,000 ($70,000 today). Another study found that equally qualified students who apply ED have a 20% to 30% higher acceptance probability than those who apply at the regular deadline.
But ED represents just the first part of a full admissions cycle, which also includes the more traditional “regular decision” (RD) admissions season. Colleges may review regular decision applications differently when they use or expand ED. One objective of the admissions process at selective colleges, including both ED and RD is to generate sufficient revenue.1 Colleges and universities have budgets, and as nonprofit institutions, their revenues need to equal their expenses. Student payments for tuition and other costs are an important source of revenue. Their budgets include line items for revenue from students, and the admissions process needs to enroll students to meet that target.2 If an institution generates more revenue during ED in the fall, it needs less from RD in the spring to hit the revenue target. Filling a portion of the class with high-income students in the fall may not disadvantage lower-income students if it allows colleges to admit more of them in the spring. Overall, what matters for the finances of the institution and the socioeconomic composition of its entering class is the net result over the entire admissions process.
The goal of this analysis is to examine the impact of ED policies on revenue from all enrolling students, regardless of when they were admitted, along with their socioeconomic status. The results indicate that greater use of ED is not associated with changes in the average price entering students pay or the percentage of lower-income students in an entering class.
Data and sample of institutions
Complete data on the percentage of a freshman class that is enrolled through ED is not publicly available. Many colleges report it in the Common Data Set, which they often post on their website, but the collective set of data is proprietary.3 I use data collected for a recent study, which compiled data on the number of students admitted through ED for 2015/16 and 2024/25 for 73 colleges and universities.4 The institutions included represent all those that enrolled 40% or more of the entering class of 2024/25 through ED.
For the purposes of this exercise, I focus on 66 colleges.5 Appendix Table 1 lists those institutions along with the percentage of their freshmen classes enrolled through ED in each available academic year. Most of these institutions used ED in both years, but five of them introduced it in the interim (bolded in Appendix Table 1). On average, the share of students enrolled through ED rose from 38% to 54% for this sample.6
I attach to these data additional information on institutional finances and the economic composition of “freshmen” (full-time, first-time degree/certificate-seeking undergraduates) classes using data available from the U.S. Department of Education (IPEDS). Specifically, I construct a measure of “average freshman revenue,” capturing the average amount paid by freshmen in each academic year at each institution.7 These data also include the percentage of students receiving Pell Grants, the largest form of federal financial aid that does not need to be repaid (i.e., “grant-based aid”). These grants are available to students roughly in the lower 40% of the income distribution during the period of this study.8 These data are available for the 2008/09 to 2023/24 academic years. The most recent year lags the 2024/2025 data on the percentage of entering classes enrolled through ED by a single year. This analysis ignores that distinction.
Average freshman revenue and Pell Grant receipt hasn’t changed among heavy ED users
Figures 1a and 1b present trends in average freshman revenues and freshman Pell Grant receipt, respectively, for these institutions that heavily rely on ED in their admissions process. The trend in average freshman revenue closely tracks that observed for all students at four-year private institutions.9 The increased use of ED at these institutions since 2015/16 is not associated with an increase in average freshman revenue.


For the most part, the percentage of freshman receiving a Pell Grant didn’t change much either. That percentage is partially determined by admissions policies and partly determined by the generosity of the Pell Grant system. Changes in system generosity were modest after 2010 up until FAFSA Simplification, which first affected enrolled students in 2024/25. The increase in Pell Grant receipt in 2008/09 and 2009/2010 shown in Figure 1b is the result of the Great Recession and benefit increases, which resulted in a surge of Pell Grant eligibility.
In Figures 2a and 2b I explore whether institutions with larger increases in ED use experienced differential changes in the average price paid by freshman (revenue to institutions) or percentage receiving a Pell Grant. Figure 2a shows that colleges that expanded their use of ED did not systematically collect more revenue from freshmen. Figure 2b repeats the analysis for the percentage of freshman receiving Pell Grants. There is some variability across colleges in this percentage over time, but it appears to be unrelated to changes in ED use.


Table 1 presents the results of regression analyses relating changes in ED use to changes in average freshman revenue and the percentage of freshmen receiving Pell Grants. I distinguish between models that treat each institution equally (as the figures do) and models that weight the institutions by the number of enrolled freshmen, placing greater emphasis on the bigger colleges. The results are similar across specifications.
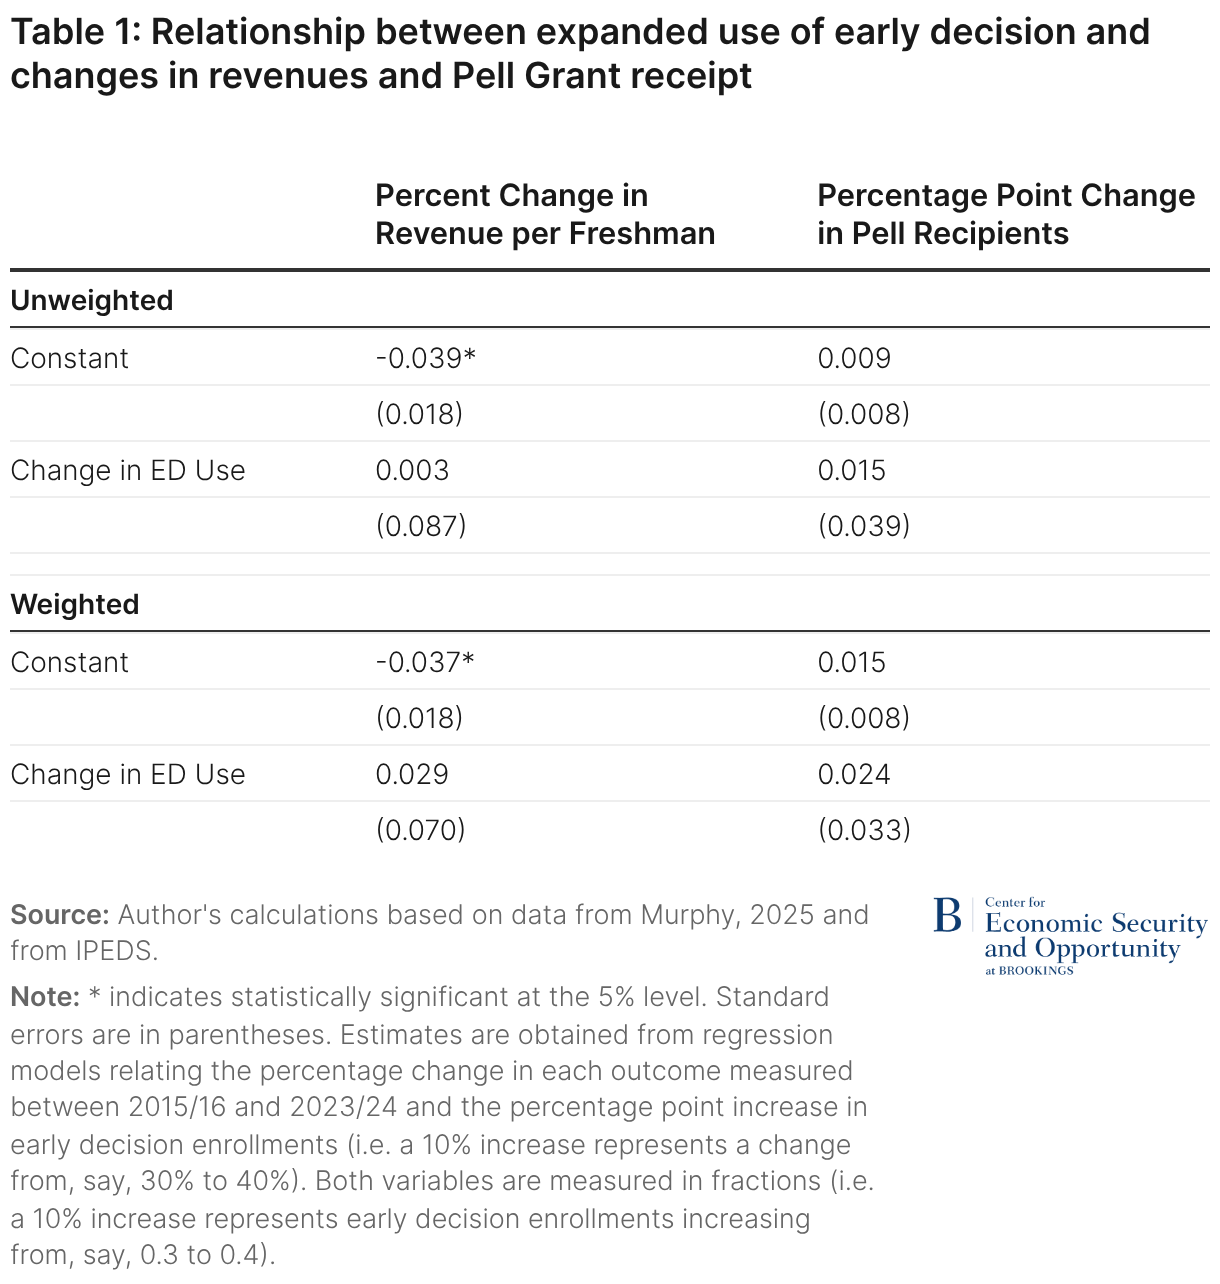
The results support the visual impression of the figures—there is little evidence that increasing ED use is related to either outcome. Average freshman revenue declined by almost 4% at institutions that had no change in ED use (i.e., the intercept of the regression). The relationship between increasing ED use and revenue, though, is small and statistically insignificant. The unweighted results indicate that every 10 percentage point increase in ED use over the period was associated with an increase in average freshman revenue of 0.03%. Even the high end of a 95% confidence interval only reaches a 1.7% increase in revenue. Estimates from the weighted regression are also modest (0.3% point estimate and 1.6% upper bound, respectively).
The estimates are similarly small regarding Pell Grant receipt. At institutions that didn’t change their use of ED, Pell Grant receipt among freshman was largely unchanged (the point estimate of a 1.5 percentage point baseline increase—the intercept—in the weighted model is statistically significant only at the 10% level). A 10 percentage point increase in ED use is associated with small but statistically insignificant increases in Pell Grant receipt regardless of the use of weights. Overall, these results are inconsistent with the hypotheses that greater ED use increases revenue and reduces socioeconomic diversity.
To be clear, one should be cautious about a strict causal interpretation of these results. Those institutions that increased ED use more over the period may have faced other changes that contributed to their admissions policies and their revenue. For instance, institutions facing external pressures that threatened enrollment and revenue may have relied more heavily on ED in response. I dropped institutions facing extreme financial difficulties from the analysis, but that doesn’t fully address this issue.
Beyond that, there are other technical considerations to keep in mind in evaluating these findings. First, most of the colleges in this analysis were already using ED to a significant extent in the beginning of the period. Too few of them started using ED for the first time during this sample window to examine them separately and consider the impact of introducing ED. Second, the impact of a single institution changing its ED policy may differ from that if all colleges changed their use of ED at the same time (i.e., universally adopting or banning the approach). For instance, some students prefer applying ED to lock in their first-choice college. If other institutions have ED policies, those that don’t could be at a competitive disadvantage; but if no colleges use ED, no such disadvantage would exist.
Interpreting the results
To determine who wins and who loses when the use of ED expands, we have to take stock at the end of the admissions process, not in the middle. The answer depends not only on the outcome of the ED process in the fall, but also what happens during regular decision admissions in the spring. This analysis shows that considering all entering freshmen, average revenue and the share receiving Pell Grants did not change significantly depending on how much institutions increased their use of ED. These findings suggest that if higher-income students are advantaged in ED in the fall, that is offset by advantages for lower- and middle-income students during regular decision admissions in the spring.
If not to increase net revenue, then why do colleges use ED? They may consider such a strategy useful since it reduces the risk that they miss their revenue target. Locking in students paying a higher price early enables institutions to admit students in the spring with less concern about their ability to pay.
One useful extension of this analysis would be to consider the distribution of the net prices paid by students at different income levels. Overall, greater ED use may lead to offsetting effects on the amount paid by students at different income levels. For instance, higher-income students may pay more and lower-income students may pay less. A complete analysis that would examine this possibility requires detailed data on the incomes of enrolled students along with the net prices they paid. Such data are not publicly available.10
This possibility raises a distinct question under antitrust law. Can practices that limit consumers’ ability to compare individualized prices—thereby raising prices for some students while lowering prices for others—raise competitive concerns even when no uniform price increase is observed? In most markets, this question rarely arises because consumers face a single posted price. In higher education, however, financial aid produces individualized net prices, with most students paying less than the full cost of attendance. Whatever the legal status of such practices, there are potential advantages of a system where higher-income students pay more and lower-income students pay less.
There are other issues to consider in thinking about the appropriate role of ED in the admissions process as well. How well do students match with the school where they enroll? Does ED affect student/family stress levels? How does ED affect racial diversity on college campuses? Certainly, these questions are worth considering in evaluating ED, but the impact on pricing and socioeconomic diversity is the focus of much public concern. The evidence presented in this analysis indicates no association between greater use of ED and college revenue or the share of enrolled students from lower-income families.
Related Content


Author

Appendix

-
Footnotes
- More broadly, these colleges construct an entire class of entering students to fulfill several (sometimes competing) goals, including academic qualifications, interests, personal backgrounds, and other institutional priorities.
- Technically, a small number of colleges have need-blind admissions policies in which admissions decisions are made based on students’ applications independent of their ability to pay. There is still a budget line for student revenue, but hitting the student revenue target is not mandated each year. Even at these institutions, though, missing those targets consistently would cause budgetary problems.
- Using the publicly available data is a cumbersome process. They are available in the form of electronic documents (typically in PDF format) posted on college websites with spotty historical coverage. Identifying these data across institutions requires manually searching those web pages, determining what colleges have posted these data in which years, locating the specific desired data on the form, and entering them by hand. Automated tools to scrape these data are complicated by differences in the format across reports at different schools.
- I am grateful for communications with James Murphy, the author of this study, who provided details regarding his use of the data.
- Those excluded represent one public institution (William & Mary; few public institutions use ED), one institution that does not participate in the federal financial aid system (Grove City College), one highly specialized technical college (University of Health Sciences and Pharmacy in St. Louis), and four institutions that have had documented extreme financial difficulties at some point in this window (Champlain College, Muhlenberg College, Queens University of Charlotte, and Sweet Briar College). This last group is likely to have adopted ED in response to their financial difficulties, generating a link in reverse of the one we seek to understand.
- These statistics treat all institutions equally. If they are weighted by freshmen enrollment, the analogous values would be 35% and 54%.
- For each institution/year, these data contain the cost of attendance (“sticker price”), which reflects the amount paid by students who receive no grant-based aid, and the average net price paid by first-time, full-time students who received any form of grant-based aid. The average freshman price is the average of these amounts weighted by the percentage of students receiving any form of grant-based aid, which is also available in these data.
- Determining the relationship between family income and Pell Grant eligibility is complicated by program rules. As a rough approximation, students with family incomes below $60,000 and limited assets were eligible for a Pell Grant over this period. This translates to roughly the 40th percentile of the income distribution in 2023.
- Average revenue is equivalent to average net price paid by all students. IPEDS data reports average net price statistics just for students who receive federal financial aid.
- The IPEDS data contains the average net price paid by students in the following income categories: $0-$30,000, $30,001 to $48,000, $48,001 to $75,000, $75,000 to $110,000, and above $110,000. There are limitations to these data, though. They are particularly problematic for comparing outcomes over time since the income cut-offs are fixed in nominal dollars, changing the composition of families in each income band as price levels change.
The Brookings Institution is committed to quality, independence, and impact.
We are supported by a diverse array of funders. In line with our values and policies, each Brookings publication represents the sole views of its author(s).