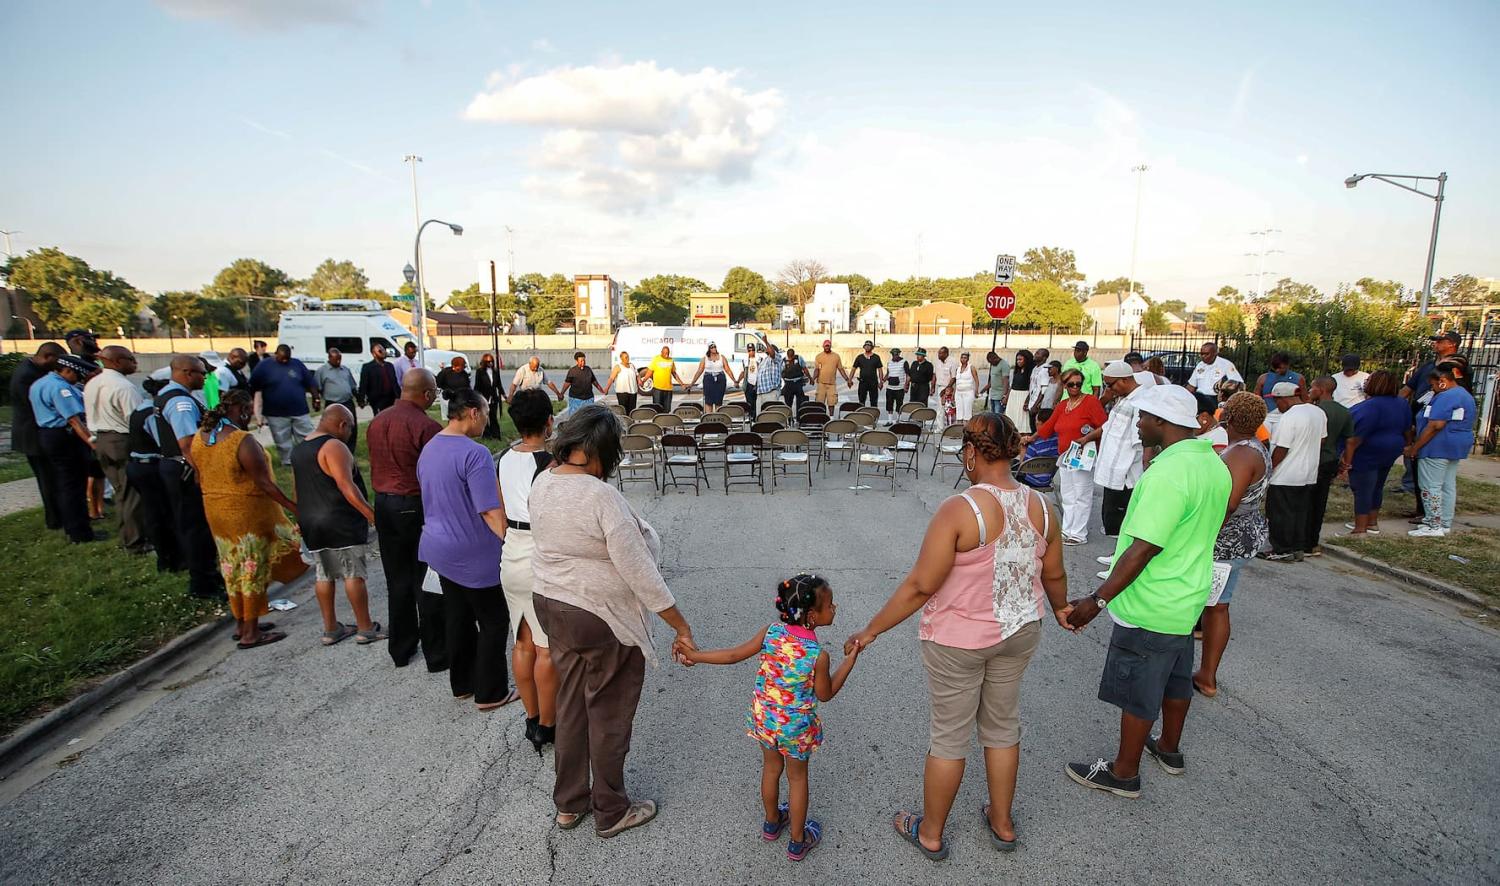
This work is part of the People, Policy, and Police, a project that sheds light on how policing influences public safety and community health. We highlight the work of various stakeholders in these cities and the police reform legislation needed to make effective and lasting policy changes.
In 2020, following the murder of George Floyd in Minneapolis, Minnesota, at the hands of former police officer Derek Chauvin and three other now former officers, the George Floyd Justice in Policing Act was passed by the U.S. House of Representatives. However, the legislation never received a vote in the U.S. Senate. Though Democrats and Republicans agreed on a large portion of the legislation, they hit a stalemate on qualified immunity. Some police reform and accountability advocates shifted back to the local level. Minneapolis entered into a police reform agreement with the Minnesota Department of Human Rights. Minnesota Governor Tim Walz appeared to support police reform, but Democrats in the state believed the legislation did not go far enough, while Republicans felt the legislation went too far.
In January 2023, Tyre Nichols was murdered by police officers in Memphis, Tennessee. Similar to the Floyd murder, police officers were fired and convicted of criminal charges. Once again, police reform advocates and community members demanded changes to improve police accountability. The city of Memphis enacted a series of laws to enhance police accountability, including ordinances aimed at limiting pretextual traffic stops—named in honor of Tyre Nichols—and increasing transparency by requiring data collection on the individuals stopped and the locations of these incidents.
Different from Governor Waltz, Tennessee Governor Bill Lee signed a bill blocking cities in the state from implementing some police reforms, essentially making the Memphis laws noted above ineffective. As our data show below, Tennessee has enacted more “pro-policing” legislation compared to Minnesota and also has a higher rate of police-involved fatalities.
Tennessee and Minnesota are just two examples of states that have drawn public attention for their policing practices. To provide greater insights into how individual states compare, we created a State-level Policing Legislation Database. This resource is designed to assist researchers, policymakers, and community members by compiling data from a range of governmental, nongovernmental, and nonprofit organizations. Below, we outline the categories represented in the maps.
State-level demographic data were collected using the U.S. Census Bureau’s QuickFacts tool, which provides 2023 statistics for all states and counties. QuickFacts data are drawn from multiple sources, including Population Estimates, the American Community Survey, the Census of Population and Housing, the Current Population Survey, Small Area Health Insurance Estimates, Small Area Income and Poverty Estimates, State and County Housing Unit Estimates, County Business Patterns, Non-employer Statistics, the Economic Census, the Survey of Business Owners, and Building Permits.
Data on the number of citizens killed by police were gathered through the Mapping Police Violence project, a 501(c)(3) organization widely regarded as providing the most comprehensive and current information on police violence.
Data on the stability of state legislative control were obtained from Ballotpedia, a nonpartisan 501(c)(3) nonprofit organization that provides comprehensive information on U.S. elections, politics, and policy. To assess the stability of party control within each state legislature, a stability ratio was calculated for a 10-year period (from 2014 to 2023). This ratio represents the total number of years the current governing party (as of 2024) maintained control of either legislative chamber, scaled to a maximum of 10 years per chamber. For instance, in Pennsylvania, the Republican Party controlled the Senate for all 10 years and the House for nine out of 10 years, resulting in a stability score of 19/20. Nebraska, which has a unicameral legislature, was the only state excluded due to the absence of party control data.
Data on average annual salaries of state legislators were sourced from the National Conference of State Legislatures (NCSL), a nonpartisan association of current state legislators representing U.S. states, territories, and commonwealths. Using the NCSL’s 2024 annual compensation report, the data were analyzed to assess whether legislative resources were associated with the number of police reform bills proposed and enacted.
Legislation was examined using the NCSL Policing Legislation Database, which tracks law enforcement-related topics such as accountability and oversight, employment policies, and standards. This database includes all legislation introduced since May 2020 and is updated monthly by NCSL staff as new legislation is identified.
Legislation is categorized as policing protections or policing reforms.
- Legislation was labeled as protective if it:
- Increased appropriations or instituted new grant programs;
- Limited oversight capabilities;
- Limited liability or increased protections for officers accused of misconduct;
- Imposed harsher penalties on citizens for crimes against police;
- Imposed harsher penalties for participation in protest activities;
- Created exemptions or exceptions to training standards or reform bills;
- Expanded the size of the police force;
- Expanded the powers of police to arrest or detain; or
- Increased resources for individual officers.
- Legislation was labeled as reformatory if it:
- Imposed new or enhanced standards on training or hiring;
- Increased oversight or enhanced accountability;
- Banned or limited institutional practices, officer tactics, or use of invasive technology; or
- Implemented technology to increase transparency.
The maps show the total number of police killings per state as well as the number of police killings per one million residents. The demographics of each state are also shown by hovering over each state. The next map shows the number of bills enacted, pro-police legislation, stability of party control over state legislatures, and annual salaries of elected officials. The map shows huge variations in the percentage of bills enacted. For example, while the state of New York enacted less than 3% of the bills proposed, Colorado enacted nearly 80% of its bills despite both states having similar levels of legislative stability.
Overall, the findings presented here highlight notable trends in state-level legislative activity across the United States. Some states propose a high volume of bills but enact only a small fraction, whereas others propose fewer bills yet achieve much higher rates of passage. Nationally, the number of people killed by police has consistently exceeded 1,000 per year, but significant state-by-state variations exist—from over 10 deaths per million residents in New Mexico to fewer than one per million in Rhode Island. As our database continues to be utilized and referenced, we look forward to collaborating with stakeholders to generate deeper policy insights. Our focus extends beyond the passage of legislation to include its implementation, with plans to develop a state-level scorecard to facilitate comparisons and drive meaningful reforms.
-
Acknowledgements and disclosures
We acknowledge the Carnegie Corporation for support of this work. We thank Adelle Patten for the design of the database. We also thank additional research and communications staff of The Brookings Institution for assistance with this project.
The Brookings Institution is committed to quality, independence, and impact.
We are supported by a diverse array of funders. In line with our values and policies, each Brookings publication represents the sole views of its author(s).


