
This post was updated on April 7, 2023 with a correction for Figure 2A.
Chicago’s recent mayoral primary—in which “tough-on-crime” candidate Paul Vallas beat incumbent Lori Lightfoot to advance to an unprecedented runoff—divided many on the left and prompted some to declare the election as a new referendum on the politics of crime. Indeed, Chicago is far from the only U.S. city where crime is dominating local politics, with mayoral races from Denver to Philadelphia to Akron, Ohio all consumed by issues of public safety.
While stoking fears of crime is an age-old American election tactic, something feels different about its salience in the pandemic-era landscape. Faced with slow-recovering urban cores and predictions of an “urban doom loop,” many pundits and urban observers are returning to a playbook not fully deployed since the 1990s—pointing to public safety as the primary cause of a host of complex and interconnected issues, from office closures to public transit budget shortfalls to the broader decline of center cities. For some younger urban residents, this may be their first time living through this discourse, causing them to shift their behaviors—from where they spend their money to which neighborhoods they travel to and who they vote for.
Whether or not crime actually is up in central city business districts, widespread fear of crime—driven in no small part by relentless media coverage—certainly is. This is forcing urban leaders to simultaneously confront rising public safety concerns while grappling with the numerous economic, social, and civic aftershocks of an enormously disruptive three years. Unfortunately, many of these aftershocks—such as emptier streets and vacant storefronts—are the very same issues that negatively impact perceptions of safety in the first place.
As local leaders seek to rebuild safe and vibrant downtowns, they must do so without letting the perceptions and politics of crime drive policy and practice. This research brief aims to equip leaders with the evidence to do just that by: 1) presenting findings from nearly 100 interviews in four large U.S. cities (New York, Chicago, Seattle, and Philadelphia) on perceptions of crime; 2) providing spatial analysis of the geography of crime within these four cities; and 3) offering place-specific, forward-looking policy and practice solutions to chart a future in which all residents can feel—and actually be—safe regardless of where they live and work.
Brookings Metro’s Future of Downtowns project: This report is part of a larger mixed-methods research project that seeks to understand the future of American urban cores through interviews, spatial data analysis, and direct engagement with local leaders in New York, Chicago, Seattle, and Philadelphia. To gauge perceptions of cities’ downtown1 health and recovery, we interviewed nearly 100 business leaders, major employers, public sector officials, and residents in fall 2022,2 then juxtaposed qualitative findings with spatial analysis of population, employment, travel, real estate, crime,3 and homelessness4 data impacting downtown recovery. This brief synthesizes findings related to crime and safety, while future publications will focus on different structural issues influencing American cities as they seek to recover from the economic, social, fiscal, and civic effects of the COVID-19 pandemic and associated disruptions.5
Perceptions of rising crime are impacting downtown recovery
When we began qualitative interviews for this project in the fall of 2022, we expected to hear comments mirroring the think pieces of the day—something like, “The office is dead and downtowns are being held back by workers’ growing desire for flexible, remote work.” What we found instead is that residents and public and private sector leaders overwhelmingly pointed to another challenge they believed was preventing the recovery of center cities: fear of rising crime and a general sense of “disorder” compromising previously “safe” areas of their cities. Five key themes emerged from these conversations:
- Respondents overwhelmingly pointed to crime—not the desire for flexible work arrangements—as the top barrier preventing workers’ return to office. Across all four cities, the vast majority of residents, major employers, property owners, small business owners, and other stakeholders reported rising rates of violent crime and property crime downtown and indicators of “disorder” (such as public drug use) as the top barriers stopping workers from coming back to the office—and thus impeding downtown recovery.
“Safety, security, substance use, and mental health—just the experience in public areas—are the number-one issues preventing return-to-office.” — Seattle
In New York and Philadelphia, in particular, respondents cited several recent high-profile incidents of violence that occurred downtown as exacerbating factors (which, in New York, also may have been influenced by exponential increases in media coverage of crime in tourist hubs and subway stations). In both cities, such incidents can become conflated in the media as an inherent aspect of the “urban doom loop” threatening city recovery.
“People are scared. They’re afraid to walk on the streets. A woman on the first day of [return-to-office] got punched to the ground on the way to work across the street from our campus.” — Philadelphia
- Respondents also reported unsafe conditions on public transit as preventing workers and visitors from commuting downtown. Almost as often as stakeholders cited crime and a sense of disorder in downtowns as barriers to returning to the office, they described safety issues on public transit as hindering downtown commutes.
“Now it’s back to 1990s, it’s just mayhem on the train right now. Nobody wants to take it…It’s lawlessness on the train, and the buses are better, but the train is how most people got around. It’s the thing that connects the outside neighborhoods to Center City.”
— Philadelphia
While much of this concern was related to fear of violent crime on transit, people also commonly discussed other forms of criminalized and generally unwelcome activity, such as drug use and public urination. Such perceptions of disorder had a significant impact on residents’ sense of safety.
“Commuting on the Red Line, Blue Line, etc. is an experience that’s completely deteriorated. It’s drug use, smoking, and worse.”
— Chicago
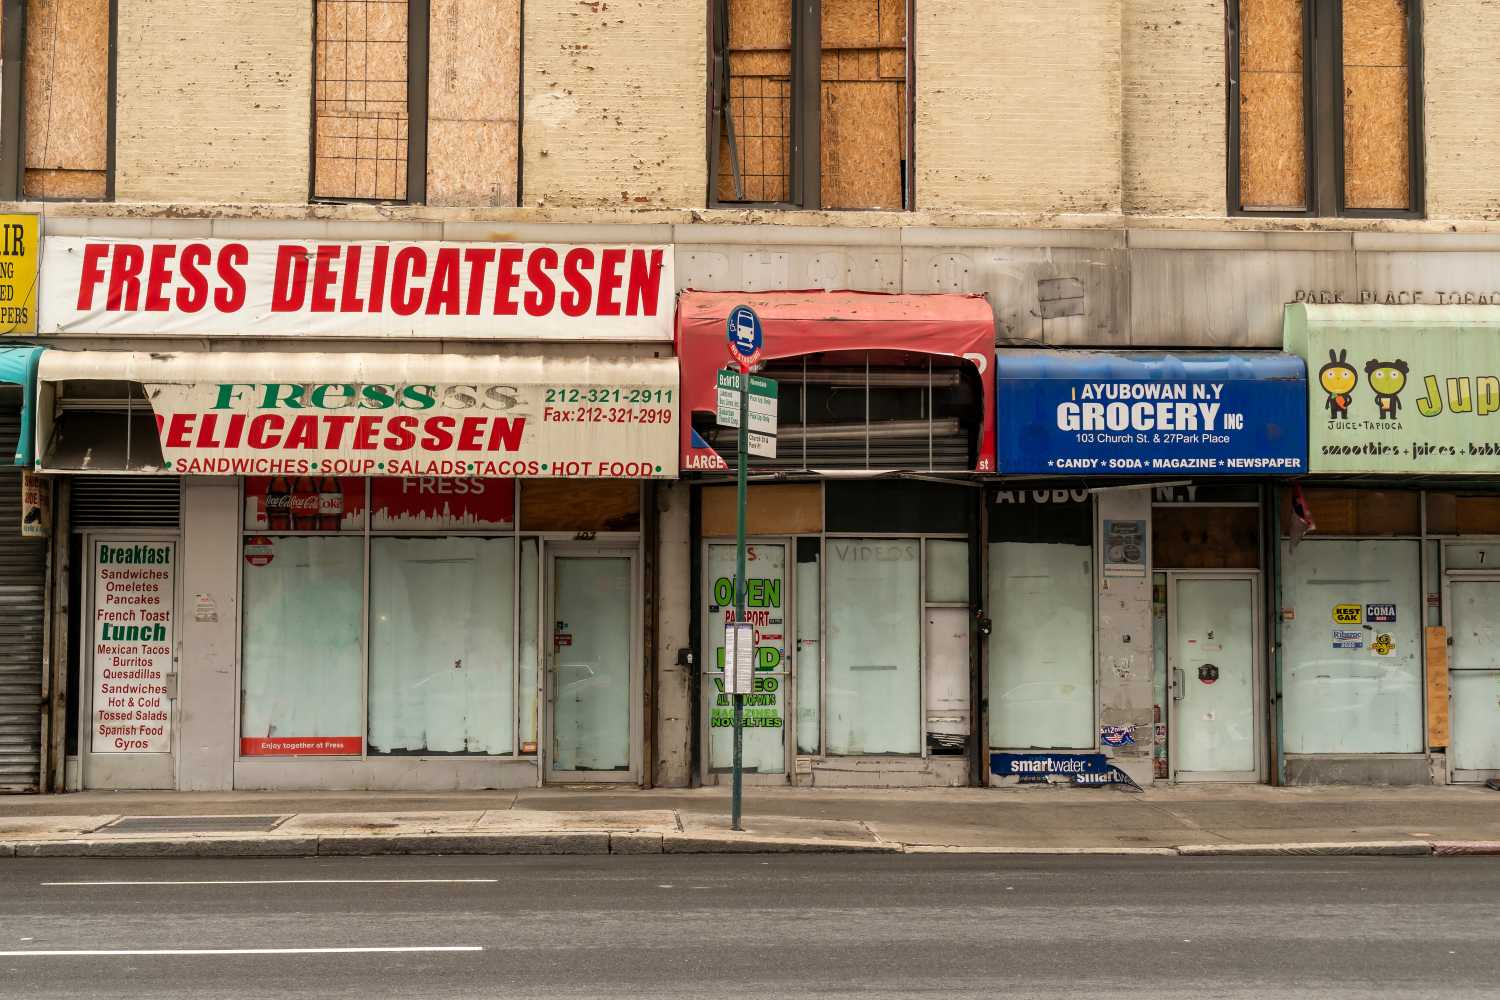
- Small business owners and major retailers alike described increased property crime downtown as a major barrier to keeping their business open. From small mom-and-pops to major retailers, business owners reported higher costs for private security, reduced foot traffic, and increased theft as significant barriers to remaining open.
“There’s no question: The crime that’s gone up in this neighborhood is burglary, larceny. It’s all stealing. You can’t buy half-and-half anymore, it’s locked. You have to get an assistant to get half-and-half. Everything’s locked up.” — New York City
In many cases, stakeholders reported that this created a negative feedback loop in which businesses closed due to safety concerns for their workers, reducing foot traffic further and contributing to a greater sense of fear downtown.
“A lot of the stores have closed because they’re in places where people were congregating in ways that made other people feel unsafe. And so, they lost their customers and reopening is hugely burdensome because you can’t get anyone to come in because they don’t feel safe on that part of the sidewalk…If it’s a block that no one feels safe in, you can’t fix that.” — Seattle
- Residents and business owners in each city’s Chinatown neighborhood reported greater safety concerns than other downtown stakeholders—driven primarily by anti-Asian racism. Stakeholders who lived or operated a business in the Chinatown neighborhood of all four cities reported qualitatively different safety concerns than other downtown stakeholders. In addition to reporting fears of theft and burglary, they also cited concerns of anti-Asian racism and hate that increased during the pandemic—causing many business owners to question whether to remain within their districts and making safety a top concern for Asian residents in all four cities.
“If you ask anyone in Chinatown what their top three issues are, safety would be the first one.” — Chicago
- Respondents varied in their perceptions of the geographic distribution of crime within their cities. Respondents generally took a dichotomous approach to understanding where within their cities crime occurs—often taking a “downtown versus neighborhoods” view of public safety. Many in Chicago and Philadelphia, in particular, reported a perception that crime and conflicts “from the neighborhoods” were expanding into downtown and exacerbating safety issues there. This perception fueled fear among office workers who had previously seen downtown as relatively safe compared to other neighborhoods.
“When we had violence before, it was like, ‘Well, it’s over in that neighborhood. It’s over in that neighborhood.’ And now folks feel like it’s everywhere. ‘It doesn’t matter where I am, something could happen to me.’” — Philadelphia
In contrast, other stakeholders perceived that the attention paid to crime downtown came at the expense of addressing long-standing neighborhood safety concerns.
“If we’re looking at Black and brown communities, they’re not represented in the downtown area. In downtown, we’re looking at affluent communities with higher economic statuses. The focus on [downtown crime] is sensationalized because when something happens in Times Square, there is proximity to the more affluent individuals.” — New York City
The mismatch between perception and realities of crime: New spatial analysis
After completing our interviews, we compared those perceptions with both national and neighborhood crime trends. Hyperlocal crime data reveals a significant mismatch between residents’ perceived understanding of where crime occurs in their city versus its actual spatial distribution. Several themes emerged from our research, which have significant implications for policy and practice.
National and citywide trends only tell one piece of a larger story about violent crime—but can have an outsized impact. Respondents’ overall perceptions of rising crime were not wholly unfounded, but they tended to reflect national and citywide crime rhetoric and sensationalized media coverage rather than an understanding of where and how crime actually occurs within their cities.
For instance, the national murder rate increased by nearly 30% between 2019 and 2020, driven predominantly by gun murders (Table 1). Cities and towns of all sizes saw their murder rates increase as well, rising over 35% in cities with populations over 250,000; 40% percent in cities with populations of 100,000 to 250,000; and around 25% in cities with populations under 25,000. At the end of 2022, analysis from the Council on Criminal Justice found that the national murder rate was 34% higher than it was in 2019, but half of its historic peak in 1991.6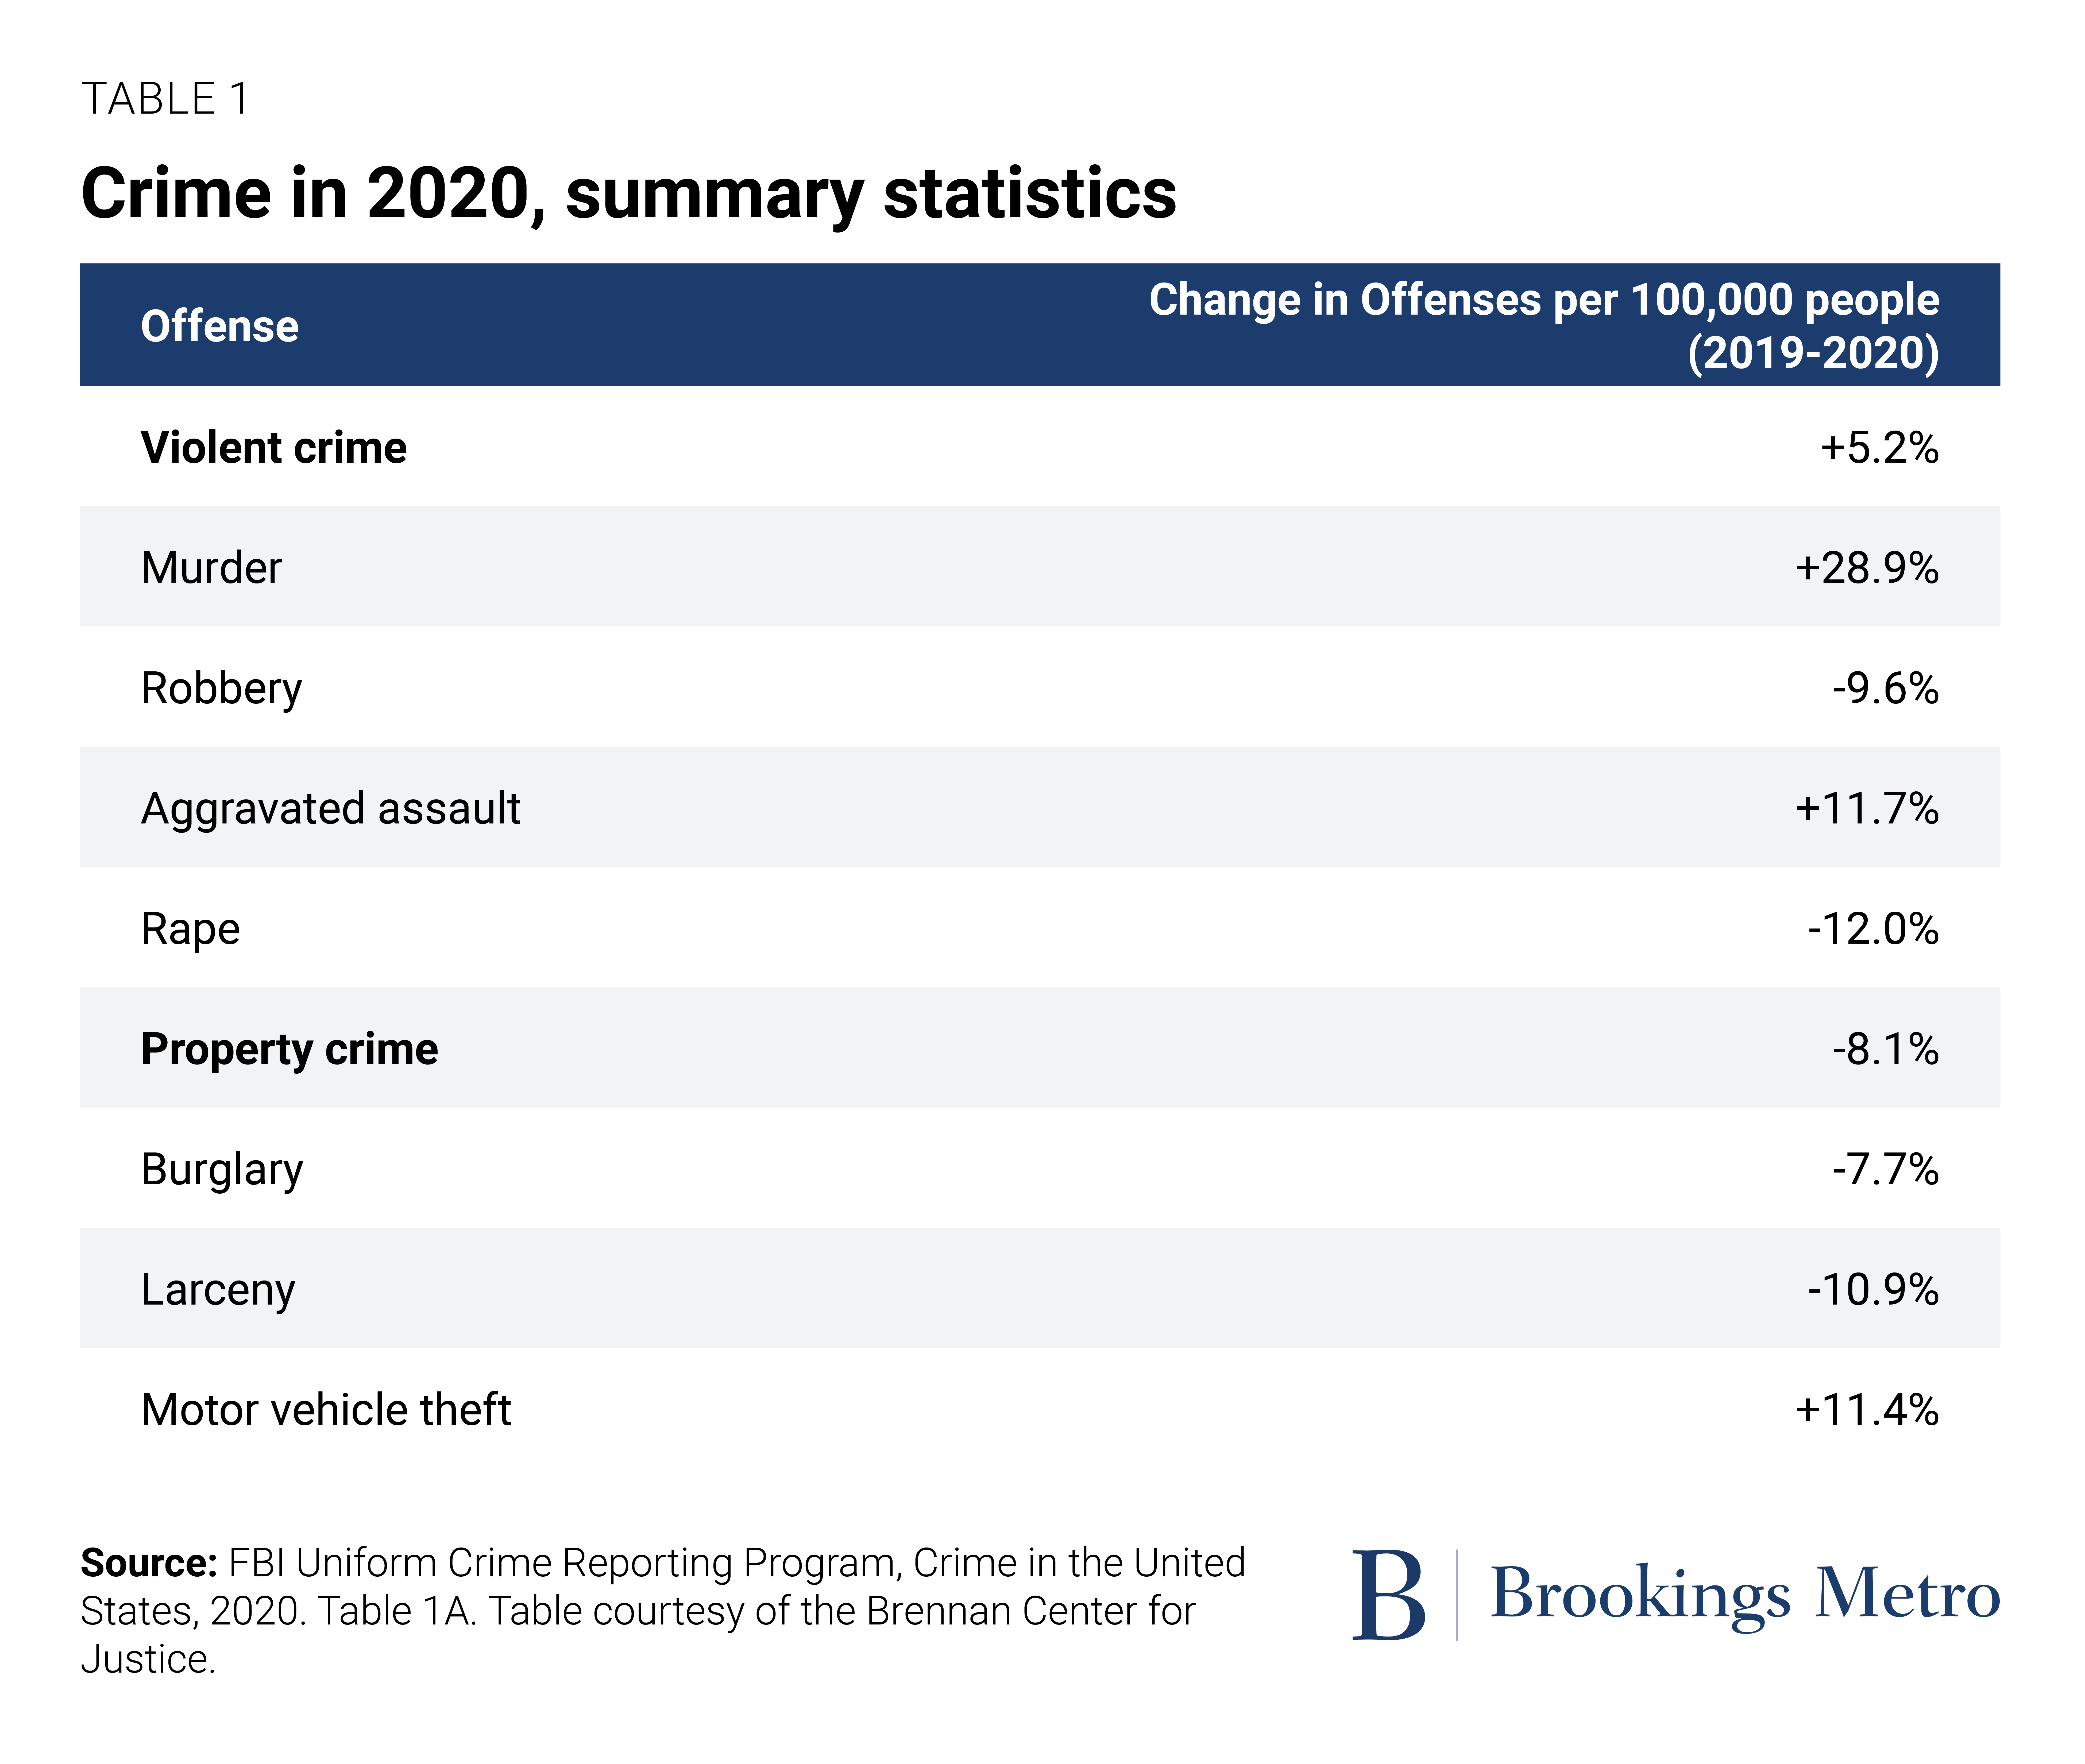
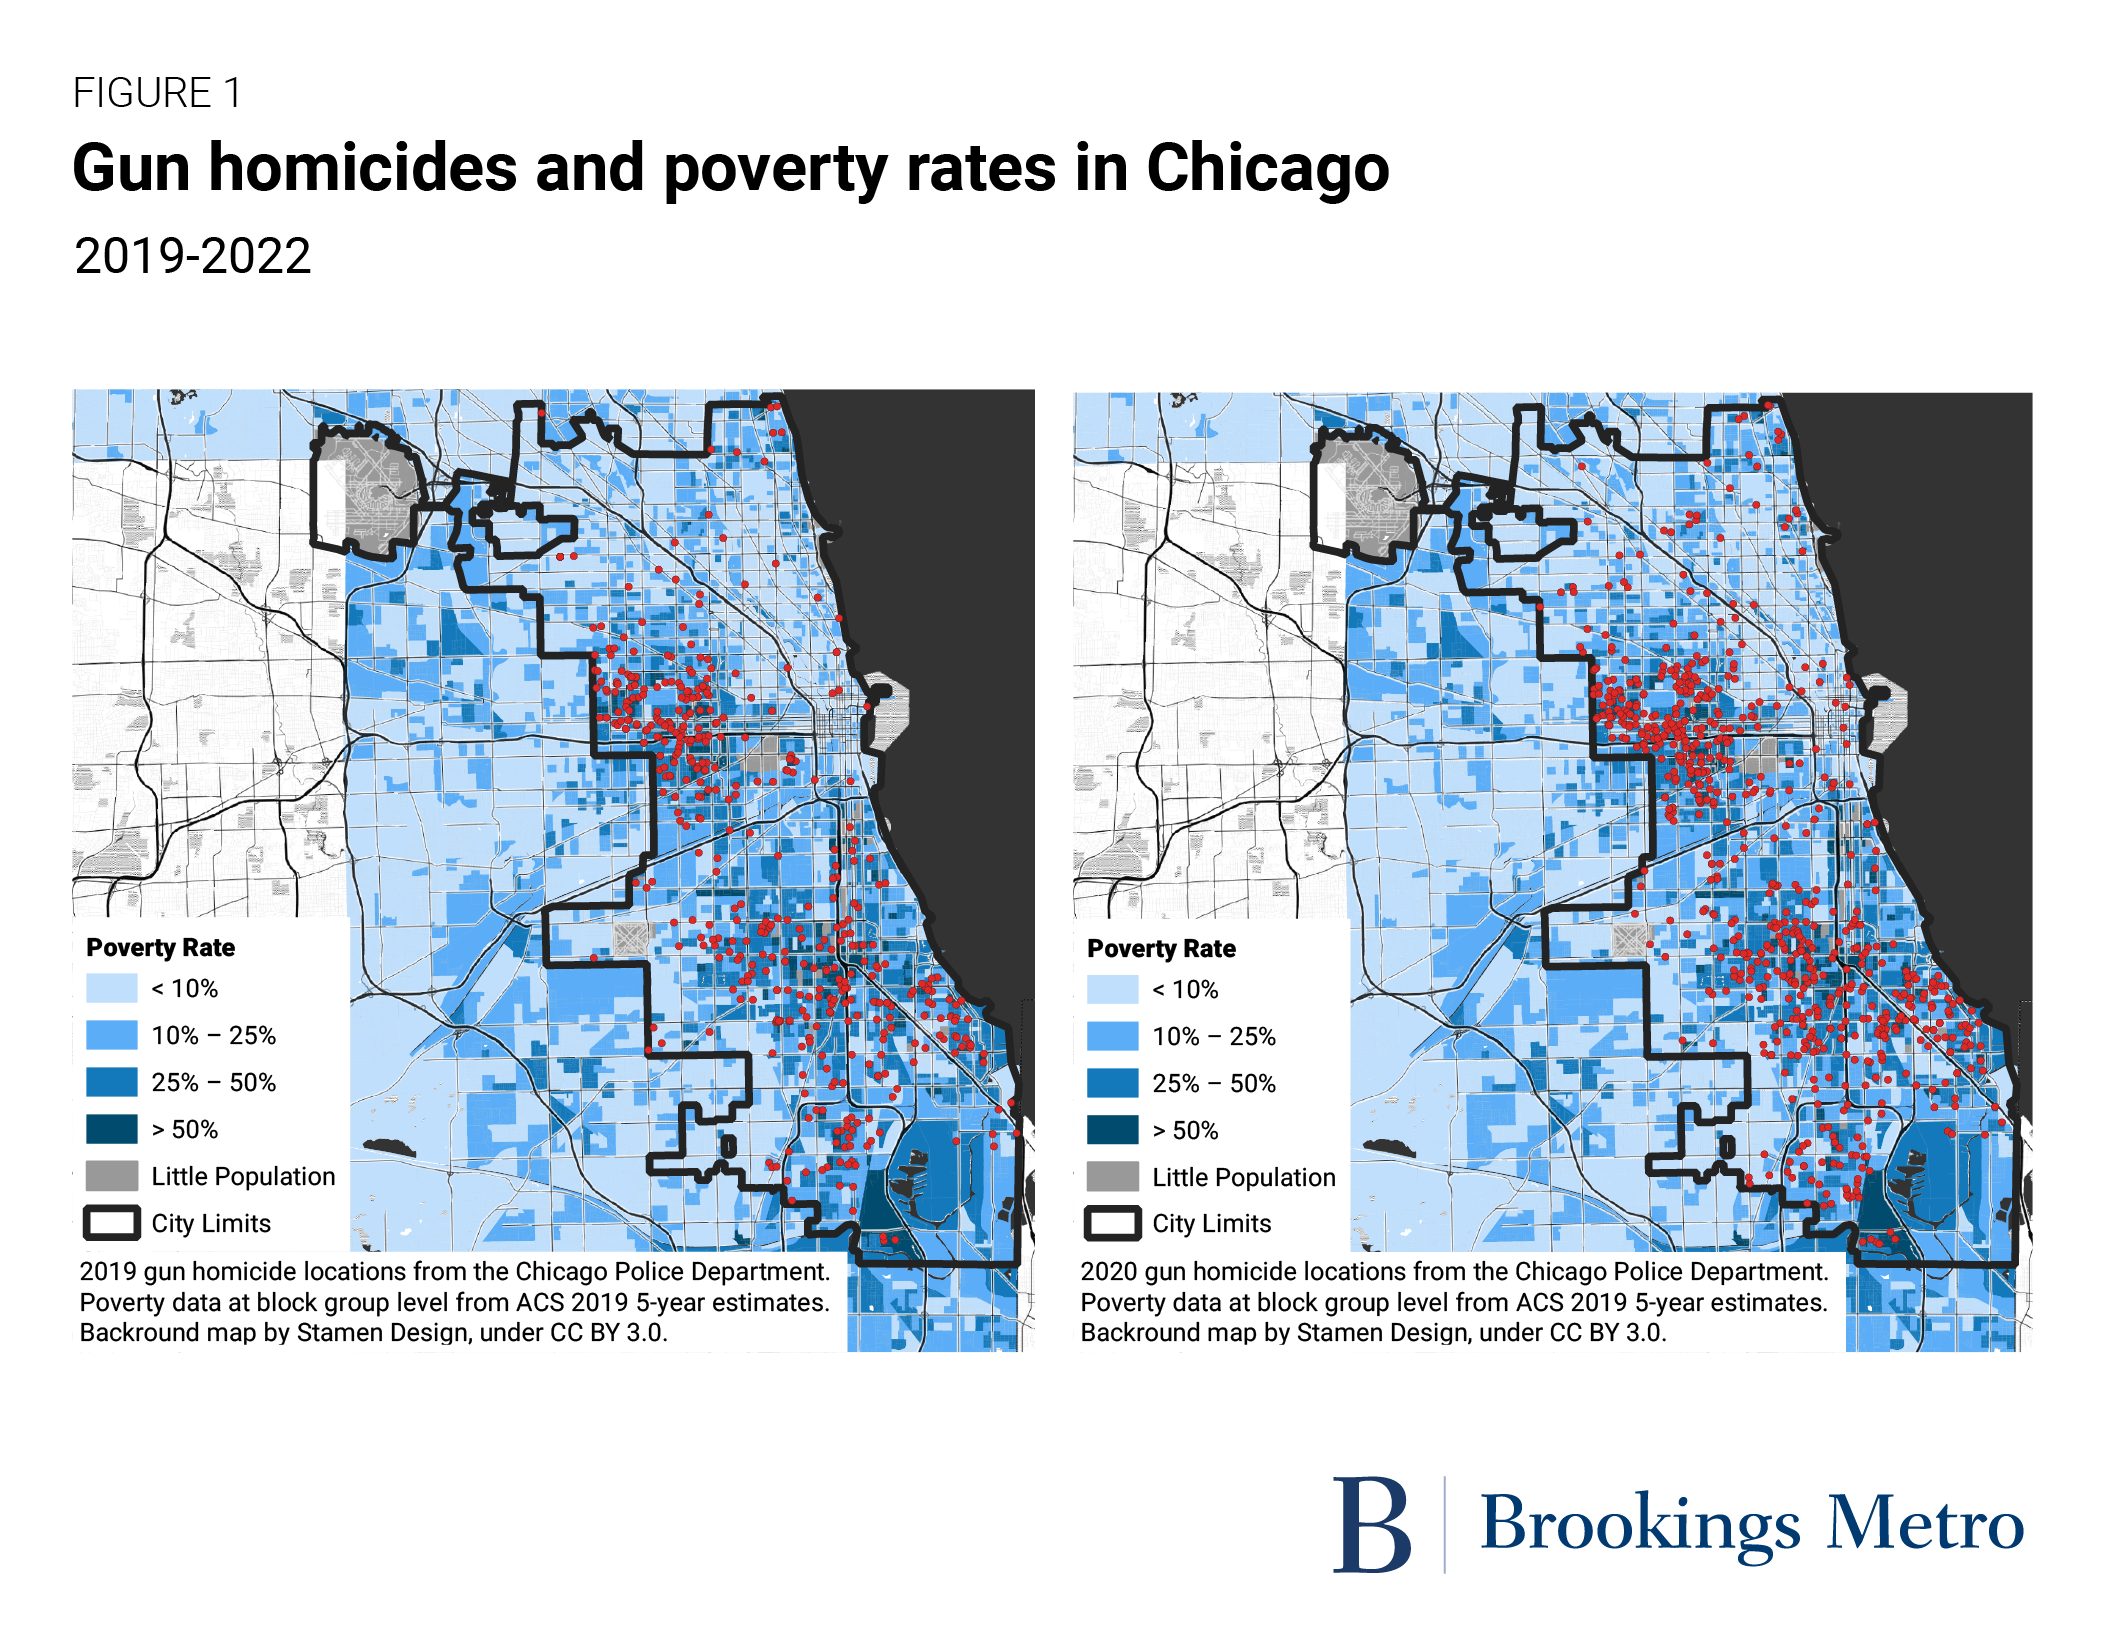
But after looking more granularly at this pandemic-era increase in murders within cities, it becomes clear that its toll was not distributed evenly. Instead, increases in homicides were largely concentrated in disadvantaged neighborhoods that already had high rates of gun violence, along with significant histories of public and private sector disinvestment.
Figure 1 demonstrates these trends in Chicago. Overall, homicides there increased by 55% between 2019 and 2020 (driven by increases in gun homicides). But increases in gun homicides were concentrated in neighborhoods in the West Side (including Humboldt Park, Austin, West and East Garfield Park, and North Lawndale) and the South and Southwest Sides—all areas of the city with histories of segregation and disinvestment as well as significant contemporary socioeconomic inequities. This spatial concentration of pandemic-era homicides in disinvested neighborhoods took place in all 16 cities in which it has been studied, including three of our four study cities: Chicago, Philadelphia, and Seattle.
Local data on property and violent crimes shows that in New York, Philadelphia, and Chicago, downtowns are some of the safest places to be. Interview respondents were not only afraid of violence downtown. They also spoke to a significant perceived increase in property crimes such as retail theft, motor vehicle thefts, and robberies. Nationally, evidence would seem to bear this out, as robberies increased by 5.5%, nonresidential burglaries by 11%, larcenies by 8%, and motor vehicle thefts by 21% nationwide between 2021 and 2022.
However, when we looked at hyperlocal data,7 we identified three primary findings related to property and violent crime downtown that defied these larger trends:
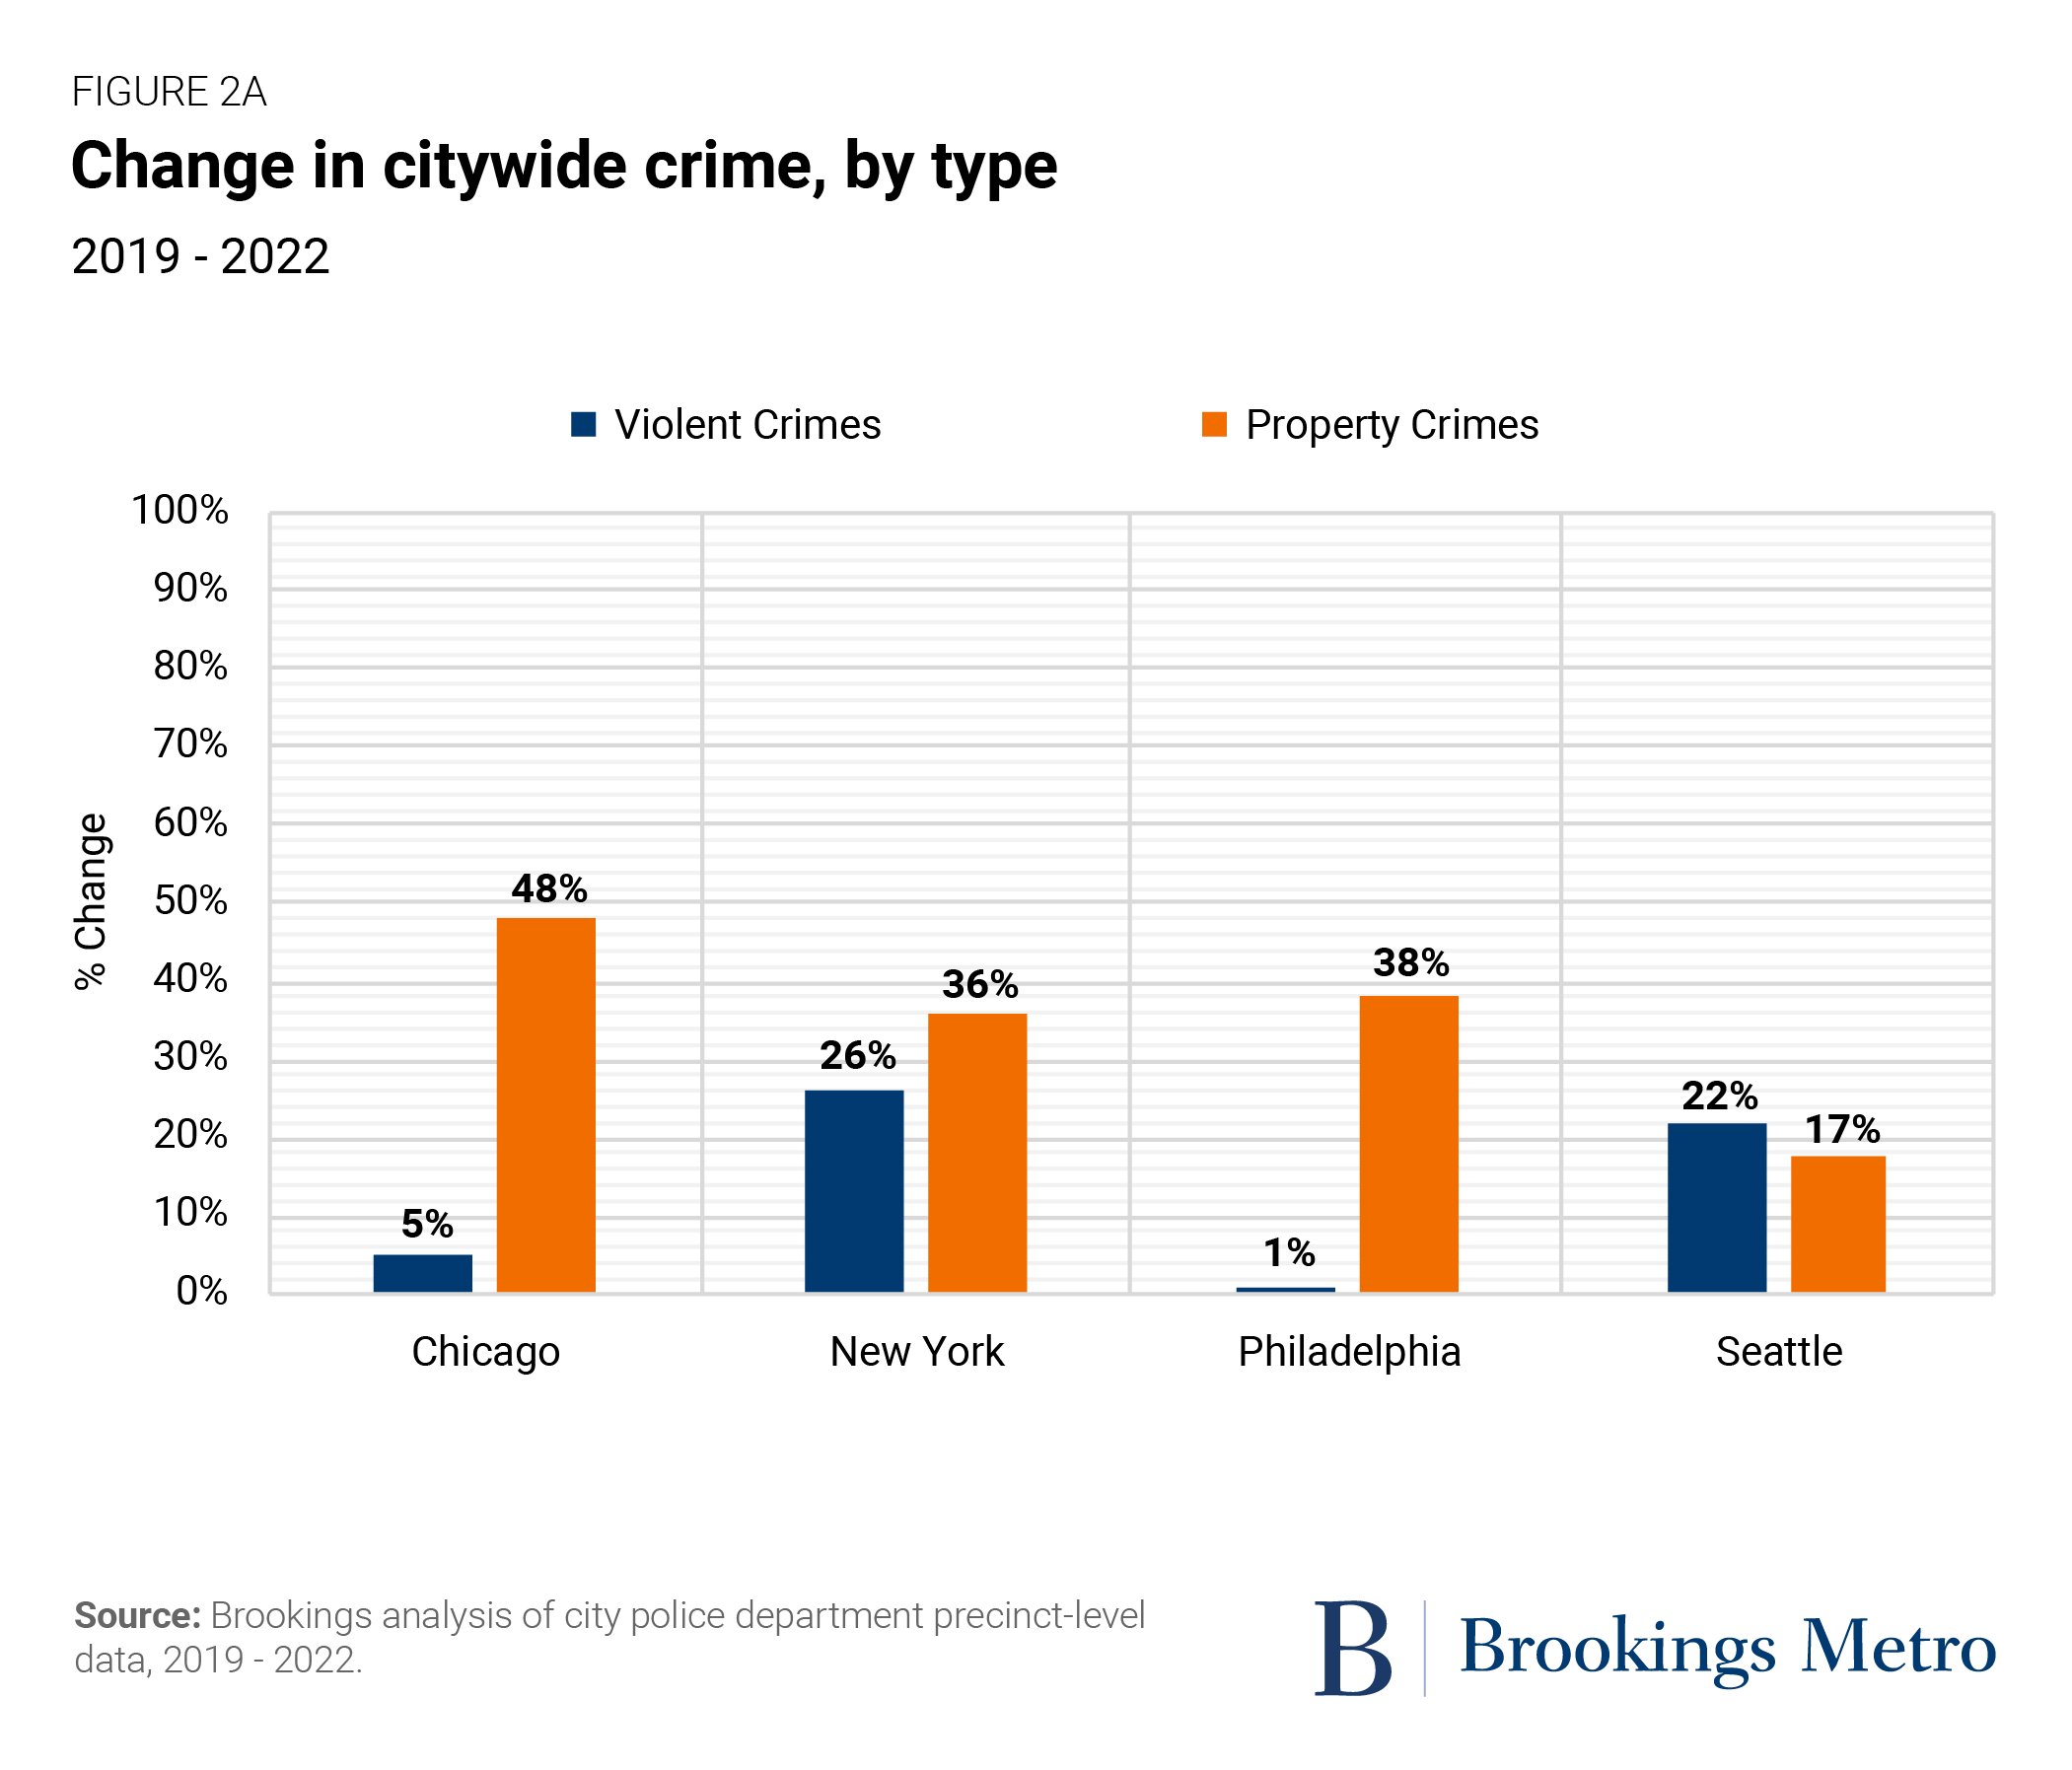
Citywide crime increased between 2019 and 2022, driven primarily by property crimes—but downtowns accounted for a very small share of these increases.
As shown in Figure 2a, between 2019 and 2022, there was a 48% increase in property crimes in Chicago; a 38% increase in Philadelphia; a 36% increase in New York; and a 17% increase in Seattle. For violent crime, there was a 5% increase in Chicago; 1% increase in Philadelphia; 26% increase in New York; and a 22% increase in Seattle.
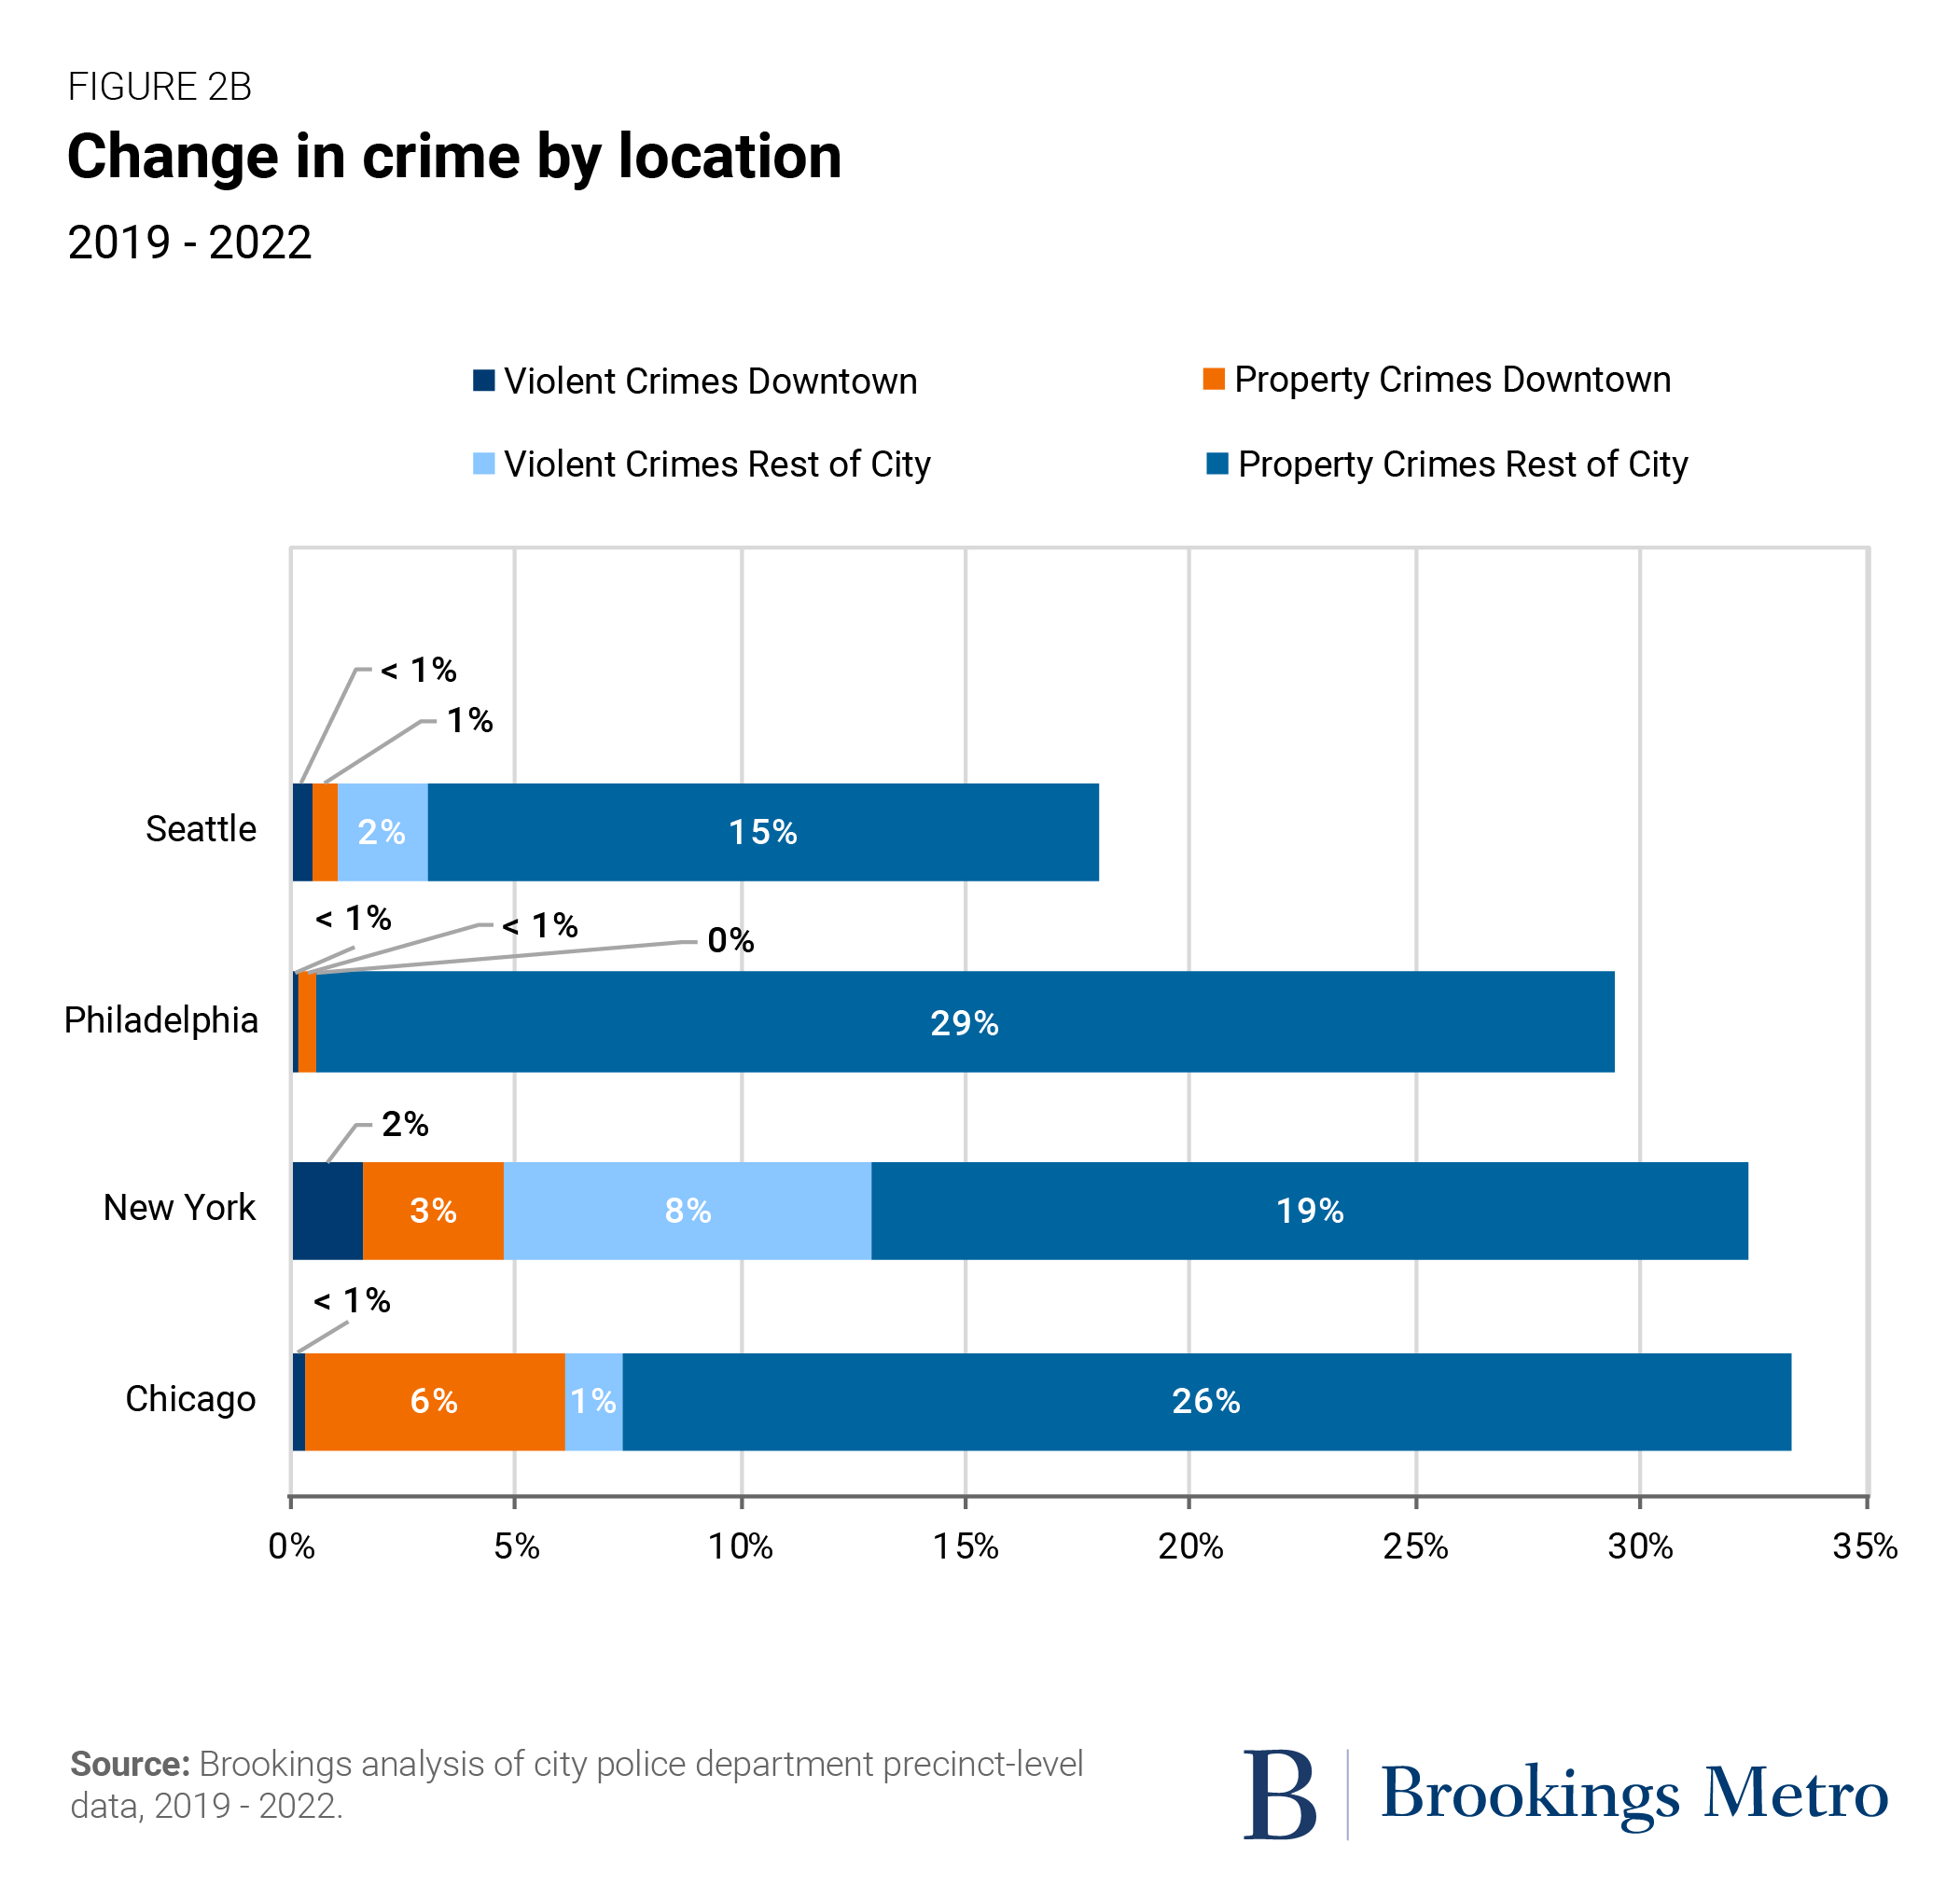
However, as shown in Figure 2b, downtown Chicago accounted for just 6% of the citywide increase in property crime and less than 1% of the citywide increase in violent crime. Manhattan’s core drove 3% of the citywide increase in property crime and 2% of the increase in violent crime. Downtown Seattle accounted for less than 1% of the city’s increase in violent crime and 1% of the increase in property crime. And Center City Philadelphia accounted for less than 1% of the increase in both categories.
The share of all crimes happening downtown remained stable between 2019 and 2022—and in a few cases declined.
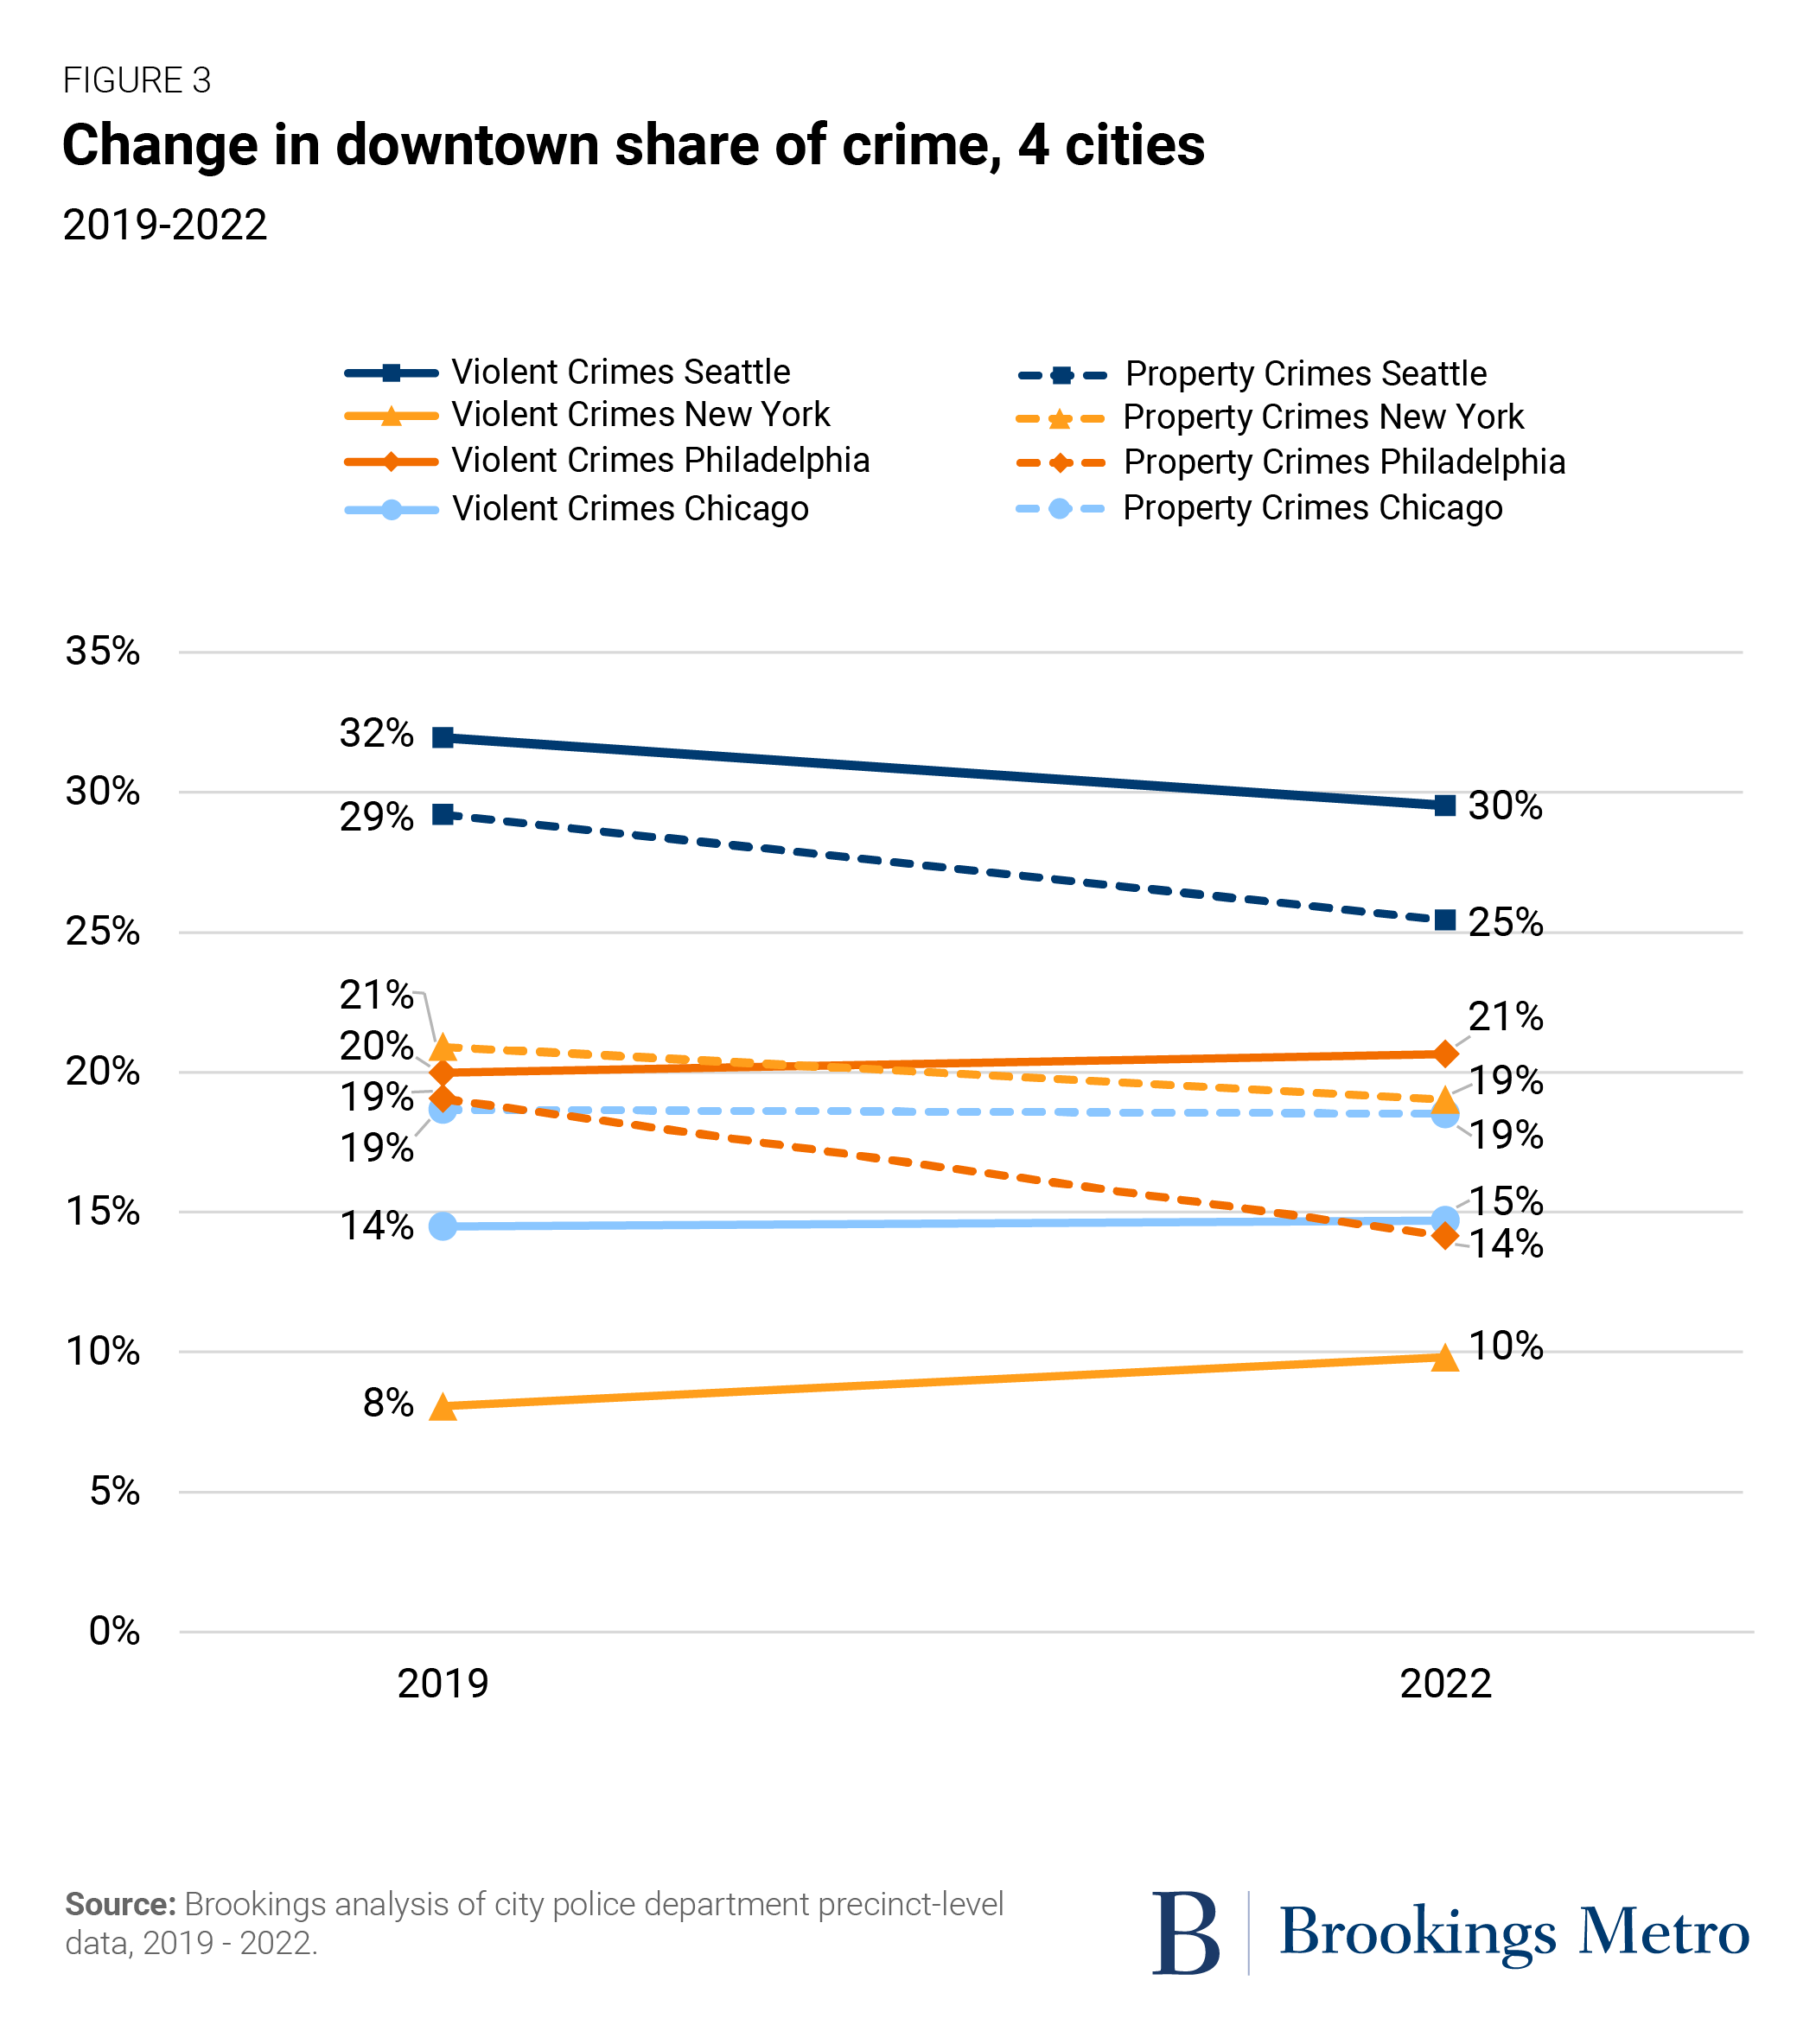
Another way to understand how crime may impact downtown recovery is to identify whether the share of citywide crimes occurring downtown increased during the pandemic. As Figure 3 demonstrates, our analysis found that across cities, the share of crimes that occur downtown has remained relatively stable since the onset of the pandemic, and actually declined in Seattle (for both property and violent crime), New York (property crime only), and Philadelphia (property crime only). That being said, there is wide variation across cohort cities in the share of crimes that occur downtown, with Seattle (despite declines) seeing the greatest share of both violent and property crimes occurring in its downtown.
While the share of violent crimes occurring downtowns remained stable, small increases from a low baseline can seem more significant than they are.
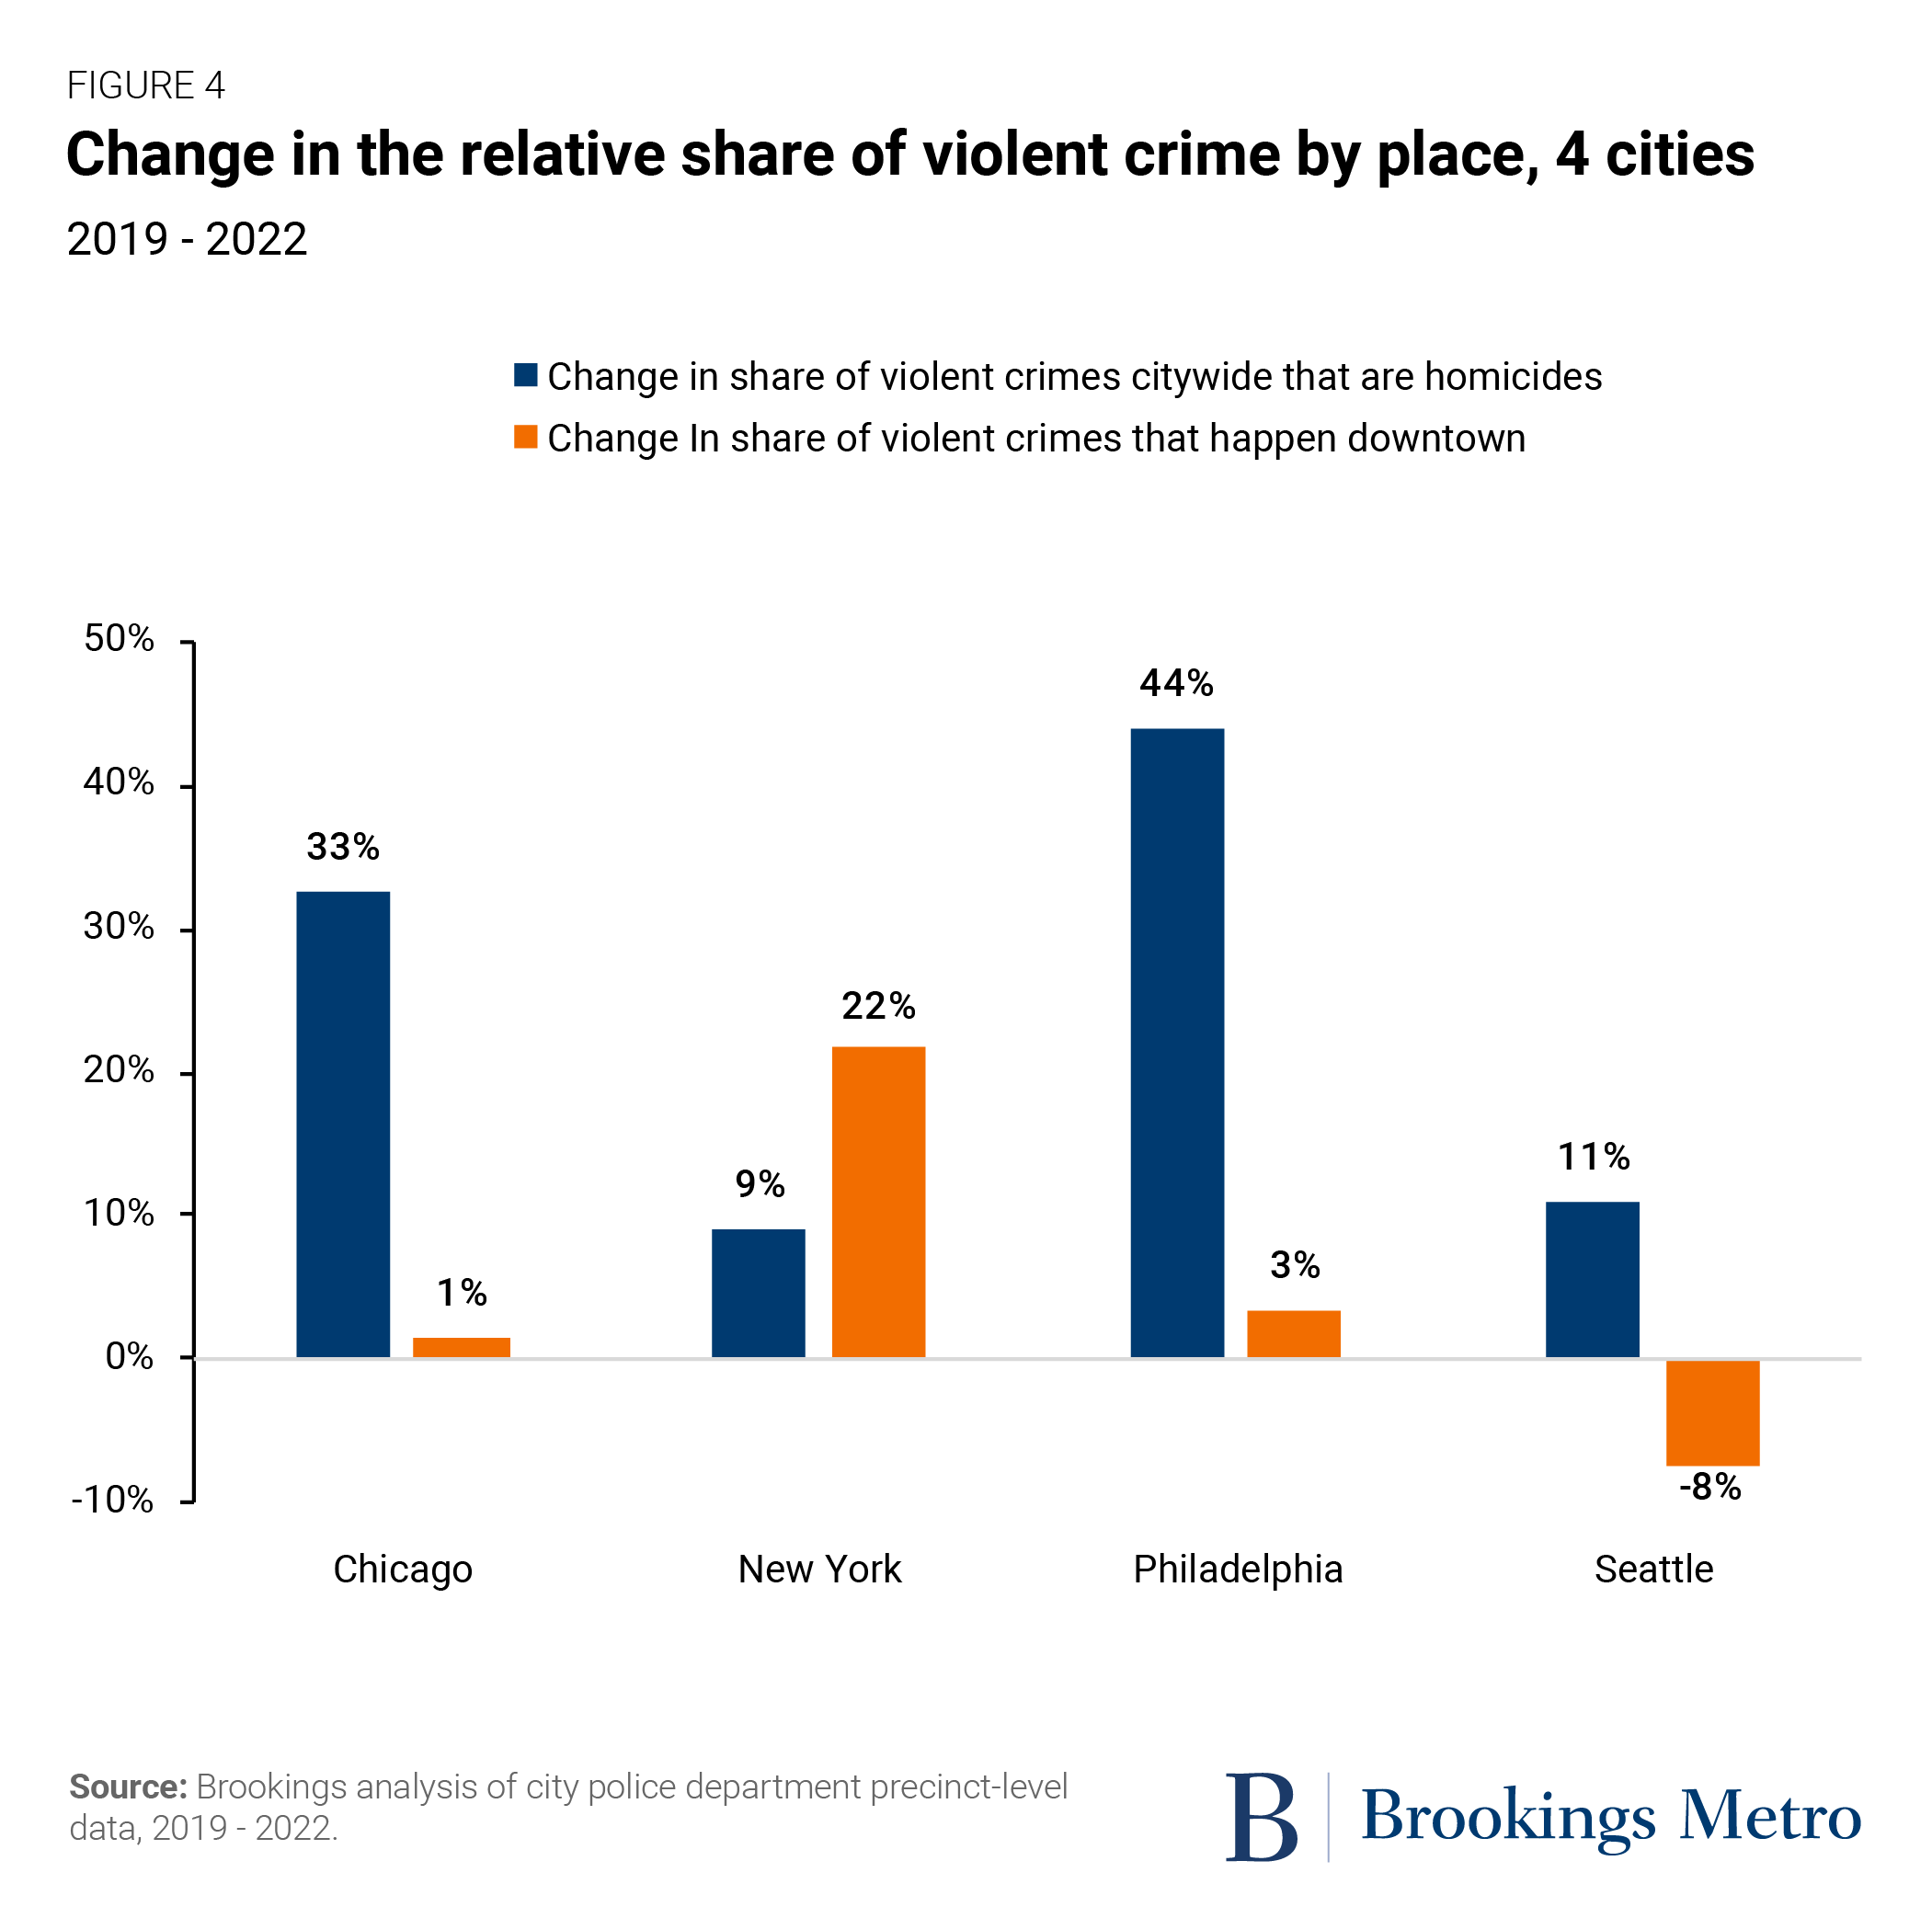
Mirroring nationwide trends, the share of violent crimes that are homicides increased significantly in all four cohort cities between 2019 and 2022—rising 44% in Philadelphia, 33% in Chicago, 11% in Seattle, and 9% in New York (Figure 4). As discussed above, the share of violent crimes taking place downtown remained relatively stable in all four cohort cities between 2019 and 2022 (Figure 3).8 In 2019, for example, the share of Seattle’s violent crime occurring downtown was 32%; in 2022, it decreased to 30%. In New York, it went from 8% to 10% during the same period.
Importantly, however, even small changes in the relative share of violent crimes that occur downtown may have an outsized impact on perception. In New York, for instance, the 2% increase in the absolute share of violent crimes that occurred downtown represents a 22% change in the relative share of violent crime occurring downtown (Figure 4). New York’s downtown is still one of the safest places to be in the city (and has the lowest share of violent crime of all four downtowns studied), but its increase from such a low baseline (8% of all citywide violent crime) and extensive media coverage may be having an impact on perception.
Why the geography of crime matters
People deserve to feel—and actually be—safe regardless of where they live and work. Downtowns have experienced significant disruptions since the pandemic that have made workers, visitors, and residents feel uneasy. In particular, our interviews revealed that increased visibility of public drug use, high-profile violent crimes, vacant storefronts, emptier streets, and harassment are making residents feel as though their city is in disarray, and that the government isn’t doing much about it.
Pointing to the mismatch between where crime predominantly clusters and residents’ perceptions is not designed to delegitimize their concerns or deny the impact that crime in other parts of the city can have on perceptions of downtown. Rather, it is to demonstrate that the spatial distribution of crime has real implications for how local leaders can address it.
For instance, an extensive body of evidence demonstrates that targeting investment and interventions in higher-crime communities—in partnership and consultation with residents who actually live in those communities—is one of the most effective solutions for combatting violence. Yet, the voices of those most impacted by violence can be drowned out when the media, politicians, and the public are hyper-focused on crime downtown.
This was seen in the recent Chicago mayoral election, in which the majority of residents living in higher-crime neighborhoods in the South and West sides voted for Lightfoot, while residents of North and Northwest Chicago (including downtown and the Loop) voted for Vallas and his tough-on-crime agenda. This enabled a small geographic part of the city—that if it were a city itself, as Slate pointed out, “would be one of the safest big cities in the country”—to advance a public safety agenda not widely embraced by residents living in the most unsafe parts of the city. Moreover, a laser focus on addressing crime downtown or preventing crime from “spilling over” from the neighborhoods into downtown glosses over the shared fate of downtowns and neighborhoods, and the evidence on what works to promote safety for all residents of a city.
In short, perceptions matter because everyone should be able to feel safe, but also because perceptions can drive policy in a way that can inadvertently make residents less safe.
Toward a shared vision of safety, rooted in data and evidence
When perceptions of crime are misaligned with evidence, local leaders may feel pressure to pursue public safety solutions that are also not supported by evidence—at a significant cost to their constituents. Just in the past year, for instance, politicians in New York and Philadelphia considered returning to the controversial “stop-and-frisk” tactic, which has been found not only to not improve safety outcomes but to engender generational harms on youth of color. Increased emphasis on policing also has budgetary implications; New York, for instance, is exceeding its police overtime budget by nearly $100 million, while at the same time, city officials seek to make cuts to other critical citywide services such as libraries, schools, and government operations.
Rather than allowing perceptions alone to drive decisionmaking, local leaders can—and should—respond to rising fears of crime with evidence-based policies that match where, why, and how crime actually occurs within cities. This does not preclude providing reassurance to a society that has weathered an incredibly turbulent past three years, and in fact can serve a dual purpose of doing just that.
Below, we highlight key recommendations for improving safety and perceptions of safety downtown, with a particular focus on forward-looking investments. Notably, there are many other evidence-based practices that can promote safety tailored for higher-crime neighborhoods (some of which are covered here, but not all).
- Enhance alternative crisis response models for mental and behavioral health emergencies. In most cities and downtowns, police are the default responders for behavioral and mental health crises, which takes time and resources away from their ability to address other more pressing public safety concerns such as violent crime. A growing body of research demonstrates that alternative crisis response models—which send trained, non-police mental health professionals to respond to 911 calls related to homelessness, substance use, and mental health—are both more treatment-effective and cost-effective than traditional police responses. Promising examples include Crisis Assistance Helping Out On The Streets (CAHOOTS) in Oregon, which responded to 17% of all city 911 calls and required police backup in less than 1% of cases in 2019, and has saved taxpayers an average of $8.5 million each year; and Denver’s Support Team Assisted Response (STAR), which has contributed to a 34% drop in low-level crime, with visible results in the downtown area. Seattle and New York are also taking strides to adopt and build out alternative crisis response programs.
- Invest in the built environment. Investments in the built environment—such as revitalizing vacant lots, painting sidewalks, and increasing greenery and street lighting—have been found to significantly reduce crime, and property crime in particular. In Philadelphia, for example, efforts to restore vacant lots reduced gun violence by 29%, burglaries by 22%, and nuisance crimes such as vandalism and noise complaints by 30% in nearby areas, while also significantly reducing perceptions of crime. Some of our study cities are beginning to adopt and scale these solutions. For example, in an effort to curb crime, Chicago has allocated $87 million in federal and bond funding under the Chicago Recovery Plan to turn vacant lots into housing and community spaces such as gardens, playgrounds, and shopping centers.
- Improve transit safety with innovative strategies. Holistic, root-cause approaches can be treatment- and cost-effective at reducing transit crime and enhancing feelings of safety on transit. For instance, hiring more transit outreach workers and increasing connections to social services for people experiencing homelessness can be more cost-effective than the police in reducing crime. So too can increasing staffing levels of unarmed personnel in booths and staffing public bathrooms. This evidence is incorporated in the design of the Southeastern Pennsylvania Transportation Authority’s (SEPTA) SCOPE initiative in the Philadelphia region, which includes performance metrics and calls to action for partners, and has already won the 2022 Innovation Award from the American Public Transportation Association. Transit agencies can also consider infrastructure improvements such as increasing lighting and maintenance to reduce crime. Reducing wait times has also been found to improve perceptions of safety, particularly for women riders. Finally, both off-vehicle fare collection and zero-fare programs have been found to lead to significant declines in security incidents on transit.
- Address the intersection between economic security, employment, and safety. Research points to a promising body of interventions aimed at enhancing safety through economic opportunity. The most effective long-term solution is decreasing unemployment—much of the reduction in property crime seen during the 1990s can be attributed to the declining unemployment rate. More near-term solutions include launching summer job programs for youth; bolstering job training and workforce development initiatives (particularly in locally growing fields); providing short-term financial assistance combined with therapy; and offering higher wages for low-skilled jobs. Additionally, permanent supportive housing—which combines long-term rental assistance and supportive services to maintain housing stability—has consistently been shown to yield reduced police interactions and jail stays for those experiencing homelessness, increased housing security for homeless people (even those with severe disabilities and alcohol disorders), and decreased arrests and recidivism rates for returning citizens. Downtowns and downtown-adjacent neighborhoods have a significant role to play in both long-term and short-term solutions. For instance in Philadelphia, the West Philadelphia Skills Initiative is seen as a partner in solving gun violence through its programs to address poverty through good-paying jobs.
- Strengthen placemaking and place governance. Residents’ feelings of social cohesion and belonging in a neighborhood are also associated with lower violent crime rates. Research has found that increasing the number of spaces for informal contact between neighbors (e.g., “third places”) and investing in creative placemaking can enhance residents’ sense of safety in urban areas. Place governance and management organizations have a crucial role in the funding and management of placemaking, and have also been early adopters of non-police alternatives to safety. For instance, downtown business improvement districts pioneered the use of non-police, trained helpers (or “ambassadors”) as a visible, human component of “clean-and-safe” program implementation and an alternative to relying on law enforcement for all needs. Increasing the number and visibility of these ambassadors is a lower-cost, higher-impact way to address perceptions of disorder and provide reassurance to the public. And as crime data shows, it is not only downtowns that need this kind of support. In Chicago, the Corridor Ambassador program works through community-based organizations to extend the positive impacts of ambassador programs to neighborhood commercial corridors throughout the city.
Conclusion
Public, private, and civic sector leaders have the evidence and tools at their disposal to advance pragmatic solutions that can not only improve perceptions of safety, but also chart a future for cities in which all residents can actually be safe, regardless of their ZIP code.
Understanding the geography of crime within cities is crucial because safety solutions are not universal—what works to reduce certain crimes downtown may not work in other areas suffering from generations of disinvestment and segregation. And while there are evidence-based solutions that can improve safety across entire cities (such as enhancing access to economic opportunity, behavioral health care, and third spaces), public and private sector leaders must heed data and evidence when employing them to be effective in reducing crime and stewarding public dollars.
The future of urban economies rests in shared prosperity between downtown, neighborhoods, and their broader regions. The same is true for safety—all residents of a region deserve to feel and be safe, so leaders must deploy investments and interventions in a manner that is most effective and humane in achieving that goal.
The authors would like to thank Matthew Pruitt and Michael McVerry for their excellent research assistance on this piece. They also extend their sincere gratitude to Fred Cerullo (Grand Central Partnership), Michael Edwards (Chicago Loop Alliance), Paul Levy (Center City District), Samir Mayekar (City of Chicago), Julie Stein (City of New York), and Jennifer S. Vey for reviewing earlier drafts of this piece. Any errors that remain are solely the authors’.
Related Content
Authors

-
Footnotes
- For the purpose of this brief, New York’s “downtown” maps onto core Manhattan boundaries, meaning south of 59th Street. For maps of all four cities’ downtown boundaries, please see Breaking the ‘urban doom loop’: The future of downtowns is shared prosperity.
- All qualitative interviews capture respondents’ perceptions from fall 2022—reflecting a point in time that may not capture improvements or challenges that have happened since.
- This paper relies on publicly available crime trends reporting. However, it is important to note that many forms of harm and violence are not considered “crimes,” and many “crimes” themselves are constructs shaped by the norms and interests of a given society.
- While issues of public safety intersect with issues of unsheltered homelessness—in part because unsheltered homelessness influences perceptions of public safety and in part because people experiencing homeless are disproportionately likely to be both victimized and criminalized—this brief focuses primarily on publicly reported crime (property and violent). A forthcoming publication will focus entirely on findings related to homelessness.
- Sources for hyperlocal crime data include: 1) New York City Police Department’s historical crime data citywide and by precinct from 2019 through 2021, and weekly CompStat 2.0 reports for 2022 incidents both citywide and in Manhattan South’s Patrol Borough; 2) Philadelphia Police Department’s Year-End Reporting from 2019 to 2022 for citywide crime statistics, and the Philadelphia District Attorney’s Office Incidents Report Database monitoring crime in Police Districts 6 and 9 from 2019 to 2022; 3) Chicago Police Department’s year-end reporting for District 1, District 12, and District 18 from 2019 to 2022; and 4) Seattle Police Department’s Crime Dashboard for citywide reporting and the following sub-precinct areas: D1, D2, D3, K1, K2, K3, M1, M2, M3, O1, O2, and Q3.
- National crime data after 2020 has significant limitations due to reporting changes in the FBI Uniform Crime Reporting program implemented in 2021.
- To get a more nuanced picture of the spatial distribution of crime, we identified police districts that most closely map onto cities’ downtown boundaries (see Endnote 5) and analyzed the following: 1) the extent to which downtown crime drove citywide increases in property and violent crime between 2019 and 2022; 2) changes in the share of downtown property and violent crimes between 2019 and 2022; and 3) changes in the nature of violent crime during the same period in each city and downtown.
- Not all local police departments reported violent crime broken down into categories, so we could not examine homicides separately here.
The Brookings Institution is committed to quality, independence, and impact.
We are supported by a diverse array of funders. In line with our values and policies, each Brookings publication represents the sole views of its author(s).