Please see the note at the bottom about several corrections made on December 23, 2025.
Executive summary
The Infrastructure Investment and Jobs Act (IIJA) and Inflation Reduction Act (IRA), enacted in 2021 and 2022, respectively, supported thousands of projects across the country to improve transportation, energy, and water systems. The laws generated intense interest in leveraging these investments to expand career opportunities for people often left behind in the labor market. But infrastructure dollars flow from so many federal departments, support such a wide range of activities, and go to such a wide variety of organizations that it is difficult to see the full picture. Moreover, the laws largely sidelined the federal, state, and local entities that are most knowledgeable about education, training, and job placement.
This paper aims to demystify the infrastructure landscape for state and local leaders so they can narrow the task of “infrastructure workforce development” into more manageable pieces. What are the subsectors within the infrastructure field? Who are key actors, and how do they relate to each other? What federal, state, and local policies and funding patterns shape the incentives for different actors in a given subsector? Accordingly, this paper describes the infrastructure field; outlines which entities received federal funding and for what purpose; and lays out how federal, state, and local policy and funding all interact with each other. Armed with this information, state and local leaders can better identify infrastructure subsectors of interest, connect with relevant employers, assess associated labor market needs, and strategize with employers, education and workforce entities, unions, and others to more effectively recruit and prepare people for jobs in that sector.
Toward that end, this paper analyzes federal awards to entities in the public, private, and nonprofit sectors in the state of California, and recommends particular infrastructure subsectors for workforce development efforts.
In our analysis of federal grants awarded between 2022 and 2024, we made the following discoveries:
- The federal government granted 4,399 awards to entities in the public, private, and nonprofit sectors in California through the IIJA and IRA, totaling $61.5 billion. Grants came from multiple federal departments, including the departments of Transportation, Energy, Interior, Commerce, and Agriculture, as well as the Environmental Protection Agency.
- Awards supported a wide range of infrastructure and climate-related projects, including roads and bridges; public transit; reductions in greenhouse gas emissions from transportation, buildings, and industrial processes; water quality and availability; energy; broadband; urban forestry; flood and fire prevention; and more. The largest share of funding went to roads and bridges.
- Awards went to a wide variety of organizations in the public, private, and nonprofit sectors, but the largest share went to state agencies. The California Department of Transportation (Caltrans) received the largest amount, followed by the California State Water Resources Control Board, the California Energy Commission, and the California Public Utilities Commission. Local government entities such as transit authorities, ports, airports, water and energy utilities, and air quality districts also received sizable amounts of funding.
- Few awards included workforce development activities such as occupational skills training and job placement, based on an analysis of project descriptions from the Invest.gov website created by the Biden administration (and subsequently removed by the Trump administration).
After he took office in January 2025, President Donald Trump upended established priorities and spending across the federal government. While there is no authoritative source of all the funding cuts and cancellations, we identified nearly 70 awards totaling $7.5 billion that President Trump cancelled—about 12% of all funding to the state.
The federal government’s infrastructure priorities and funding are less predictable now than they were before the 2024 election, and the upcoming re-authorization of the IIJA also raises questions. Nonetheless, the federal government will continue to support transportation, energy, and water infrastructure systems—in some fashion. The uncertainty is real, though. Funding priorities and amounts may change, awards may be less predictable, and new conditions may be attached to funding.
But federal funding is not the only game in town. Most infrastructure spending comes from state and local sources, and it is state and local leaders who have the most control over planning, designing, and implementing infrastructure projects. Relatedly, the state of California has made substantial policy and financial commitments to address climate change, which necessarily involve infrastructure.
Whatever the federal role, state and local leaders have to work together to ensure that critical energy, water, and transportation systems all function, and that requires paying attention to the workers who build, maintain, and operate those systems. Ensuring that there are enough workers with the right skills to carry out infrastructure projects should be a standard consideration in project development and implementation. Problems related to quality control, delays, and cost overruns are much more likely to occur if leaders and employers treat recruitment, training, and hiring as afterthoughts.
The infrastructure field has long faced challenges with recruiting and retaining workers. If state and local actors such as employers, policymakers, workforce development organizations, educational institutions, nonprofits, unions, and others work together, they can create more robust talent pipelines to help employers meet their hiring needs while also providing career opportunities to a broad, diverse pool of workers. Since most infrastructure jobs do not require a college degree (though many incorporate apprenticeships or other on-the-job training), they are accessible to a wide swath of the workforce. Moreover, infrastructure jobs offer above-average median wages and a higher floor for workers at the lower end of the wage distribution.
This paper makes two core recommendations:
- Invest in workforce sector partnerships in targeted infrastructure fields, starting with zero-emission transportation and water quality and availability. Sector partnerships focus on recruitment, training, and job placement for employers who produce similar goods and services or that otherwise have similar skill and occupational needs. These partnerships are standard practice in workforce development nationally and in California, but the state does not appear to have standing, statewide, cross-agency capacity to support such efforts. Zero-emission transportation and water are good bets for sector partnerships: They are supported not only by federal investments, but also by state and local investments and policy goals, which will likely continue to generate activities and projects that require skilled workers.
These sector initiatives should be undergirded by a permanent statewide cross-agency and policy infrastructure—one that is neither bound to a specific time-limited funding stream nor applicable only to programs funded or supported by a given agency.
- Recruit and train a diverse range of workers, including young adults. Leaders and programs can and should emphasize different geographic areas or groups of people (including job seekers and incumbent workers), but they should also prioritize reaching young adults. Nationally and in California, the systems supporting the transition from school to a good job are foundering for many young people. Nearly 525,000 young people ages 16 to 24 in California were disconnected from school and work as of 2022—11% of that age group—and they face increased chances of unemployment and low-wage work.
Carrying out these recommendations will require mapping out existing efforts to build on, identifying gaps, and holding important and difficult discussions about which organizations should be involved, what roles they should play, who should be in leadership positions, and (not least of all) funding. The workforce, education, and infrastructure sectors in California all have considerable resources and strengths, but they need to work together more effectively to develop better talent pipelines for in-demand infrastructure- and climate-related jobs. This includes attention to recruitment, occupational skills training, apprenticeships, career navigation, job placement, and job retention.
There is not a unitary template for success, but collaboration is essential. Coalition governance and structures vary by place, and so do the idiosyncrasies of organizational capacity and relationships. But success will depend upon leveraging and strengthening the “invisible” civic infrastructure that enables multiple organizations to work together toward shared goals.
Introduction
Federal infrastructure and climate-related spending dramatically increased in recent years thanks to two signature pieces of legislature signed by President Joe Biden: 2021’s Infrastructure Investment and Jobs Act (IIJA) and 2022’s Inflation Reduction Act (IRA). The laws invested in tens of thousands of projects across the country to improve transportation, energy, water, and broadband systems; support wildfire and land management; reduce greenhouse gas emissions; and more. All these projects require skilled workers, but it has been challenging to connect the investments to robust workforce development strategies and bring more people into infrastructure-related careers. The laws mostly allow—but do not require—workforce development activities such as outreach, recruitment, occupational skills training, and job placement. They provide few automatic mechanisms to link education and workforce leaders with those planning or carrying out infrastructure projects. Nor did the laws fund apprenticeships, community colleges, the public workforce development system, or the nonprofit organizations that do so much to recruit and prepare workers.
Moreover, federal funds flow from so many departments, cover such a wide range of activities and projects, and go to such a wide range of recipients that it is difficult to assess the full spectrum of infrastructure spending.
Another issue is that the infrastructure sector itself is fragmented and decentralized. It is better understood as a “supersector” that spans multiple industries that all relate in some way to physical assets in the built and natural environments. This supersector includes energy, water, and transportation systems; broadband networks; public works; and land management—all of which encompass different actors, activities, and purposes. The infrastructure supersector is fragmented in terms of governance as well. It includes a variety of state and municipal agencies, energy utilities that may be publicly or privately owned, water utilities and districts that may be governed and funded separately from a municipal or county government, transit agencies, port authorities, and more. It can be a confusing landscape for education and workforce actors to navigate, just as the education and workforce development landscape can be confusing for infrastructure entities to navigate.
This paper seeks to help actors in the workforce and education sectors—or anyone interested in helping to recruit, train, and place people into infrastructure jobs—better understand the infrastructure sector. Toward that end, the paper assesses flows of federal infrastructure spending into California between roughly 2022 and 2024, lays out the kinds of projects that were funded and the types of organizations receiving the funds, and provides a light review of whether workforce development was incorporated into these awards.
Of course, the political environment changed dramatically when President Trump took office in January 2025. He moved quickly to counter many of the IIJA and IRA’s goals. His administration paused or cancelled funds that did not align with his administration’s priorities, and he championed the One Big Beautiful Bill Act, which modified or cancelled IRA tax credits and rescinded the unobligated funds of many IIJA and IRA programs.
Another factor in any analysis of infrastructure spending is that federal funds, while notable and often catalytic, are not the only sources of support. In fact, state and local dollars account for the majority of infrastructure spending, whether through user fees, general fund revenue, or debt instruments such as bonds.
Nonetheless, a review of federal infrastructure awards provides critical insights for workforce development actors, since the awards not only provide funds but also signal the priorities of the state and local entities that access federal dollars and manage transportation, water, energy, and clean air projects.
The findings below are based on an analysis of the Investing in America spreadsheet downloaded from the Invest.gov website on January 14, 2025, before it was dismantled by the Trump administration. The spreadsheet includes awards from 2021-25, but it primarily includes awards in the 2022-24 period. Our goal was to identify IIJA and IRA awards that were granted or allocated to entities in California, including those in the public, private, and nonprofit sectors. For more information on the spreadsheet and our analysis, please see the Methodology.
Findings
Through the IIJA and the IRA, the federal government made 4,399 awards in California totaling $61.5 billion. Roads and bridges accounted for the largest share of funds.
The awards we identified were made between 2022 and 2024. For simplicity’s sake, we combined funding from different years into one figure, rather than reporting on awards separately by year.
There were 4,399 awards in all, which spanned a wide range of infrastructure categories such as transportation, water, energy, broadband, and more. Transportation-related awards (encompassing projects for roads, public transit, airports, rail, and ports) accounted for the largest percentage of awards (49% of all awards) and the largest share of funding (65% of all funds).
Categories that accounted for more than $1 billion are highlighted below.
|
Roads, bridges, and major projects |
This category received the most funding, accounting for nearly 40% of all funds to the state. These funds primarily went to Caltrans, the state’s department of transportation ($23.4 billion in awards). |
|
Public transportation |
Funds went to a variety of organizations, including regional transit authorities such as LA Metro and Bay Area Rapid Transit as well as metropolitan planning organizations such as the Southern California Association of Governments and the Fresno Council of Governments ($7.6 billion in awards). |
|
Water |
The California State Water Resources Control Board received a little more than half of the funding for water-related projects ($2.5 billion), but funding also went to many regional water systems across the state, such as the Metropolitan Water District of Southern California, the Contra Costa Water District, and the LA Department of Water and Power ($4.6 billion in awards). |
|
Clean energy and power |
More than half of the funding in this category—$2.7 billion— was cancelled, including $1.2 billion to the Alliance for Renewable Clean Hydrogen Energy Systems (ARCHES) and $600 million to the California Energy Commission to enhance the state’s electrical grid. The largest remaining award ($1.1 billion) was to the Pacific Gas and Electric Company to support the Diablo Canyon Power Plant ($4.4 billion in awards). |
|
Broadband |
Half of the funds ($1.9 billion) went to the California Public Utilities Commission through the Broadband Equity, Access, and Deployment Program ($3.8 billion in awards). |
|
Passenger and freight rail |
Most of this funding—two awards to the California High-Speed Rail Authority totaling $3.3 billion—was cancelled. The remaining funds totaled about $370 million ($3.6 billion in awards). |
|
Environmental remediation |
This category included a range of programs such as plugging abandoned oil and gas wells, remediating polluted areas through the Brownfields Program and the Superfund Program, and increasing recycling ($2.2 billion in awards). |
|
Climate resilience |
This category included awards to prevent and mitigate droughts and wildfires and primarily went to local conservation districts and water and irrigation districts ($2.2 billion in awards). |
|
Safety |
These funds focused on reducing risks and improving safety on roads, highways, and rail systems ($2.1 billion in awards). |
|
Resilience |
This category included funding for a variety of programs designed to adapt transportation infrastructure to weather and natural disasters, restore habitats, prevent fires, and mitigate floods ($1.6 billion in awards). |
|
Airports |
These funds supported airport capital improvements and went to airport authorities ($1.6 billion in awards). |
|
Electric vehicles, buses, and ferries |
This category included the National Electric Vehicle Infrastructure Formula Program awarded to the California Energy Commission in collaboration with Caltrans, and it also included other awards to support electric vehicle (EV) charging infrastructure and transitions to clean-energy school buses ($1 billion in awards). |
An introduction to the infrastructure field and to infrastructure- and climate-related jobs
-
Infrastructure as a supersector
The infrastructure field is broad enough that it can be considered a “supersector” that spans multiple industries. As classified by Brookings colleagues, these industries include transportation (both within and between metropolitan areas), trade and logistics, energy, water, telecommunications, and public works.
-
Infrastructure occupations
Infrastructure and climate jobs involve building, operating, and maintaining a variety of physical assets in the built and natural environments. But how does that translate into specific occupations?
Previous Brookings research found that the most common infrastructure positions are in the skilled trades and construction-related occupations. Yet jobs in the field cover a wide range of varied roles, such as civil engineers, bus mechanics, cargo handlers, meter readers, hydrologists, foresters, and workers in management, finance, and customer service. Think of all the workers responsible for maintaining roads, streetscapes, and parks; managing water and energy systems; moving goods and people; upgrading buildings to be more energy efficient; and more. Only about 15% of infrastructure workers have bachelor’s degrees, meaning that the jobs are broadly accessible, although many of them incorporate apprenticeships or other on-the-job training. Moreover, infrastructure jobs offer above-average median wages and a higher floor for workers at the lower end of the wage distribution.
-
Climate-related occupations
Jobs that are climate-related or “green” are not so clearly defined. There is no clear consensus about how to categorize and count jobs geared toward reducing greenhouse gas emissions, adapting to climate impacts, or preserving or restoring natural resources. There is agreement, however, that such jobs do not primarily represent new and distinct occupations. Rather, meeting climate-related goals generally involves incorporating new tasks and skills into existing occupations.
For example, an analysis of the jobs generated by nearly 30 programs funded by the California Climate Investments initiative found that more than half were in the construction sector. An analysis of occupations most relevant to green infrastructure and urban forestry projects found that only two of the ten largest occupations related directly to plants and soil. The other eight included the workers that build and maintain the elements that surround and contain green infrastructure and urban forestry facilities (construction laborers, carpenters, and plumbers) and those that transport or move related materials (freight and material movers and truck or tractor operators).
Awards went to many types of entities in the public, private, and nonprofit sectors, but state agencies received the largest share of funds.
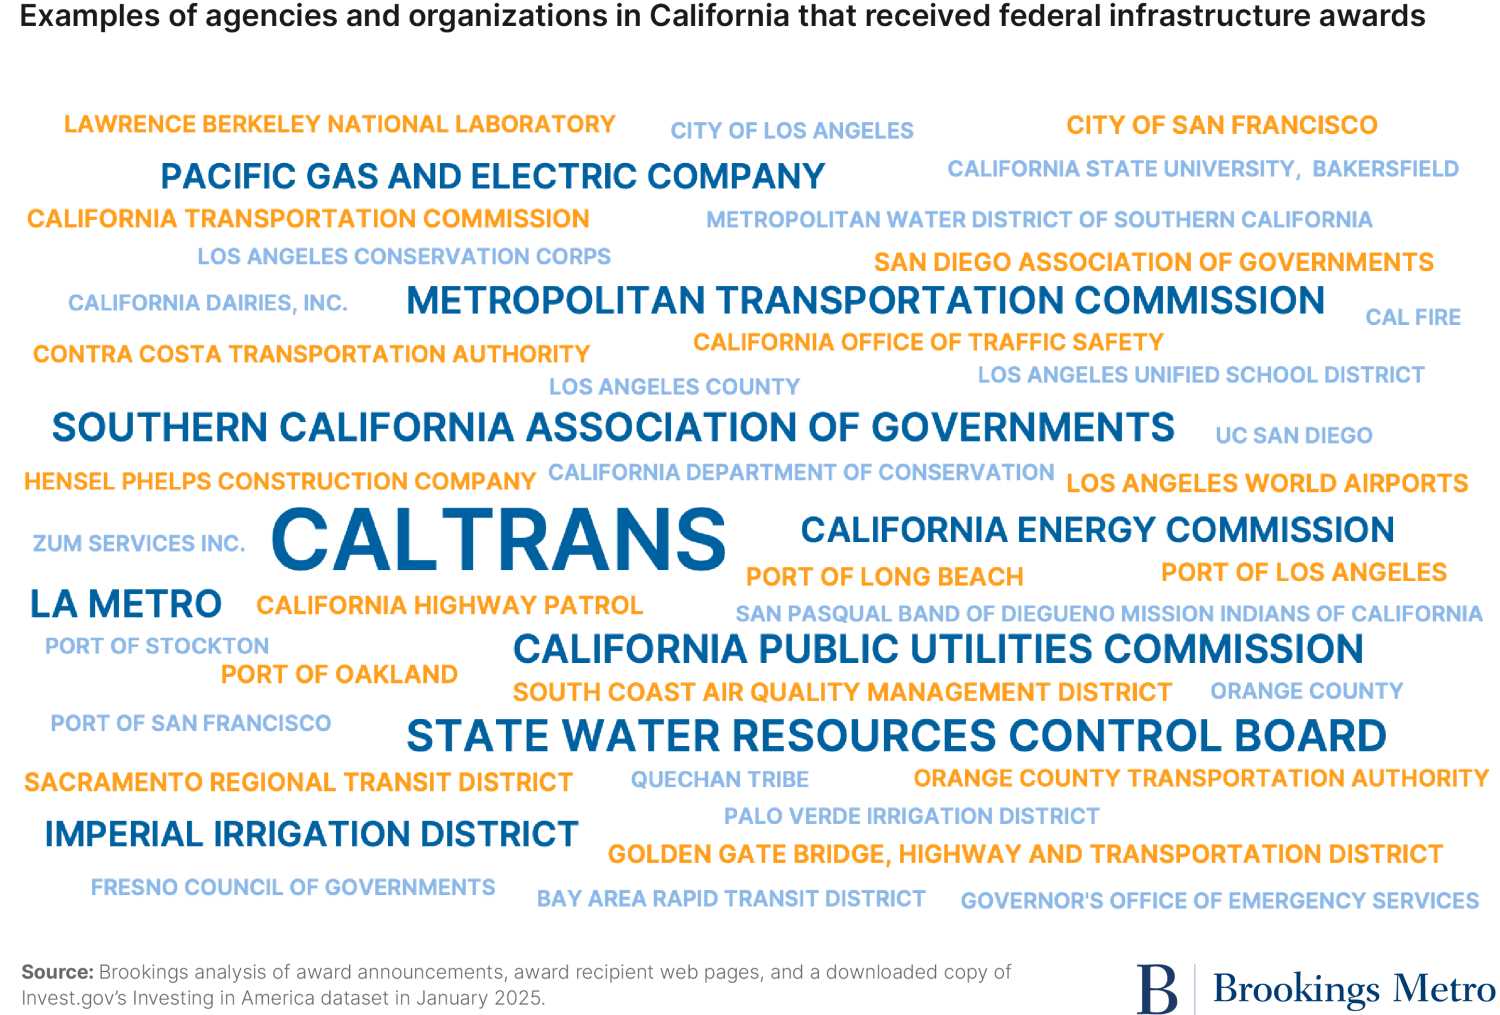
Recipients of federal funding included a wide variety of actors: state, local, and tribal governments; special purpose government bodies like transit, air quality, and water districts; nonprofits; universities; community colleges; private-sector firms; school districts; and others (see Figure 2). These are the entities that decide whether and how to include workforce development activities such as outreach, recruitment, training, and job placement as they deploy their funds.
Among the multitude of awardees, state agencies stood out as a group for their role in receiving and managing federal awards—accounting for $34.6 billion, about 56% of all funds to the state. This is because much of the funding, especially from the IIJA, consisted of formula funding, which allocates federal funds to designated state and local governments (primarily state governments) based on pre-existing formulas, such as population levels or roadway miles. Competitive grants are open to a wider range of organizational types, and there is no guarantee of funding as there is with formula grants.
Awards to California state government entities are concentrated in a few agencies
-
Caltrans
Caltrans manages the state highway system, including over 52,000 lane miles and 13,000 bridges. It also provides inter-city rail and partners with local transit operators, but its primary focus is on engineering and construction related to roadways.
IIJA and IRA funding: $24 billion from 265 awards.
- Most of its funds ($18 billion) come from four highway formula programs: the National Highway Performance Program, the Surface Transportation Block Grant Program, the Congestion Mitigation and Air Quality Improvement Program, and the Highway Safety Improvement Program. Caltrans allocates about 40% of these funds to local transportation agencies.
- A total of $284 million comes from the National Electric Vehicle Infrastructure Formula Program, which Caltrans manages in partnership with the California Energy Commission, to deploy EV charging infrastructure.
- Nearly $700 million comes in through more than 30 competitive grants throughout the state.
-
California State Water Resources Control Board
The California State Water Resources Control Board works with the nine regional water quality control boards to protect water quality and allocate surface water rights.
IIJA and IRA funding: $2.5 billion from 23 awards.
- This included $1.5 billion from the Drinking Water State Revolving Fund and $674 million from the Clean Water State Revolving Fund. These funds capitalize state loan funds that the water board uses to provide low-cost financing to eligible entities (such as utilities, local governments, and special districts) for projects such as water treatment plants, pollution and stormwater control, and pipe installation and repair.
-
California Energy Commission
The California Energy Commission is the state’s primary energy policy and planning agency.
IIJA and IRA funding: $1.4 billion from 13 awards.
The commission received more than $700 million from multiple awards to enhance the state’s electrical grid.
- It was also awarded nearly $600 million from two programs to support residential clean energy retrofits, $56 million to install EV charging stations, $25 million of the Solar for All grant to establish new programs for deploying solar projects in publicly owned utility territories, and $10 million to support training for residential energy contractors.
-
California Public Utilities Commission
The California Public Utilities Commission regulates privately owned electric, natural gas, telecommunications, water, railroad, rail transit, and passenger transportation companies.
IIJA and IRA funding: $2.1 billion from two awards.
- The commission received $1.9 billion from the Broadband Equity, Access, and Deployment Program to connect all Americans to high-speed Internet and about $200 million of the Solar for All grant to support community solar and solar on multifamily affordable housing projects in investor-owned utility territories.
Awards to local and regional governments are spread across many types of entities
Most are special purpose governments or municipal proprietary agencies with specific, limited purviews to manage services and assets related to transportation, energy, water, and air quality.
-
Metropolitan planning organizations
- Metropolitan planning organizations are groups of local governments and transportation agencies that plan and coordinate transportation projects for urbanized areas with over 50,000 residents. Examples: Southern California Association of Governments, Sacramento Area Council of Governments, Fresno Council of Governments
-
Transit agencies
- Transit agencies plan, operate, and maintain public transportation (such as buses, light rail, and subways) within a defined geographic area. Examples: LA Metro, Bay Area Rapid Transit, Santa Clara Valley Transportation Authority, San Joaquin Regional Transit District
-
Ports
- Ports are centers of commerce where ships and boats dock to load and unload cargo and passengers. Examples: Port of Los Angeles, Port of Long Beach, Port of Oakland, Port of San Francisco, Port of San Diego
-
Air districts
- Air districts are responsible for monitoring regional air quality and issuing permits for stationary sources of air pollution. They partner with the statewide California Air Resources Board. Examples: South Coast Air Quality Management District, San Joaquin Valley Air Pollution Control District, Bay Area Air Quality Management District
-
Water utilities and districts
- Water utilities and districts supply, treat, and conserve water. Examples: Los Angeles Department of Water and Power, Los Angeles County Sanitation Districts, Metropolitan Water District of Southern California, Contra Costa Water District, Sacramento Area Sewer District, Imperial Irrigation District
-
Energy utilities
- Energy utilities generate, transmit, and distribute energy such as electricity or natural gas. Examples: Los Angeles Department of Water and Power, Pacific Gas and Electric Company, Sacramento Municipal Utility District, Southern California Edison, Redwood Coast Energy Authority
-
General purpose governments
- General purpose governments such as cities, counties, and towns are probably the most commonly understood type of local government. They provide a wide range of services such as public safety, parks, and social services. Examples: Los Angeles County; Tulare County; Monterey County; and the cities of San Francisco, Los Angeles, Stockton, and Redlands
We identified 96 awards incorporating workforce development activities, accounting for 2% of all awards.
We identified 96 awards that incorporated workforce development activities such as occupational skills training, apprenticeships, and job placement. All are competitive grants.
This is almost certainly an undercount, but it is nonetheless a useful benchmark. We primarily relied upon project descriptions from the spreadsheet of awards available from the Invest.gov website, without systematically investigating the awards to gain further information, such as by reviewing the websites of awardees or related announcements and articles. For comparison’s sake, when we did a more thorough review of awards made in the Los Angeles region, looking for information beyond what was listed on the Invest.gov website, we found a higher share of awards (7%) that incorporated workforce development activities. The Invest.gov spreadsheet on its own does not provide enough information to determine with precision the share of awards that include workforce development elements.
However, the estimate about how many awards include workforce components is directionally useful. Whether the share of awards incorporating workforce development in California is 2% or 7%, it is a low number and signals that workforce development was not a major factor in infrastructure projects. Even if the figure was 15%, double what we calculated in the Los Angeles region, it would still be a relatively low number.
In 51 of the awards, the stated purpose of the grant was to provide education, training, and work-based learning opportunities. Proposed activities included providing training in such fields as railroad engineering, industrial technology, brownfield remediation, hybrid vehicle and EV maintenance, water treatment, and solar installation. Proposals also described internships, professional development, and research opportunities for undergraduate and master’s students focusing on agricultural science, natural resources management, and transportation.
The remainder of the awards incorporated education, training, and work-based learning opportunities as activities related to broader infrastructure and climate-related goals. These included transitioning to zero-emission vehicles; strengthening the electrical grid; retrofitting buildings to increase their energy efficiency; promoting urban and community forestry; restoring habitats and removing litter; and increasing protections against storm surges, flooding, and fires.
Two types of projects stood out for incorporating workforce activities: those supporting the transition to zero-emission vehicles (15 awards) and urban and community forestry (12 awards). Transportation electrification awards with workforce elements ranged in size from $7 million to $500 million; grantees included the South Coast Air Quality Management District, the ports of Los Angeles and Long Beach, and local transit agencies. Urban forestry awards with workforce components ranged in size from about $400,000 to $12 million, and they went to local governments, universities, and nonprofits.
We identified 67 awards totaling $7.5 billion that were cancelled by the Trump administration
The federal funding and policy landscape has been chaotic and confusing since President Trump took office. There has been a flurry of executive orders, departmental memos, and contract and grant cancellations from the Department of Government Efficiency and other federal departments. There is no consolidated source on which grants or funding programs have been affected. Nonetheless, it is possible to piece together information that at least provisionally identifies how many awards in California have been cancelled.
We found more than twenty programs that appear to have been cancelled, accounting for nearly 70 awards totaling $7.5 billion. Table 1 lists the ten largest cancelled awards.
Two of the awards account for more than half of the cancelled funds: $3.1 billion to the California High-Speed Rail Authority and $1.2 billion to the Alliance for Renewable Clean Hydrogen Energy Systems (ARCHES). Eight awards totaling more than $900 million from two Department of Energy programs promoting electric grid upgrades were cancelled; the largest of these cancelled grants was a $600 million one to the California Energy Commission. Other cancellations include grants to reduce carbon emissions in industrial processes ($500 million to the National Cement Company of California and $189 million to Brimstone Energy); $427 million to develop offshore wind projects in Humboldt Bay; $270 million for a carbon capture demonstration project; $250 million to the California Public Utilities Commission, California Energy Commission, and Labor and Workforce Development Agency for the Solar for All Program; 31 grants from the Environmental and Climate Justice Program totaling $228 million; and $70 million to the California Department of Technology for a State Digital Equity Capacity Grant.

Don’t forget about state and local policy
As noted previously, state and local entities provide most infrastructure funding whether through ratepayer revenue, general funds, or debt instruments like bonds, and they also own and operate most infrastructure assets. The state of California is making sizeable infrastructure and climate investments that will support projects likely to generate labor market demand. As discussed in the recommendation section below, those investments include transportation electrification and ensuring water quality and availability. Additionally, at least three other state programs signal that the state is prioritizing climate and infrastructure issues. Both the Climate Bond and the Cap-and-Invest Program described below explicitly allow workforce development activities, although much will be determined in implementation.
- The Climate Bond (or Proposition 4) was passed by California voters in 2024, directing $10 billion to climate-resilience purposes, including water, wildfire, energy, biodiversity, access to nature, and more. The California Natural Resources Agency administers the bond overall, and a variety of state departments, boards, conservancies, and commissions administer specific programs.
- Proceeds from the state’s Cap-and-Invest Program (until recently known as Cap-and-Trade) provide funds for the California Climate Investments (CCI), which support projects addressing climate change while providing environmental, economic, and public health benefits. The California Air Resources Board oversees CCI as a whole, which consists of more than 100 programs administered by multiple state agencies. Funding categories include agriculture, energy, nature-based solutions, transportation, transit-oriented development, water, and more.
- SB 1, the Road Repair and Accountability Act, was enacted in 2017 and directs an estimated $5 billion annually to state highways, local streets and roads, transit, and pedestrian and cycle routes.
Recommendations
Going forward, federal, state, and local infrastructure and climate-related investments will continue to support projects that need skilled workers. Aging and vulnerable water infrastructure, inefficient and outmoded energy facilities, and outdated residential and commercial buildings all need upgrades and maintenance. The state needs to continue to build out its charging infrastructure given its emphasis on zero-emission transportation. Floods, droughts, fires, and other acute and chronic impacts add to the urgency of these challenges.
These activities provide opportunities to create stronger and more robust career pathways for people and workers who are often left behind, while also helping employers in the infrastructure sector find and retain the workers they need.
To accomplish this, California leaders in the workforce, education, and infrastructure sectors need to knit their considerable resources together more effectively to develop talent pipelines for in-demand infrastructure and climate-related occupations. Below are some recommendations about how to do so.
1. Invest in workforce sector partnerships in targeted infrastructure fields, starting with zero-emission transportation as well as water quality and availability
At this point, sector strategies are a core workforce development approach nationally and in California. For example, the California Workforce Development Board’s High Road Training Partnership is based on a sector model. Sometimes called sector partnerships, industry partnerships, or industry sector partnerships, sector strategies focus on job training and placement in particular industries or occupations, rather than trying to meet employer needs across the whole span of the labor market.
Notably, sector initiatives should be undergirded by a statewide cross-agency and policy infrastructure, neither bound to a specific time-limited funding stream nor applicable only to programs funded or supported by a given agency. Without such scaffolding, programs will not scale and may not last. And crucially, a critical mass of employers within a given sector will need to work together to identify and communicate their current and future skill needs. Absent such intelligence (which cannot be gleaned from publicly available data or sporadic convenings), education and workforce entities will not have the information they need to target business needs.
Based on a review of investments at the federal, state, and local levels, along with information on local actions and priorities, we recommend initiatives focused on zero-emission vehicles and water infrastructure.
-
A note about sector initiatives
Sector partnerships typically link employers, business associations, community colleges, universities, workforce agencies, labor unions, community-based organizations, and others.
By collectively addressing the common skill needs of employers who provide similar goods and services or otherwise have similar occupational needs, sector partnerships are more efficient and have greater scale than more limited partnerships between individual employers and training programs. Sector partnerships also create forums for small- and medium-sized firms to join forces with larger employers for economies of scale in training investments.
As Brookings colleagues wrote, “Orchestrating this type of cross-sector interaction is more important and more difficult than is generally understood. The work is often referred to as ‘convening,’ and these organizations are called ‘intermediaries.’ These terms suggest that what’s needed is neutral dot-connecting, when in fact what’s needed is purposeful creation and management of civic networks in service of a shared economic strategy.” Such initiatives require leadership, skilled facilitators, and organizational capacity to re-engineer relationships, incentives, and practices to advance common goals.
Zero-emission vehicles and related infrastructure among light-, medium-, and heavy-duty vehicles and in the goods-moving sector: The transition to zero-emission vehicles in California is supported not only by the federal investments listed above, but even more so by state and local policies to reduce greenhouse gas emissions from the transportation sector. Together, these investments point to a continued focus on vehicle electrification that will reliably generate demand for workers in zero emission–related occupations in the state.
Nearly 160 federal awards totaling nearly $2.9 billion went to a variety of entities throughout the state to reduce transportation-related greenhouse gas emissions. Entities such as ports, transit agencies, school districts, air quality districts, and city and county governments received grants to install charging infrastructure and/or to purchase zero- or low-emission transit buses, school buses, trucks, and port vehicles and equipment.
At the state level, legislation signed in 2022 requires California to achieve net zero greenhouse gas emissions by 2045. Governor Gavin Newsom issued an executive order in 2020 mandating that all new passenger trucks and vehicles sold in the state must be zero emission by 2035, with a target of 2045 for medium- and heavy-duty vehicles. Governor Newsom followed that up with a 2025 executive order reaffirming the state’s commitment to zero-emission vehicles after President Trump signed legislation revoking EPA waivers that allowed the state to set state emissions standards that were more stringent than federal standards. Multiple state agencies—including the California Air Resources Board, the California Energy Commission, and the California Governor’s Office of Business and Economic Development—are all moving aggressively to support the deployment and use of zero-emission vehicles, and they are including workforce development in their efforts.
An analysis of the labor market needs associated with building out the state’s charging infrastructure estimates that the greatest demand will be for electricians; a variety of construction jobs; positions in planning, design, and administration; and utility line workers.
Looking more granularly at the regional level, the Green Jobs Regional Partnership housed at the LA Cleantech Incubator identified three high-priority EV-related occupations: electricians, technicians to maintain and repair charging stations and other supply equipment, and technicians to maintain and repair light-duty EV private vehicles and school buses. It also identified two occupations that may warrant attention after 2028: EV fleet managers and production line workers for manufacturing EVs and EV supply equipment.
Water systems including water treatment, distribution, and conservation and stormwater management: Water infrastructure includes a range of built and natural systems that supply, treat, and conserve water and also manage stormwater runoff to prevent pollution, flooding, and erosion. It includes “gray infrastructure” such as pipes, pumps, tunnels, and treatment plants as well as “green infrastructure” such as raingardens and bioswales that use plants, soils, and other media to capture and treat stormwater. Such systems are badly in need of investment: as Brookings colleague Joseph W. Kane wrote, “Whether it’s fixing pipes, modernizing treatment plans, or conserving and protecting natural resources, the list of water needs keeps growing, as does the price tag.”
The water sector has identified workforce development as a priority: a 2023 review of the industry summarized it thusly: “aging infrastructure remains the top concern in the sector, compounded by the pitfalls of an aging workforce and the pursuit of hiring qualified staff.” The U.S. Water Alliance, an industry association of water utilities and other stakeholders, noted, “many utilities face a current workforce quantity and quality crisis.” In California, the California Workforce Development Board has sponsored a High Road Training Partnership program in the water sector, and the Centers of Excellence for Labor Market Research within the community college system identified eight mission-critical water-sector occupations requiring more than a high school diploma but less than a bachelor’s degree that are difficult to fill, including positions for a variety of technicians, mechanics and maintenance workers, and operating engineers.
A series of federal, state, and local investments focus on water quality and availability, suggesting that continued projects and activities will require water workers. Nearly 320 water-focused federal awards totaling $4.6 billion went to state and local entities. The largest federal water investments went to the state (more than $2 billion), specifically to the California State Water Resources Control Board to capitalize state revolving (loan) funds (SRFs), with one focused on clean water and the other on drinking water. Through SRFs, states play a crucial role in planning, selecting, and investing in water projects that are often administered by local utilities and other local actors. Funded projects can include wastewater facilities, water treatment plants, pollution control, and pipe installation and repair.
Federal awards also went to local and regional entities such as the Metropolitan Water District of Southern California, the Contra Costa Water District, the Los Angeles Department of Water and Power, and the Sacramento Area Sewer District for projects relating to purifying and reusing cleaned wastewater, groundwater replenishment, desalination, and more.
Modernizing water infrastructure and management is clearly a state priority. The state’s 2022 Water Supply Strategy laid out priorities including developing new water through wastewater recycling and desalination and expanding water storage capacity to capture and save more stormwater. Such projects are capital intensive, expensive, and require ongoing operations and maintenance. California has directed billions of dollars to water and climate projects in recent years, even after state budget cuts. The 2024 Climate Bond will direct nearly $4 billion to water-related purposes, including safe drinking water, flood planning, stormwater management, and more—on top of similar projects already supported by general fund dollars.
2. Ensure that infrastructure workforce initiatives recruit from a broad, diverse group of people, particularly focusing on young adults
The infrastructure workforce skews older, with above-average shares of workers over age 45 and below-average shares under age 24. On average, an estimated 1.7 million infrastructure workers will need to be replaced each year over the next decade due to retirements and workers transitioning out of these jobs. Infrastructure projects like the ones mentioned above require a continuous flow of workers.
Meanwhile, the systems supporting the transition from school to a good job are foundering for many young people, especially for those from low-income backgrounds or whose parents do not have college degrees. In a concise distillation of the problems with current youth, education, and employment policies, Georgetown University’s Center on Education and the Workforce referenced “the triple deficits of inadequate access to postsecondary education, limited exposure to high-quality work experience and work-based learning, and insufficient counseling to support career navigation.” Another article memorably described the United States as having “arguably one of the least effective systems for preparing non-college bound youth for the workforce in the Western World.” These systemic barriers disproportionately affect young people of color and those from marginalized communities.
Nearly 525,000 young people ages 16 to 24 in California are disconnected from school and work—or 11% of all young people in that age group—and they face increased chances of unemployment and low-wage work. The problem is particularly acute among young adults past high-school age: 452,000 young people from ages 19 to 24 are disconnected, accounting for one in seven (14%) of all Californians in that age group. Almost all disconnected young adults from ages 19 to 24 have a high school diploma (93%), but relatively few have educational credentials beyond that: they either did not enroll in post-secondary education or they left without completing a degree. Disconnected young adults have less work experience than others in their age group as a whole and higher poverty rates, and they are disproportionately Black, Native American, and Hispanic or Latino.
Young people in these circumstances—with lower educational attainment, limited work experience, and likely weak professional networks—do not generally have good labor market prospects, likely facing high unemployment and low-wage jobs.
But more broadly, leaving so many people on the economic and social margins squanders human potential and productivity. A lack of educational credentials does not equal a lack of talent and drive. In this phase of life, young people should be charting their futures, developing their talents, and plugging into the labor market, thereby allowing themselves to support themselves and their families, pay taxes, and contribute to their communities. Instead, many young people face an obstacle course.
Notably, however, prioritizing young people does not mean only focusing on young people. Given that the infrastructure sector is struggling to find and retain workers, outreach should be broad. There are good reasons to focus on other communities or specific geographic areas. For instance, current car and bus mechanics, regardless of age, are good candidates to receive additional training to become certified in EVs.
And many of the strategies to support young people’s success in workforce development are beneficial to other groups as well, such as assistance with transportation or guidance about post-secondary options.
But reaching young people will require some specific approaches, such as partnerships with high schools (including career and technical education programs), high school re-engagement programs, and youth-serving nonprofits. Youth-serving initiatives should also include program design elements based on lessons from other youth-serving workforce development and education programs, such as the importance of positive and supportive relationships, cohort models, and stipends or paid work-based learning opportunities.
Conclusion
The recent surge in federal infrastructure and climate funding may be over. To say the least, federal priorities and funding have been unsettled since President Trump took office. However, state and local leaders are still the primary owners, operators, and funders of most infrastructure assets. They are in the driver’s seat. Of course, state and local actors face fiscal constraints, a major reason why federal funding is so important. Balancing ongoing maintenance with new capital projects and capacity expansions is a major challenge, as is the rising cost of materials.
But the infrastructure systems that undergird our daily life and economy—transportation, water, energy, natural resources, and other systems—only function if there are skilled workers to design, build, and maintain them. Given that infrastructure employers continually report difficulties with recruiting, hiring, and retaining workers, workforce development cannot be an afterthought. That is a recipe for project delays, quality control problems, and cost over-runs.
Infrastructure employers need to provide clearer signals about their current and future labor market demands and apply “the type of rigor and discipline to sourcing…talent that they historically applied to their materials supply chains.” The public sector should provide the enabling conditions through strong sector initiatives to help the private sector articulate its workforce needs. Meanwhile, there should be deep collaboration between education and workforce organizations to prepare job seekers and help incumbent workers advance. Much of this already happens, but at nowhere near the scale required.
There are important questions ahead about which agencies and organizations should be involved, what roles they should play, and who should be in leadership positions. These are not easily or superficially answered questions; cross-sector coalitions promoting greater economic opportunity “can be messy, time-consuming, and often marked by friction,” as noted by Brookings colleagues. There is not a unitary model or template for success, but collaboration is essential. The specifics of coalition governance and structure vary by place, and so do the idiosyncrasies of organizational capacity and relationships. But since no single organization has the knowledge, influence, and resources to carry out the work of a sector initiative, the goal of creating more and better employment opportunities for people and workers on the economic margins requires a coalition that leverages the strength of many.
-
Methodology for analyzing federal infrastructure grants to projects and organizations in California
Introduction
The purpose of the project was to identify federal funds through the Infrastructure Investment and Jobs Act (IIJA)—sometimes referred to as the Bipartisan Infrastructure Law (BIL)—and the Inflation Reduction Act (IRA) awarded to projects and organizations in California to support state and local leaders in developing strategies to connect workers to jobs associated with these investments. We included grants awarded to organizations in the public, private, and nonprofit sectors.
The Investing in America dataset
We began our search by downloading a copy of the most recent version of the Investing in America dataset from Invest.gov on January 14, 2025. According to the spreadsheet’s documentation tab, this version was last updated on January 10, 2025. The spreadsheet includes federally funded programs and projects across the United States under the Bipartisan Infrastructure Law (BIL), the IRA, and the CHIPS and Science Act. We looked at the funding summary tab, which provides information about each project in some of all the following columns (listed below). Fields that we particularly relied on in our analysis are bolded.
- ID [unique ID number]
- Funding source
- Program ID
- Program Name
- BIL/IRA/CHIPS program
- Announcement date
- Project name
- Recipient name
- Project description
- Project location type
- Latitude
- Longitude
- ZIP code (5-digit)
- City
- County
- Tribe
- State or territory
- 118th Congressional District
- Funding amount excluding loans
- Loan amount
- Announcement link
- Notes
- Agency name
- Bureau name
- Category
- Subcategory
- Program type [discretionary or formula]
- Provision/section #
- Submission period
- Historic ID
- Jointly funded
While the January 2025 Invest.gov spreadsheet has empty cells, every project is connected to a unique ID. Our awareness of the fully populated ID column informed Excel searching, sorting, and counting methods during our research.
Below we outline the basics of our approach. For more complete details, please contact the authors.
Filtering the Invest.gov spreadsheet
Step 1: Identifying projects in California
We filtered the state or territory column to only show projects with “CA” in that column and then copied and pasted these California projects into a new tab (N = 4,472).
Step 2: Focusing on IIJA and IRA awards
In this tab, we deleted the ten entries that represented awards funded by the CHIPS and Science Act since this law did not fund infrastructure projects (N = 4,462).
Step 3: Removing “TBD” awards
A total of 59 entries had “TBD” populated under the column for “funding amount excluding loans.” We deleted these entries because they did not have information on the dollar amount of the award, a major part of our analysis (N = 4,403).
Step 4: Removing awards identified as duplicates
In a separate analysis of infrastructure awards to the Los Angeles region, the authors identified duplicates of three awards under the Rural and Tribal Assistance Program, so we deleted these duplicates from our California spreadsheet (N = 4,400).
ID
Program
Funding Amount
16229
Rural and Tribal Assistance (RTA) Program
$320,000
16232
RTA Program
$315,000
16236
RTA Program
$40,000
Step 5: Other adjustments
One award (the Fiscal Year [FY] 2022 Bridge Formula Program) was listed as two entries, meaning that two components of the same award were listed on separate Excel rows with different unique IDs. Recognizing that two entries or rows in our spreadsheet represented components of one formula award meant that we could not count every row in our spreadsheet as one award. To account for this, we subtracted one from any ID column-based award counts that included the Bridge Formula Program (N = 4,399 awards).
Researching awards in the California spreadsheet
The Invest.gov spreadsheet did not provide complete information about most awards. Fields such as “recipient organization,” “project name,” and “project description” were often empty. Because the project’s time frame and budget did not allow us to investigate missing information for more than 4,000 awards, we prioritized specific research questions rather than aiming to completely fill out all the relevant fields.
Identifying state recipients of federal funding
From other research, we knew that IIJA formula funds to states constituted a large share of all federal infrastructure funding, and we knew that both the IIJA and the IRA included competitive programs with potentially large awards for which state governments were eligible applicants.
Because states receive such large awards, particularly through formula funding, and because they can make policy and programming decisions across a wide range of domains, we investigated how many and which awards went to state entities. We defined state entities as agencies, departments, and offices housed under the government of the State of California and used California’s most recently published executive branch organizational chart as a reference.
In the process of investigating state awards, we sometimes identified information about awards that went to other recipients, which we entered into the spreadsheet. However, we did not systematically search for information about awards going to non-state governmental entities such as nonprofits, businesses, or local governments.
We used the following strategies to identify awards that were likely going to go to California state entities:
- We reviewed programs and awards in descending order of funding amounts. We knew that formula programs (for projects like roads and highways, broadband deployment, and vehicle electrification) sent large sums to state agencies to support statewide projects. We also suspected that state agencies would have the capacity to apply for large competitive grants.
- We reviewed the Building a Better America guidebook to the BIL and the Building a Clean Energy Economy guidebook to the IRA to identify programs for which states were the only eligible recipients, as well as programs for which states and other entities were eligible applicants. Please see the appendices for the resulting lists of programs.
- We conducted desk research to verify whether state agencies identified in steps 1 and 2 were recipients and to document other award information. This included reviewing California state agency websites, federal agency websites, award announcements from various sources, and USAspending.gov’s Advanced Search tool.
We identified 380 awards going to state recipients. However, it is possible that there are additional state agency recipients that we were unable to identify or verify.
Identifying awards with workforce development components
We conducted an Excel search for rows containing the keywords “workforce” or “training” in the columns for program name, project name, recipient name, or project description with the formula IF(OR(ISNUMBER(SEARCH(“workforce”,R2:AG2)), ISNUMBER(SEARCH(“training”,R2:AG2))),”Yes”,”No”), whereby the output “Yes” or “No” would appear in a new column for each row. This formula returned 99 entries.
After a review of these entries and associated desk research, we decided that fourteen of these entries did not represent awards with workforce development components, as they did not reflect an end goal of employment or job placement through, for example, recruiting for training programs or open jobs, offering or referring to occupational skills training programs, or conducting employer outreach (N=85).
We then added ten awards that our formula keyword search had not flagged but that we had identified as having workforce development components from a more in-depth analysis of awards in the Los Angeles region and other sources (N=95).
Identifying cancelled awards
When President Donald Trump took office in January 2025, he directed his administration to review federal funding and to cancel awards and programs if they were not in alignment with his priorities, with a particular focus on awards for clean energy, greenhouse gas emissions, and environmental justice. We relied on a mix of sources, including leaked documents about cancellations made by the Department of Energy and the Environmental Protection Agency, announcements by federal and state agencies, press coverage, and information from other stakeholders to identify cancelled awards in our spreadsheet. All the relevant sources are listed in the report.
A note on infrastructure categories
The infrastructure categories described in the report are based on the “subcategory” column in the January 2025 Invest.gov dataset. According to Invest.gov’s documentation tab, these subcategories come from the federal BIL and IRA guidebooks and describe the primary kind of work that each program funds.
Appendix
This is a list of programs in our spreadsheet under which states were the only eligible recipients:
- Bridge Formula Program
- Broadband Equity, Access, And Deployment Program
- Carbon Reduction Program
- Clean Water State Revolving Funds
- Coastal Zone Management
- Congestion Mitigation and Air Quality Improvement Program
- Cost-effective Codes Implementation for Efficiency and Resilience
- Federal Lands Access Program
- Forest Legacy Program
- Highway Safety Improvement Program
- Highway Safety Programs
- Home Energy Performance-Based, Whole-House Rebates
- Manufacturing Leadership (Sec 40534)
- Motor Carrier Safety Assistance Program
- National Dam Safety Program
- National Electric Vehicle Infrastructure Formula Program
- National Highway Freight Program
- National Highway Performance Program
- National Priority Safety Programs
- Promoting Resilient Operations for Transformative, Efficient, and Cost-Saving Transportation (PROTECT) – Formula
- Railway-Highway Crossings Program
- Rehabilitation of High Hazard Potential Dams
- Rural Transportation Assistance Program
- State Digital Equity Capacity Grant
- State Digital Equity Planning Grant
- State Energy Program
- State-Based Home Efficiency Contractor Training Grants
- Surface Transportation Block Grant Program
This is a list of programs in our spreadsheet under which states and others were eligible recipients:
- Advanced Transportation Technologies & Innovative Mobility Deployment
- Airport Infrastructure Grants
- Airport Terminal Program
- All Stations Accessibility Program
- Asset Concessions Innovative Financing Technical Assistance
- Assistance for Latest and Zero Building Energy Code Adoption
- Battery and Critical Mineral Recycling
- Bridge Investment Program
- Brownfields Projects
- Brownfields State & Tribal Response Programs
- Building Resilient Infrastructure and Communities (Robert T Stafford Act Section 203(i))
- Bus and Bus Facilities Competitive Grants
- Bus and Bus Facilities Formula Grants
- Capital Investment Grants
- Carbon Capture Demonstration Projects Program
- Carbon Storage Validation and Testing
- Charging and Fueling Infrastructure Grants (Community and Corridor Charging)
- Clean Heavy-Duty Vehicles
- Clean Hydrogen Electrolysis Program
- Clean Hydrogen Manufacturing Recycling Research, Development, and Demonstration Program
- Clean School Bus Program
- Climate Pollution Reduction Grants
- Commercial Driver’s License Implementation Program
- Community Wildfire Defense Grant Program For At-Risk Communities
- Congestion Relief Program
- Consolidated Rail Infrastructure and Safety Improvement Grants
- Contracts And Agreements For Restoration On Federal Lands
- Crash Data
- Dam Safety Program
- Department of Interior Wildfire Management – Preparedness
- Direct Federal Spending For Invasives
- Distance Learning, Telemedicine, And Broadband Program: Broadband Loans
- Distance Learning, Telemedicine, And Broadband Program: Reconnect Program
- Drinking Water State Revolving Funds
- Drought Mitigation
- Earth Mapping Resources Initiative
- Electric Drive Vehicle Battery Recycling And 2nd Life Apps
- Endangered Species Act Recovery Plans
- Energy Efficiency and Conservation Block Grant Program
- Enhanced Mobility of Seniors and Individuals with Disabilities
- Federal-State Partnership for Intercity Passenger Rail Grants
- Financial Assistance To Facilities That Purchase And Process Byproducts For Ecosystem Restoration Projects
- Firewood Banks
- Fish Passage
- Flood Mitigation Assistance Grants (National Flood Insurance Act Sec 1366)
- Formula Grants for Rural Areas
- Four Regional Clean Direct Air Capture Hubs
- Fueling Aviation’s Sustainable Transition through Sustainable Aviation Fuels (FAST-SAF)
- Funding to Address Air Pollution: Clean Air Act Grants
- Funding to Address Air Pollution: Fenceline Air Monitoring
- Grants for Planning, Feasibility Analysis, and Revenue Forecasting (Bridge Investment Program Set-aside)
- Grants For States And Tribes For Voluntary Restoration
- Grants to Facilitate the Siting of Interstate Electricity Transmission Lines
- Grants to Reduce Air Pollution at Ports
- Greenhouse Gas Reduction Fund – Solar for All Program
- Habitat Restoration
- Hazard Mitigation Revolving Loan Funds/Safeguarding Tomorrow through Ongoing Risk Mitigation (STORM) Act (Robert T Stafford Act, Sec 205)
- Hazardous Materials and Emergency Preparedness Grants
- High Priority Activities Program
- High-Efficiency Electric Home Rebate Program
- Implementation of the American Innovation and Manufacturing Act
- Industrial Emission Demonstration Projects
- Investing in Coastal Communities and Climate Resilience
- Local and Regional Project Assistance Grants (RAISE)
- Long-Duration Energy Storage Demonstration Initiative and Joint Program
- Low Income Home Energy Assistance Program
- Low or No Emission (Bus) Grants
- Low-Carbon Transportation Materials Program
- Marine Debris
- Methane Emissions Reduction Program
- Metropolitan Transportation Planning Program
- Middle Mile Grant Program
- National Coastal Resilience Fund
- National Culvert Removal, Replacement, & Restoration Grant
- National Geological And Geophysical Data Preservation Program
- National Infrastructure Project Assistance (Megaprojects)
- Nationally Significant Freight and Highway Projects (INFRA)
- Neighborhood Access and Equity Grant Program
- New Solar Research & Development
- Ocean And Coastal Observing Systems
- Orphaned Well Site Plugging, Remediation, And Restoration
- Pacific Coastal Salmon Recovery Fund
- Pilot Program for Transit Oriented Development
- Pollution Prevention Grants
- Port Infrastructure Development Program Grants
- Preventing Outages and Enhancing the Resilience of the Electric Grid / Hazard Hardening
- Prioritization Process Pilot Program
- Program Upgrading Our Electric Grid and Ensuring Reliability and Resiliency
- Promoting Resilient Operations for Transformative, Efficient, and Cost-Saving Transportation (PROTECT) – Discretionary
- Rail Vehicle Replacement Grants
- Railroad Crossing Elimination Grants
- Reduce, Reuse, Recycling Education and Outreach Grants
- Regional Clean Hydrogen Hubs
- Regional Conservation Partnership Program (RCPP)
- Regional Ocean Partnerships
- Restoration Projects Via States And Tribes
- Rural Surface Transportation Grant Program
- Safe Streets and Roads for All
- Solar Energy Research and Development
- Solar Recycling Research & Development
- Solid Waste Infrastructure for Recycling Infrastructure Grants
- State and Local Cybersecurity Grant Program
- State Digital Equity Competitive Grant
- State Fire Assistance
- State of Good Repair Formula Grants
- Statewide Transportation Planning
- Strategic Innovation for Revenue Collection (Set-aside)
- Strengthening Mobility and Revolutionizing Transportation (SMART) Grants
- Superfund
- Temporary Water Crossing Structures
- Urban and Community Forestry Assistance Program
- Urbanized Area Formula Grants
- Urbanized Area Passenger Ferry Program
- USGS 3D Elevation Program (3DEP)
- Volunteer Fire Assistance
- Water & Groundwater Storage, And Conveyance
- Water Infrastructure Improvements for the Nation, Small and Underserved Communities Emerging Contaminants Grant Program
- Watershed And Flood Prevention Operations
- Weatherization Assistance Program
- Wildlife Crossings Pilot Program
- Wind Energy Technology Program
- Working Capital Fund
-
Corrections
This report was updated on December 23, 2025, to reflect the following changes: State agencies accounted for $34.6 billion, or about 56%, of groups receiving and managing federal infrastructure awards, not $36 billion. Caltrans received 265 federal infrastructure awards, not 262. The California State Water Resources Control Board received 23 awards, not 24. The California Energy Commission received 13 awards, not 12, and the California Public Utilities Commission received $2.1 billion from two federal awards. Additionally, the report now identifies 96 awards incorporating workforce development activities, not 95.
Authors


-
Acknowledgements and disclosures
The authors gratefully acknowledge the Conrad N. Hilton Foundation, the Eli and Edythe Broad Foundation, and the Stuart Foundation for their generous support of this analysis. They also thank Robert Sainz, Lauri Collier, Sean Hughes, New Ways to Work, the California Opportunity Youth Network, and the Los Angeles Opportunity Youth Collaborative for their thought partnership and invaluable assistance.
Natalie Schwartz, Kristen D’Souza, and Ranen Miao provided key research assistance, and the authors also gratefully thank the following people for their insights and feedback during the research and writing process: Frank Alvarez, Christie Cardenas, Elizabeth Cheung, Porsha Cropper, Alexia Everett, Annelies Goger, Michael Graff-Weisner, Manie Grewal, Charles Henkels, Joe Herrity, Jerry Hight, Kim Hughes, Alex Hussain, Carla Javits, Vinz Koller, Armando Loza, Erica Manuel, Louisa Ollague, Tammy Ortuno, Jeffrey Pallin, Gerardo Ruvalcaba, Avin Sharma, Sara Silva, Veronica Soto, Jahrell Thomas, Steve Trippe, and Mark Wilson. Special thanks to Joseph W. Kane for his especially careful and in-depth reviews of written drafts.
The Brookings Institution is committed to quality, independence, and impact.
We are supported by a diverse array of funders. In line with our values and policies, each Brookings publication represents the sole views of its author(s).