Less than two years ago, the Brookings Institution unveiled the research paper, “The Rise of Innovation Districts,” which identified an emerging spatial pattern in today’s innovation economy. Marked by a heightened clustering of anchor institutions, companies, and start-ups, innovation districts are emerging in central cities throughout the world.
A Google search of the term “innovation district” reveals over 200,000 results, indicating the extent to which the phrase has permeated the fields of urban economic development, planning, and placemaking. The term is used to refer to areas, often in the downtowns of cities, where R&D-laden universities or firms are surrounded by a growing mix of start-ups and spin-offs. The term is also increasingly applied to densely populated urban neighborhoods where firms like Google are establishing campuses. But it also pops up to describe new office complexes whose amenities include a few stores or a fashionable coffee shop.
The variation in understanding of the term and its application suggests the need for a routinized way to measure the essential quantitative and qualitative assets of innovation districts. Given this, for the past nine months the Brookings Institution, Project for Public Spaces (PPS), and Mass Economics have collaborated to devise and test an audit tool for assessing innovation districts.
What to count? Considerations in designing an audit
Innovation ecosystems comprise complex, overlapping relationships between firms, individuals, unique spaces, private real estate, public infrastructure, capital, expertise, and conviviality, congregated in a roughly delineated area. To begin to determine how to identify and measure assets, we developed a process that was both rigorous and reflective, drawing together some of the brightest minds in the field, top practitioners on the ground, and a team strong in quantitative analysis.
First, we conducted research across numerous relevant topics including entrepreneurship, real estate development, commercialization, economic geography, city planning, institutional culture, finance, and inclusive development. This exercise generated hundreds of potentially applicable measures for the audit.
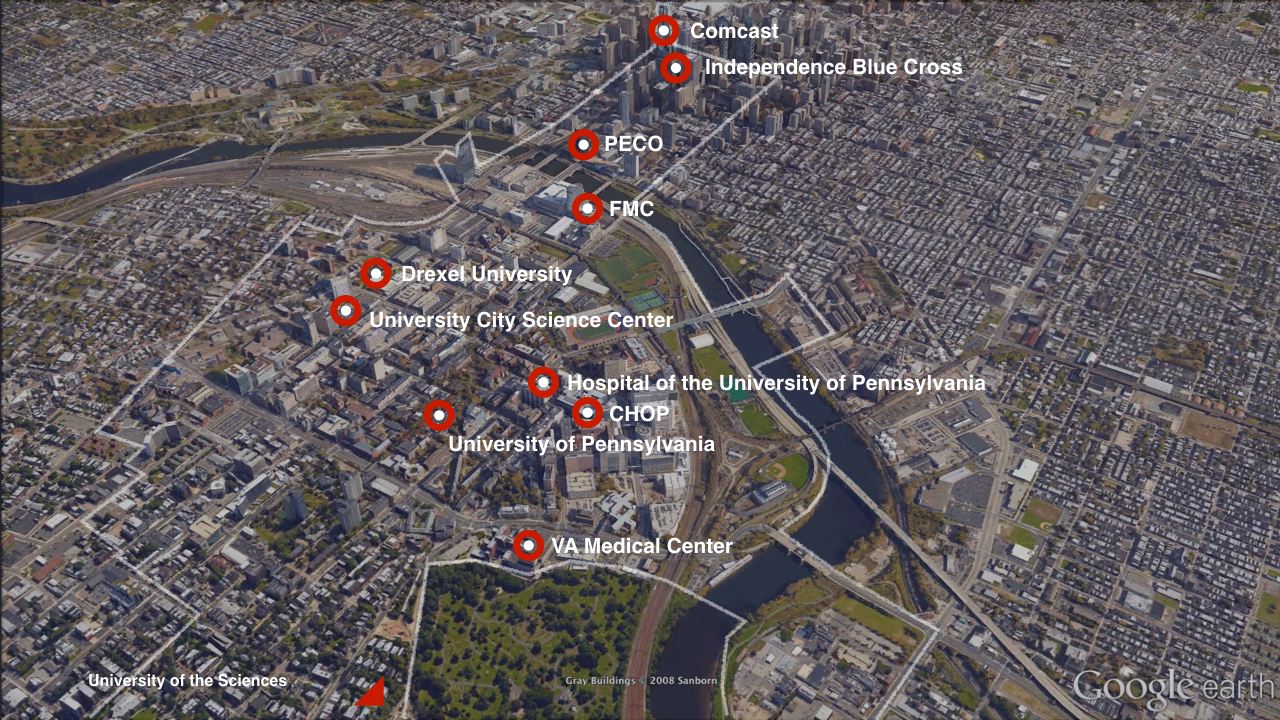 Innovation districts, like in Philadelphia, benefit from the clustering of innovation assets in a dense urban geography that attracts workers, firms, and investment; enables resource-sharing and collaboration; and encourages informal social interactions.
Next, we considered which specific inputs—such as the density of innovation-oriented spaces, the density of talent, and the concentration of quality places—should be bundled and assessed cumulatively. We then tested our theories with experts—both disciplinary specialists and those working between disciplines.
Our research led us to develop several guidelines for the audit, which contribute to its value as an assessment tool:
- An audit should analyze district data against city and regional data. An innovation district rich in growing and emerging clusters of related industries, new firms, and buzzing social networks is only a partial picture of broader economic agglomeration. Because economic clusters and talent pools tend to form at the regional scale, it is important to identify the relationship between a district and the larger metropolitan area. This enables us to discern, for example, whether the strength of the district talent pool is a local phenomenon or part of a broader city or regional trend. Understanding this fuller picture helps in designing strategies to strengthen a district’s ecosystem. A district that is not currently aligned with the sectors driving the broader metropolitan economy nevertheless has the potential to become a research and entrepreneurial hub for leading companies and clusters. The Detroit Innovation District initially grew with minimal relationship to the automotive cluster, but the addition of the American Lightweight Materials Manufacturing Innovation Institute now links the district to the city’s legacy industry.
- An audit should include comparisons across innovation districts. While the scope of the audit measures the performance of individual districts, it is important to be able to benchmark performance against other districts. In broad strokes, innovation districts possess similar research strengths and economic clusters and, although not all data can be analyzed across districts, identifying data that are both useful and comparable across a range of districts will be an important part of the audit design.
- An audit should use qualitative data to identify important factors such as culture. While quantitative data are essential for understanding much of the innovation district machinery, some assets, processes, and relationships simply cannot be quantified. Interviews with stakeholders from universities, incubators, nonprofit organizations, the start-up community, and the public sector are important for identifying particular challenges or flagging opportunities that raw numbers won’t surface. Interviews can also uncover important intelligence about the strength of relationships between institutions and other actors, how well institutional policies and programs are working to help achieve their stated goals, and the extent to which the district culture is supportive, collaborative, and risk taking.
Using these guidelines, we set out to define an audit framework, including the identification of research questions that test specific theories of change.
The audit framework
The first step in developing the audit tool was to better understand what important, measurable elements add up to an innovation ecosystem. With the help of extensive research and the input of experts across numerous fields, we identified five cross-cutting characteristics that likely contribute to an innovation ecosystem: critical mass, competitive advantage, quality of place, diversity and inclusion, and culture and collaboration.
Described below are the key questions and examples of measures for each element:
Critical mass: Does the area under study have a density of assets that collectively begin to attract and retain people, stimulate a range of activities, and increase financing?
Through our research, we determined that several types of data can help answer this question. This includes identifying the concentration of specific innovation assets, such as anchor institutions, co-working spaces, and accelerators, as well as the level or concentration of research dollars. With respect to place assets, the audit looks at the general concentration of place assets and the ratio of built to un-built space. Another important input is employment and population density, comparing these figures to the broader city and region. Lastly, the audit includes data on human capital to determine the concentration of talent.
Future development of this part of the audit may include overall square footages of specific development types. Conversations with real estate investment companies, whose ambitions include growing ecosystems around universities, have revealed that minimum thresholds of research, office, retail, and educational facilities are needed to support an innovation ecosystem.
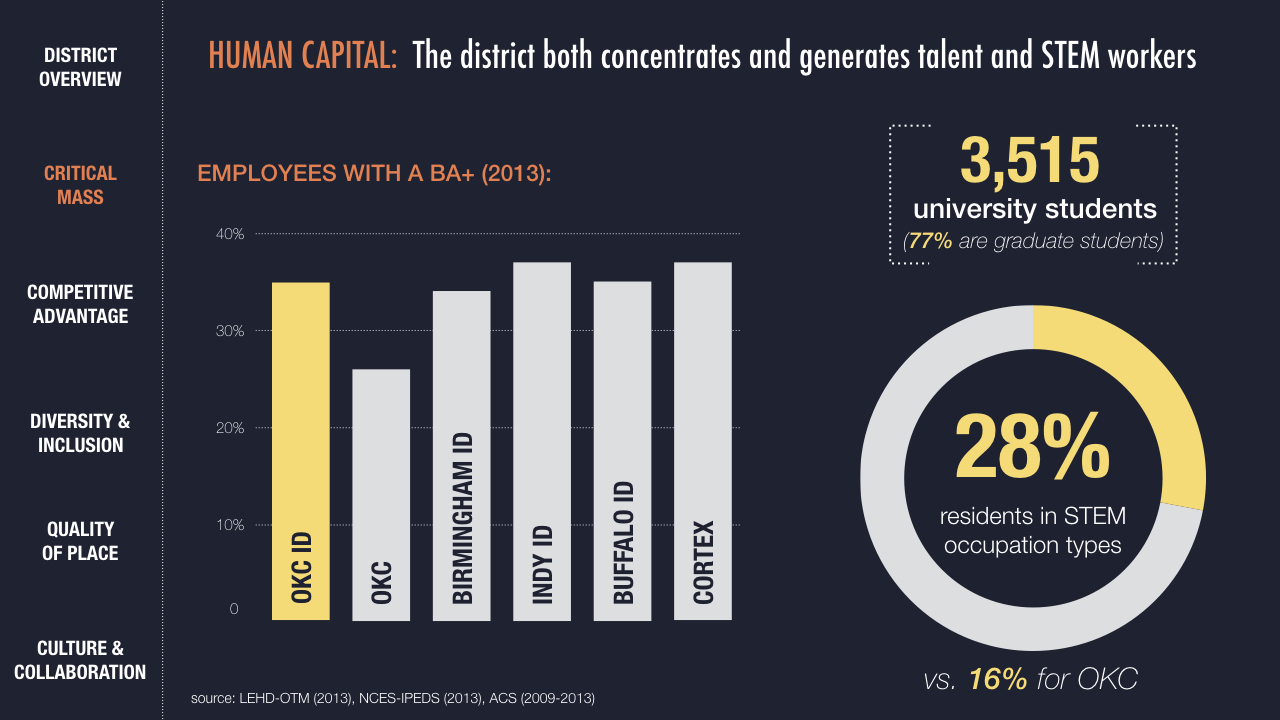
An important piece of assessing a district’s critical mass involves the density of talent in the district.
Competitive advantage: Is the innovation district leveraging and aligning its distinctive assets, including historic strengths, to grow firms and jobs in the district, city, and region?
The audit incorporates the traditional exercise for understanding competitive advantage that identifies an area’s industry-cluster strengths, both generally and along the innovation continuum. In addition, it measures the number of publications, the rating of academic programs, and the number of research awards. To further assess the degree to which research assets are being translated into products, services, and companies, the audit gathers data on commercialization, tech transfer practices, and models of research entrepreneurship. An interesting part of the audit involves assessing the alignment between research strengths and industry clusters. This examination is important because the district can identify opportunities where research strengths are not aligned with employment. Lastly, from the perspective of place, the audit measures whether the built environment reflects cluster strengths. For example, do building façades help heighten the visibility and overall culture of innovation activities across the district?
Quality of place: Does the innovation district have a strong quality of place and offer quality experiences that attract other assets, accelerate outcomes, and increase interactions?
This analysis starts with PPS’s four qualities of great places: uses and activities, access and linkages, comfort and image, and sociability. A combination of surveys, asset mapping, geographic information system analysis, and onsite observations allows an assessment of the overall vibrancy of the area. The analysis pays particular attention to the number, location, and quality of key gathering places within the district, as well as what uses are missing from the overall mix. These factors are important in encouraging cross-disciplinary socializing, broadening the shared benefit of innovation districts to the surrounding community, and encouraging entrepreneurs, investors, researchers, residents, and others to put down roots in the district.

This plaza at the corner of 36th and Walnut Streets in Philadelphia’s innovation district provides a prime example of a quality place.
Diversity and inclusion: Is the innovation district a diverse and inclusive place that provides broad opportunity for city residents?
This audit question aims to help district leaders understand the extent to which a district supports the advancement of local residents in the emerging district economy. Unlike science parks and corridors, innovation districts are commonly surrounded by socioeconomically diverse neighborhoods with many underserved residents. The mere proximity of these neighborhoods creates unique opportunities to grow and develop the diversity of workers in the innovation economy and the supportive industries it generates; to catalyze the local economy through procurement programs and place-based opportunities for entrepreneurship; and to leverage the influence of these districts to secure new amenities and services that would benefit workers and surrounding residents alike.
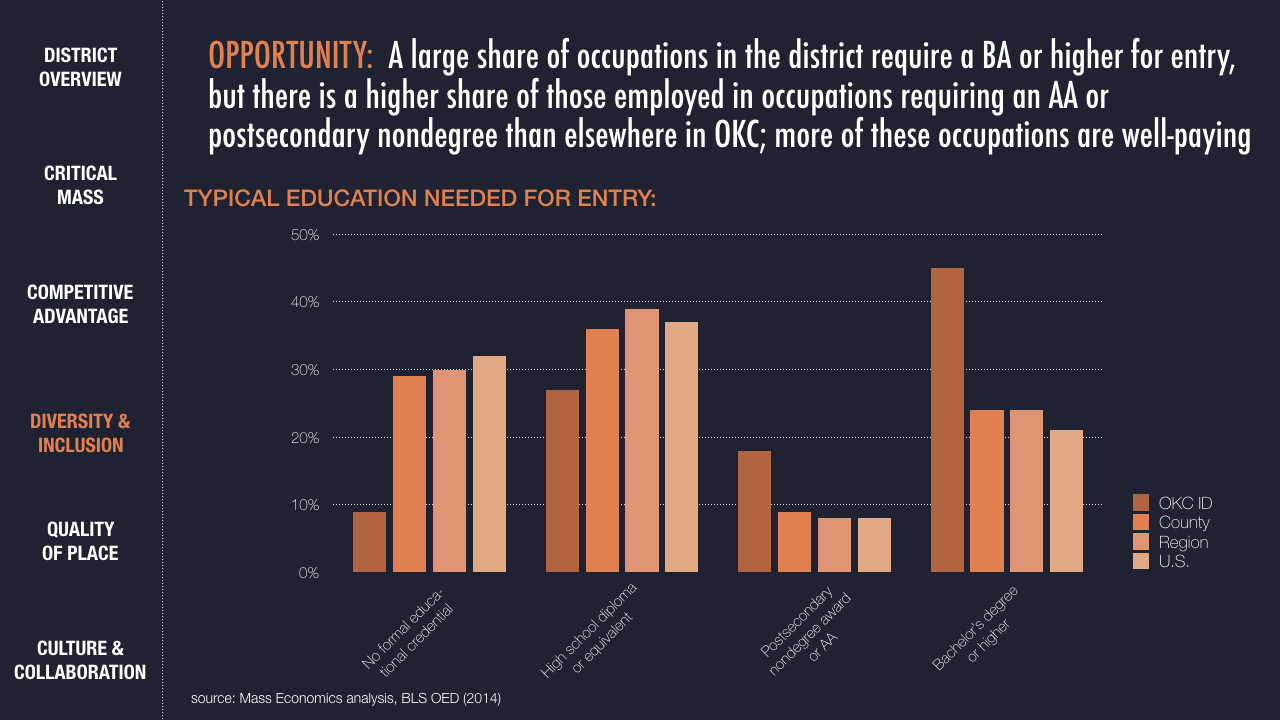
Innovation districts should strive to be diverse and inclusive, qualities that can be measured in a variety of ways. The Oklahoma City innovation district, for example, has jobs that can be filled by local residents who do not have four-year college degrees.
The audit analyzes the demographic composition of the district’s residents and employees as well as of adjacent neighborhoods, and compares those figures to the city or region as a whole. It also seeks to determine whether opportunities for economic inclusion exist based on jobs available and specific institutional practices that support inclusive growth. For example, do anchor institutions have local procurement policies in place to hire local firms and workers? Other specific data include employment by race, income, and educational attainment, and the level of education required for entry into district employment. This assessment also includes place-based measures such as access to healthy groceries, parks, pharmacies, and other basic goods and services.
Culture and collaboration: Is the innovation district connecting the dots between people, institutions, economic clusters, and place—creating synergies at multiple scales and platforms?
Answering this question requires qualitative research to analyze a district’s overall culture and risk-taking environment, and whether physical spaces and programs are cultivating collaboration. In the future, we expect to strengthen and systematize this part of the audit by, for example, using online surveys to scale-up findings and make them comparable across districts.
Testing the audit
Brookings and PPS selected Oklahoma City and Philadelphia for audit testing as part of a larger engagement to support each city’s innovation district. The fact that the two districts have highly differentiated economic clusters and research strengths helps our research because we can discern whether specific data sets can work across very different districts. Of equal value, both districts have highly motivated stakeholders who were willing to engage in the testing and experimentation. Here is the draft audit of the Oklahoma City innovation district, allowing you to see how the analysis is shaping up.
In cases where formal district boundaries did not already exist, PPS and Brookings collaborated with local leaders to define the geography. While we generally do not advocate for places to draw borders—recognizing that market changes will change the geography of innovation—boundaries are essential for data collection and analysis.
Our work moving forward will involve tightening the audit and testing the framework in a third city.
Conclusion
The tremendous complexities embedded in innovation districts are challenging to understand, let alone measure.
As we proceed with fine tuning the audit, we will need to assess whether it will be possible to create a high-level audit that enables innovation districts to assess themselves or whether the audit will demand more intensive data collection, which will require the use of outside experts. In either scenario, our ambition is to write a guidebook to help the local leaders and practitioners think critically about their starting assets.
So if you think you have an innovation district, your best path forward is to undertake an empirically grounded exercise of self-discovery. We believe an evidence-driven assessment will both enable a district to leverage its own distinctive strengths and provide investors and companies with the data necessary to warrant increased investment and business presence. The result will be more businesses, more jobs, more local revenues, and more opportunities for equitable, sustainable growth.
The Brookings Institution is committed to quality, independence, and impact.
We are supported by a diverse array of funders. In line with our values and policies, each Brookings publication represents the sole views of its author(s).






Commentary
So you think you have an innovation district?
March 30, 2016