This post has been revised on August 12th to reflect the following correction:
Estimates of total grant aid presented in this post double-counted certain components of grant aid. The chart and numbers in the text have been revised to reflect corrected estimates. Grant aid now offsets a smaller share of total tuition in each year. Of the remaining net tuition, loans compose a smaller proportion each year and out-of-pocket spending a larger share than originally estimated. However, the trends over time are qualitatively similar: while the ‘sticker price’ of tuition has increased substantially, net tuition has increased only slightly, yet students now borrow considerably more than in the past to pay for their share of tuition.
According to today’s employment report from the Bureau of Labor Statistics, employers added 195,000 jobs in June and an average of 196,000 jobs per month over the last three months, a faster pace of job growth than had been expected. This recent pace of job gains is somewhat more robust than the average pace of 161,000 jobs recorded over the prior three years. The unemployment rate was unchanged at 7.6 percent in June. The broadest measure of employment—the employment-to-population ratio—edged up to 58.7 percent, slightly above its level a year ago. The employment-to-population ratio has remained roughly at this same level since late 2009.
As we have shown in previous Hamilton Project work, there is a sharp divide in employment rates and earnings for American workers by education level. In April 2013, the unemployment rate for individuals twenty-five and older without a high school diploma was over 11 percent, but below 4 percent for those with a college degree. Indeed, because of the vast differences in job opportunities between high school graduates and college graduates, the rate of return to college exceeds 15 percent—far higher than comparable returns on other assets. Although average net tuition—the actual cost to students after grant aid, scholarships, and other financial aid—has increased somewhat over the last two decades, the volume of student loans has increased much more quickly, as has the default rate on loans. As such, many are rightfully concerned about their ability to afford a college education, despite the high return a degree can offer. There is also increasing discussion at the federal level over the rising burden of student loans on recent graduates. This concern is especially salient this week as the interest rate on new federally subsidized student loans doubled to 6.8 percent on July 1st.
In this month’s employment analysis, The Hamilton Project explores several possible explanations for what accounts for the sharp increase in the volume and default rate of student loans. We also continue to explore the nation’s “jobs gap,” or the number of jobs needed to return to pre-recession employment levels.
Rising Student Loan Debt
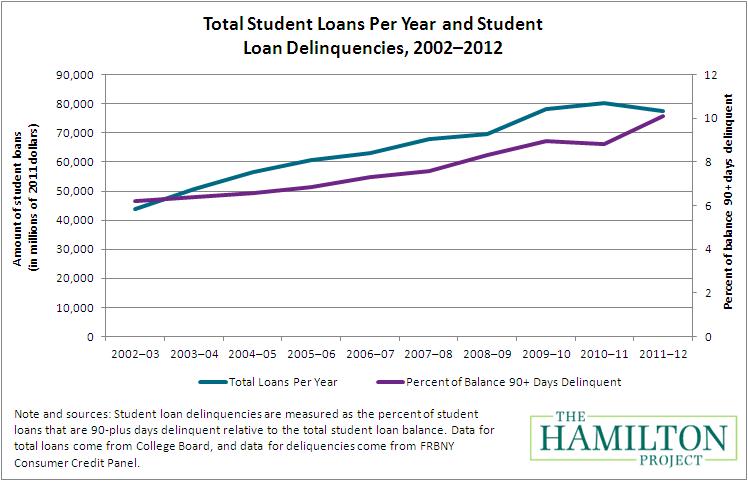
Over the past decade, the volume and frequency of student loans have increased significantly. Nearly one in five American households had outstanding student debt in 2010, as did 40 percent of households headed by a person younger than thirty-five. As shown in the graph below, the volume of student loans grew by 77 percent from 2002 to 2012. In this same period, the average loan debt per full-time student increased by nearly 60 percent, to over $5,500.

The graph also illustrates the increasing trajectory of delinquency rates for student loans. The amount of student loans that are ninety-plus days past due, shown above as a percentage of the national loan balance, has risen by 4 percentage points over the past decade from around 6 percent to over 10 percent. Similarly, the percent of student borrowers whose loans are more than ninety days delinquent increased from under 10 percent in 2004 to about 18 percent in 2012.
Of course, delinquency rates are affected by labor-market conditions. When jobs are scarce, it is harder for many recent graduates to repay their student loans. For instance, in 2005 the unemployment rate for twenty-five to thirty-four-year-olds who attended some college but did not obtain a bachelor’s degree was 5.4 percent. The unemployment rate for this same group had increased to 10.1 percent by 2012. The unemployment rate rose from 2.6 percent in 2005 to 4.1 percent in 2012 for individuals in this age group with a bachelor’s degree or higher. Indeed, worsening labor-market conditions in the past decade are likely to have hindered students’ abilities to repay their student loans. That being said, higher unemployment rates are unlikely to be the only cause of rising delinquencies or of the increases in debt that had already begun before the onset of the Great Recession.
Why Is Student Debt Growing?
The increase in loans and defaults over such a short time is puzzling. One possible explanation for the growing number of student loans is that tuition has increased, but the data suggest otherwise. While the “sticker price” of attending college has increased over the past decade and continues to do so, net tuition—the price that the average student actually pays after financial aid—has increased at a much lower rate. As we showed in earlier work, net in-state tuition and fees at public four-year colleges have only increased by an average of $1,420 since 2002, which is less than half of the increase in the published rate of $3,450. At private four-year colleges, published tuition has increased by an average of $6,090 since 2002, while net tuition has only increased by $230. Overall, average net tuition has therefore increased only 13 percent over the last ten years—far below the 77 percent increase in student debt. See the technical appendix for a description of the calculations behind this and other figures cited in this report.
Similarly, rising debt is not simply the result of higher student enrollment. The number of undergraduates (full-time and part-time) increased from approximately 14 million in 2002 to just over 18 million in 2011. Enrollment, while up, increased only 27 percent.
This means that neither college enrollment nor net college tuition has risen enough over the past decade to explain the rapid upsurge in student debt. Instead, this phenomenon seems to be driven by an increase in the share of student-loan borrowing used to finance each dollar of college tuition.
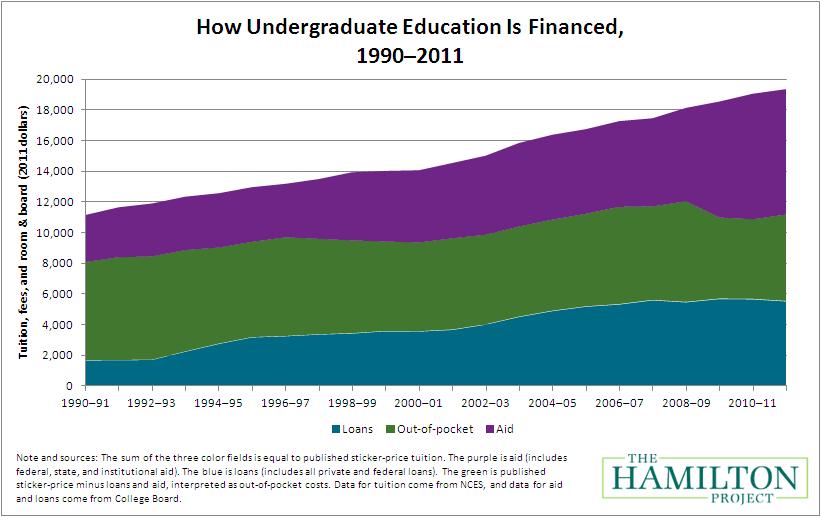
The graph below shows how undergraduate education was financed between 1990 and 2011, breaking down published tuition into aid (including federal, non-federal, and private grants; work study programs; and tax credits), federal and non-federal loans, and the remainder, which we call out-of-pocket costs. The graph shows that while the sticker price of tuition has increased steadily, the net cost—represented as the sum of the green and blue areas—has been relatively flat.

By focusing on just the blue and green sections of the graph, it is possible to observe the trends occurring within net tuition—how students and families finance the tuition they are responsible for covering. It is evident that an increasing percentage of average net tuition is being financed by loans, even though net tuition has not increased much in magnitude over recent decades. In 2000, the average student borrowed only 38 percent (or about $3,600) to finance their tuition, whereas over the past three years, these loans have grown to nearly 50 percent (or $5,500) of net tuition costs.
It is not clear what accounts for this dramatic increase in the share of college tuition that American families finance through borrowing, but there are a number of possibilities worth further study:
The Great Recession, which reduced family income and assets, may have left families with fewer resources available to pay directly for college and may have lead to greater reliance on student loans.
The sharp contraction in the availability of many other forms of credit during and after the financial crisis—from personal loans to second mortgages—made it more difficult to borrow from traditional sources and therefore may have encouraged families to rely more on student loans instead of other means of borrowing.
Student loans may have become relatively more available because of changes in the laws protecting creditors, which may have encouraged lenders to offer loans to a broader set of less creditworthy borrowers.
The increase in enrollment in for-profit colleges, whose students rely more on federal aid and student loans, may have shifted the composition of students toward groups more likely to take out student loans.
Changes in the composition of the student body more generally, such as an increase in enrollment of students from lower- or middle-income households may have increased the proportion of students taking out loans.
It is currently unclear how important a role each of these factors plays in explaining the recent increase in debt, or whether some other factors are the cause. The extent to which the upsurge in student loans is an urgent problem depends, in large part, on why students are borrowing more to finance college and the broader economic challenges behind this trend.
The June Jobs Gap
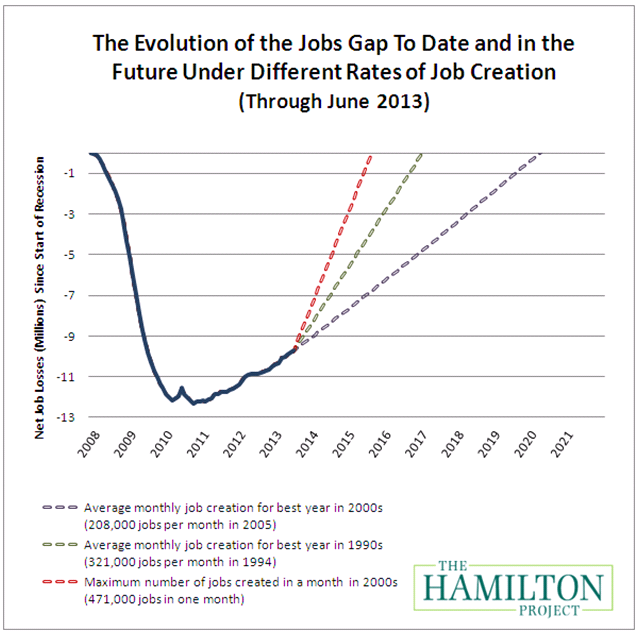
As of June, our nation faces a jobs gap of 9.7 million jobs. The chart below shows how the jobs gap has evolved since the start of the Great Recession in December 2007, and how long it will take to close under different assumptions of job growth. The solid line shows the net number of jobs lost since the Great Recession began. The broken lines track how long it will take to close the jobs gap under alternative assumptions about the rate of job creation going forward.

If the economy adds about 208,000 jobs per month, which was the average monthly rate for the best year of job creation in the 2000s, then it will take until April 2020 to close the jobs gap. Given a more optimistic rate of 321,000 jobs per month, which was the average monthly rate of the best year of job creation in the 1990s, the economy will reach pre-recession employment levels by January 2017.
To explore the outcomes under various job creation scenarios, you can try out our interactive jobs gap calculator by clicking here. You can also view the jobs gap chart for each state here.
Conclusion
There is growing concern around the rising student debt load and delinquency rates on student loans. The increasing debt burden represents a drag on recent graduates and also serves as a deterrent to would-be students who may question the trade-off between the debt burden and the payoff of a college degree. Addressing these challenges requires a better understanding of how students pay for college, both through the lens of how policies affect affordability and also how those policies promote educational attainment and skills.
To examine these and other related issues, The Hamilton Project is releasing a number of papers focusing on the role of education in social mobility and the importance of increasing access to higher education. A forum hosted by the Project last week featured a new proposal by Caroline Hoxby of Stanford University and Sarah Turner of the University of Virginia that outlines a strategy for identifying promising low-income, high-achieving students and providing them with customized information to help improve their college opportunities, and a new Hamilton Project paper that explores the role of higher education in social mobility. In September, The Hamilton Project will continue its focus on higher education with the release of two new policy proposals: one on how to improve the Pell program to increase access and affordability of college while also promoting college completion, and the other on how to reduce the debt burden on recent college graduates and reduce the likelihood of delinquency.
The Brookings Institution is committed to quality, independence, and impact.
We are supported by a diverse array of funders. In line with our values and policies, each Brookings publication represents the sole views of its author(s).


Commentary
Rising Student Debt Burdens: Factors Behind the Phenomenon
July 5, 2013