
Introduction
College education is an important driver of both economic mobility for individuals and growth for the economy overall. Educational attainment has increased substantially in recent decades, but gaps in college enrollment and completion rates by socioeconomic status and race or ethnicity are substantial. The gender gap, which historically favored boys and men, closed and reversed so that now women are substantially more likely to pursue and complete higher education than men.
Students with strong grades and test scores who pursue a rigorous course of study tend to be more academically prepared for and are more likely to attend and complete college. Differences in opportunity and support, both in and out of school, lead to significant group differences in academic preparation. In an earlier report, we showed that for a recent cohort of high schoolers, much—in some cases all—of those gaps can be attributed to differences in measures of academic preparation at the end of high school, consistent with other research studying earlier cohorts.1
In this report, we build on this earlier work to ask: How have disparities in academic preparation and college enrollment, by socioeconomic status (SES), gender, and race/ethnicity changed over time? We use data from the National Center for Education Statistics (NCES) for four cohorts—who graduated from high school in 1982, 1992, 2004, and 2013. We build on earlier work by studying all four cohorts and the three categories (SES, gender, and race) using a consistent method.
The results show that most of the patterns of disparities documented in our earlier report for the 2013 cohort, as well as the critical role of differences in academic preparation, have been broadly consistent since the 1982 cohort.
There are a few notable exceptions to this consistency: First, gender gaps (favoring women) in both any and four-year college enrollment increased across cohorts, largely reflecting growing gender gaps in academic preparation.
Second, enrollment in any college increased substantially more for Hispanic high school graduates than any other group between 1982 and 1992, closing the Hispanic gap with other groups; but there was no comparable closing of gaps in four-year college enrollment. Similarly, the white-API gap (favoring API students) in any college enrollment declined, though more modestly, between 1982 and 1992, with no comparable change in the four-year enrollment gap.
Finally, the college enrollment gaps between high school graduates from the top and bottom quintiles of SES were large in all cohorts. The SES gap for any enrollment declined significantly through 2004 and has stalled since. Virtually no progress was made in closing the four-year enrollment gap between the top and bottom SES quintiles since 1982.
Inequality across groups in college enrollment has been persistent. The analysis suggests that much of this inequality in college enrollment—especially when considering disparities by race or gender—was related to disparities in academic preparation. SES gaps—especially for four-year college enrollment—were consistently large and not as well-explained by differences in academic preparation as for other group disparities.
This analysis identifies disparities in academic preparation as an important proximate cause of college enrollment disparities across groups. SES, gender, and race disparities in academic preparation likely have overlapping but distinct underlying causes, but in each case, they reflect persistent group differences in opportunities to learn that policymakers should work to address.
Data and Methods
In this report, we address three related questions:
1) How have gaps in college enrollment by socioeconomic status, gender, and race/ethnicity changed over recent cohorts?
2) How have gaps in academic preparation changed since 1982?
3) Has the role that academic preparation plays in explaining college enrollment gaps changed? How have gaps in college enrollment changed for students with different backgrounds who have similar academic preparation?
We follow a similar approach as in Reber and Smith (2023), using additional longitudinal surveys collected by the National Center for Education Statistics (NCES). The NCES longitudinal surveys cover the cohorts who graduated from high school in 1982, 1992, 2004, and 2013. We harmonize the definitions of key variables across the surveys as much as possible.
We briefly describe here the outcome variables, measures of academic preparation, and how we categorize students by socioeconomic status, race, and gender. See the Data Appendix for more detail on how we construct the variables and sample used in the analysis.
Socioeconomic status, gender, and race measures
For socioeconomic status, we use the index constructed by the NCES for each survey, dividing students into quintiles. The SES index is based on the education, occupation, and income of the student’s parent or guardian.
We use reported biological sex (coded as male or female) as a proxy for gender in all cohorts. (Following the literature, we use the term “gender” and “gender gaps,” rather than “sex” or “sex gaps.”)
Race and Hispanic ethnicity were collected in separate questions for all four cohorts. The race categories changed somewhat across surveys. Starting with the 2013 cohort, the “Asian and Pacific Islander” category was split to separate “Asian” and “Native Hawaiian or Pacific Islander” categories. Additionally, there is only an “other race” category for the 1982 cohort. Starting with the 2004 cohort, respondents could choose more than one race.
We classify respondents in mutually exclusive race/ethnicity categories: Hispanic (of any race), non-Hispanic American Indian or Alaska Native (AIAN), non-Hispanic Asian or Pacific Islander (API), non-Hispanic Black, non-Hispanic white, and non-Hispanic other (which can include either “multiracial” or “other race” respondents, depending on the cohort). For ease of exposition, we refer to race (rather than race/ethnicity) and drop the non-Hispanic modifier. We include all respondents in the analysis, but we do not discuss the estimates for groups where the sample sizes are too small to make reliable estimates.
Outcome measures
We divide students into three mutually exclusive college enrollment categories based on enrollment by institution type in the first 18 months following expected high school graduation (summer of the expected graduation year through the following December):
- Enrolled in a four-year college
- Enrolled in a two-year college
- Did not enroll in college
A student is coded as enrolled in an institution if they ever enrolled during the relevant window. If they enrolled in both a two-year and a four-year college at some point, we consider them a four-year college enrollee. This variable is based on the highest degree awarded at the institution rather than the program in which the student was enrolled.2
Differences in two-year college-going rates can be difficult to interpret; when two-year college enrollment rates are lower, that could be because more people enrolled in a four-year college or because more people didn’t enroll in any college. We therefore focus on two variables: whether the student ever enrolled in a four-year college and whether they enrolled in either a two-year or four-year college, which we refer to as “any college.”
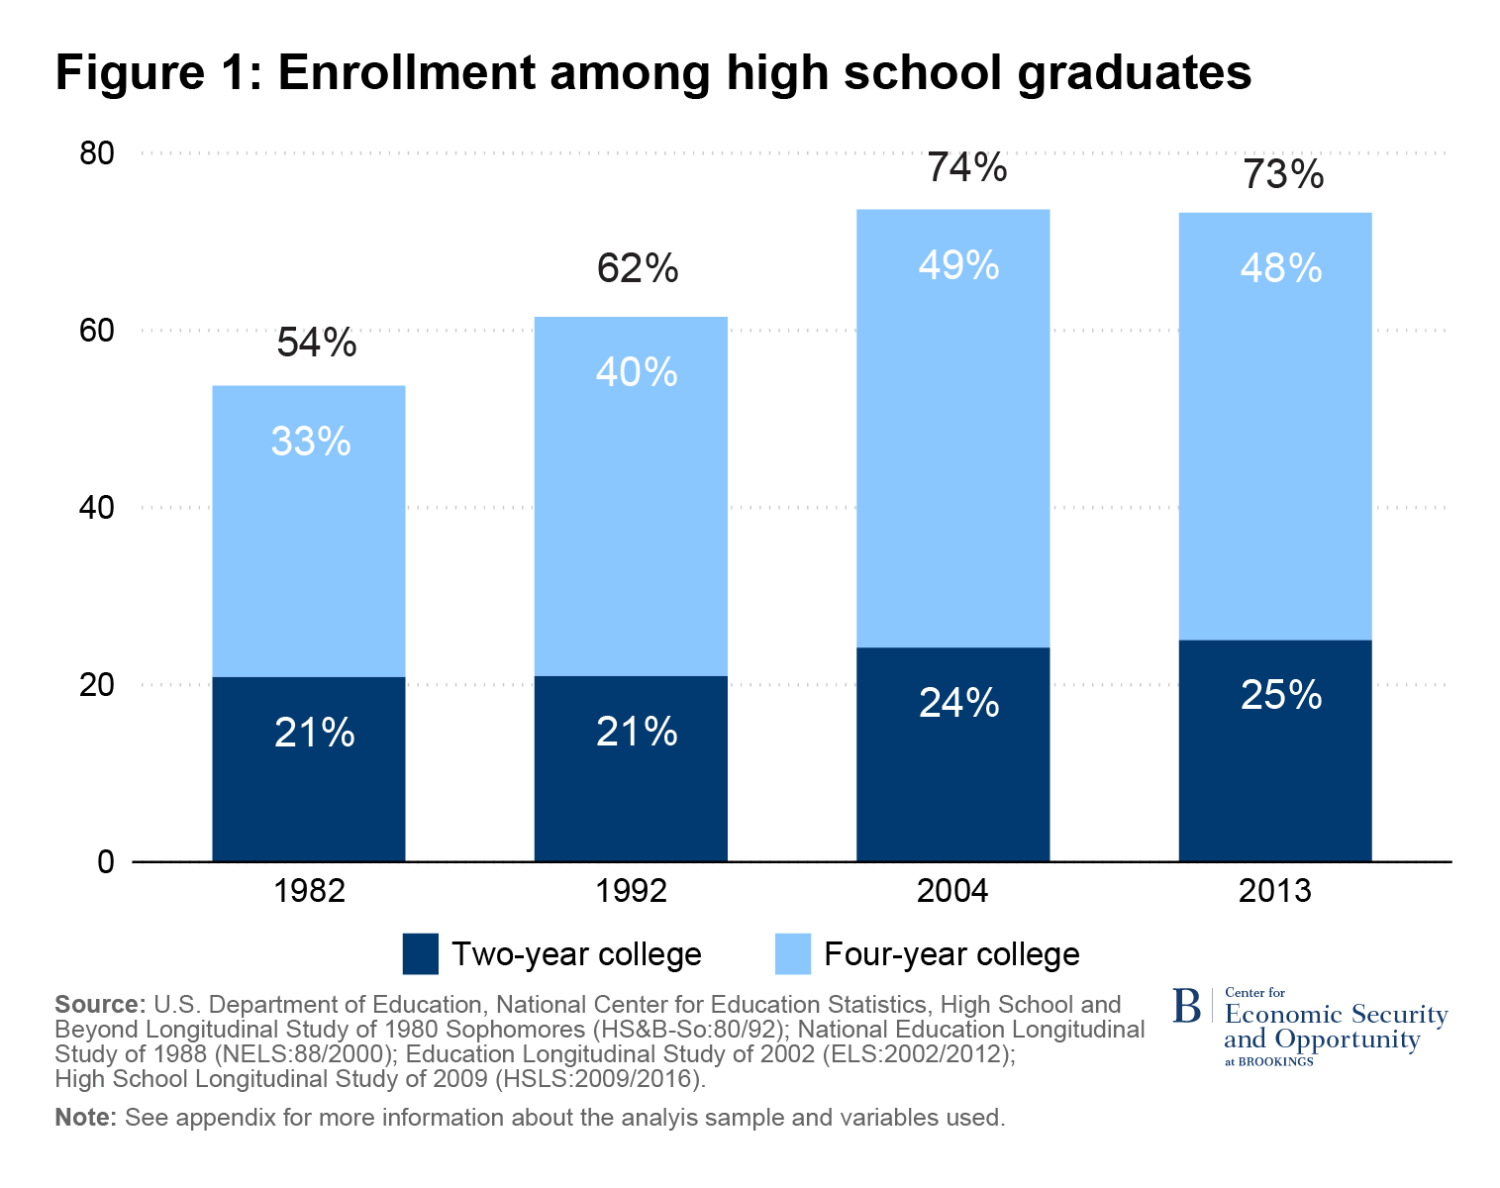
Figure 1 shows college enrollment rates among high school graduates for the four cohorts, for any college and four-year college enrollment. Overall college enrollment rates steadily increased between 1982 and 2004, with growth concentrated among four-year college enrollment. After 2004, enrollment appears to have leveled off.
Academic preparation measures
We divide our measures of academic preparation into two broad categories: test scores and measures of in-school preparation. The available measures differ somewhat across surveys. For example, in the two earlier surveys, both reading and math tests were administered, but only math tests were administered in the later surveys. The later surveys include more detail on the number of AP/IB courses and advanced math a student took. For our main analysis, we rely on a set of control variables that is available across all surveys: (1) academic GPA (in deciles), (2) math test score (in deciles), (3) indicator for any AP/IB participation, and (4) indicator for advanced math course.
We check the sensitivity of the findings in each survey to including a fuller set of academic preparation measures that are not available for all surveys (such as the reading test score, which is only available for the two earlier cohorts). The results tend to be quite similar, suggesting these four measures do a good job of capturing academic preparation relevant for enrollment in college.
We also summarize the academic preparation variables by generating a “predicted enrollment” for each student. This is the probability that a student will enroll in college based on the four measures of academic preparation described above.3
Summary statistics for both the college enrollment outcomes and the academic preparation measures, overall and separately by group, are reported in Appendix Tables 1a-1c.
Methods
To assess the role of differences in academic preparation in explaining differences in college enrollment outcomes for students in different socioeconomic status (SES) quintiles, we estimate simple linear regressions of the outcomes on group indicators, with and without controls for academic preparation. For example, for SES, we estimate linear regressions of the following form:
![]()
where yi is a college enrollment outcome equal to one if student i was enrolled in the first 18 months after expected high school graduation. SESQ1i is an indicator variable equal to one if student i was in the first quintile of the index of SES, and similarly for the other SESQ variables; the middle quintile is the omitted category. We estimate this regression with and without a vector of controls for academic preparation (Xi) described above.
In the regression with no controls (no Xi), β1 is simply the difference between average college enrollment for the first quintile and the third quintile (the omitted category), β2 is the difference between the average enrollment for the second and third quintiles, and so on for the other β coefficients.
When we add controls for academic preparation (Xi), the coefficients represent the expected differences in enrollment by quintile among high school graduates with similar academic preparation. We estimate several versions of the equation with different combinations of controls, but for parsimony we report only on the two versions described above—no controls and the set of controls that are available across surveys.4
We estimate analogous regressions for gender and race. We restrict the sample to those who graduated “on time” from high school.5 We do this mainly because many respondents who did not graduate from high school on time are missing data on key measures of academic preparation, so many of them would be dropped from the analysis in any case.6 Excluding all non-completers makes it easier to interpret the results. However, this means that we may underestimate gaps in college enrollment among all respondents because the most disadvantaged and least academically prepared students are not in the sample because they did not complete high school.
Results
In this section, we present the results by socioeconomic status, gender, and race, in turn.
Socioeconomic Status
With five SES quintiles, there are 15 possible two-way comparisons we might track across cohorts (e.g. first versus second, first versus third, and so on). We focus in this discussion on the gap between the top and bottom quintiles, and present figures showing trends for each quintile compared to the middle quintile in the appendix.
Figure 2 shows the trend in the gap between the top and bottom SES quintiles (that is, the coefficient on SES Q5 minus the coefficient on SES Q1, with 95% confidence intervals), with and without controls. The blue line in the first panel shows trends in the without controls gap in any college enrollment: In the 1982 cohort, top SES quintile high school graduates were over 50 percentage points more likely to enroll in college. The gap between the first and fifth quintiles then declined to 46, 34.1, and 33.5 percentage points in successive cohorts7
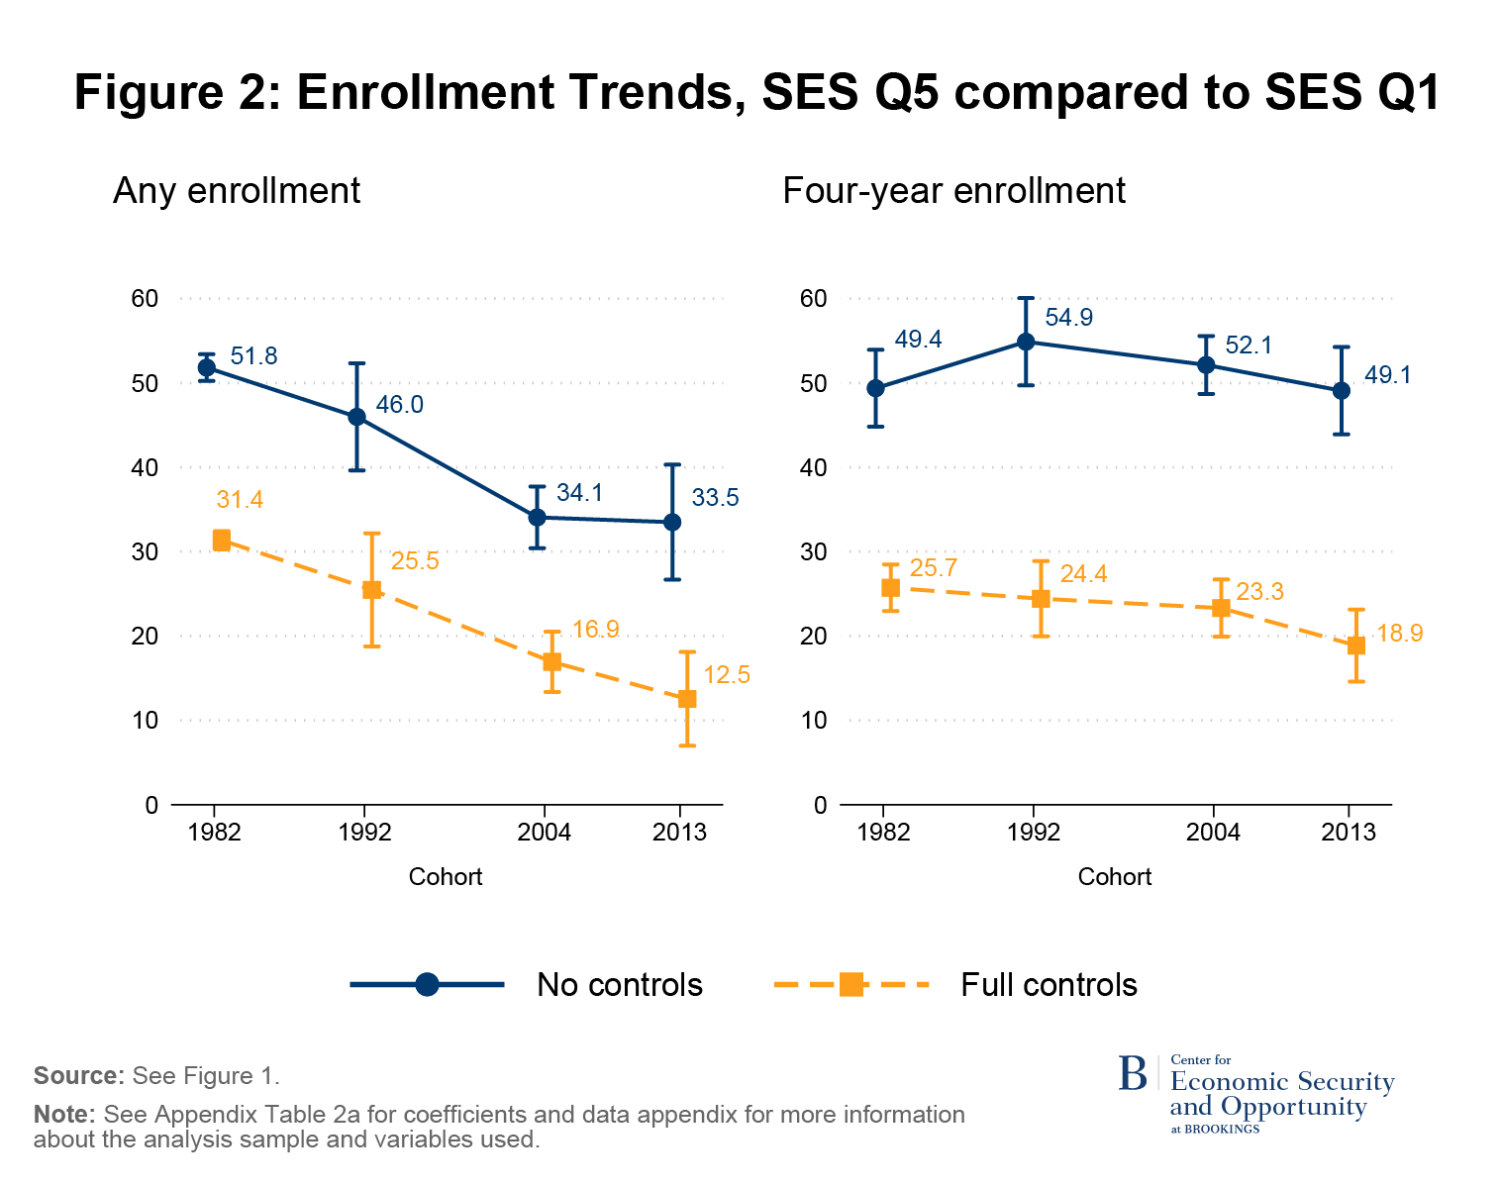
The orange dashed line indicates that, among high school graduates with similar grades, AP/IB participation, advanced math course-taking, and test scores, the gaps in college enrollment were quite a bit smaller than the without controls gaps (the blue line), but still large. For academically similar high school graduates, the gap between the first and fifth SES quintiles was 31 percentage points in 1982, 20 percentage points lower than the without controls gap.
Not surprisingly, the same pattern holds for all the cohorts—the gaps were much smaller, but not zero—among academically similar high school graduates compared to the without controls differences (the orange dashed line is below the blue line). The SES gaps among academically similar high school graduates shrunk more than the without controls gaps did. In the most recent 2013 cohort, the gap in college enrollment between the first and fifth quintiles was 34 percentage points among all high school graduates, but only 13 percentage points controlling for academic performance.
SES gaps in four-year college enrollment have not declined as much as for any college enrollment, and they have increased in some parts of the SES distribution. The second panel of Figure 2 shows that, compared to the bottom quintile, four-year enrollment among top quintile high school graduates increased slightly in the 1992 and 2004 cohorts before decreasing again for the 2013 cohort. The gap between the bottom and top quintiles is statistically indistinguishable across cohorts. The second quintile got closer to the third quintile, and the fourth quintile pulled away from the lower quintiles somewhat (shown in Appendix Table 1a); but overall, SES gaps in four-year college enrollment did not improve much since the 1982 cohort.
In the second panel of Figure 2, the orange line shows the top-bottom quintile SES gap in four-year college enrollment, controlling for academic preparation. Among high school graduates with similar academic preparation, gaps were smaller, though still substantial. Between the 1982 and 2013 cohorts, the gap between fifth and first quintile high school graduates declined by about 7 percentage points.
This pattern of results—where the without controls gap was essentially the same in 2013 as 1982 but the with controls gap was smaller—suggests that SES-related gaps in academic preparation increased across cohorts, but that was offset by a decline in gaps in four-year college enrollment among high school graduates with similar academic preparation. Indeed, Appendix Table 1a shows that the top-bottom SES quintile gap in several measures of academic preparation has increased. For example, in the 1982 cohort, the average academic GPAs were 2.2 and 2.7 for HS graduates from the first and fifth SES quintiles, respectively, for a gap of about 0.5 points. By the 2013 cohort, average GPAs increased somewhat for all SES quintiles, but the gap between the top and bottom quintiles grew to about 0.8 points. This pattern—preparation increased overall, but faster in the top quintile —generally holds across measures of academic preparation. The gap between the top and bottom quintiles in four-year “predicted enrollment” (reported in Appendix Table 1a) grew from 29 to 34 percentage points during this time period.
Prior evidence about changes in the high school SES achievement gap is mixed: Some research suggests that the gap has grown over time, while other research suggests that gaps have remained relatively unchanged or narrowed.
Gender
Figure 3 shows trends in the gender gap—positive values indicate females had higher enrollment rates than males. The first panel shows that female high school graduates were more likely than their male counterparts to enroll in any college across all cohorts, and the gap grew over time. The male-female gap in any enrollment grew from 3 percentage points for the 1982 cohort to 7 percentage points for the 2013 cohort.8 Controlling for academic preparation (the dashed orange line), the gender gap ranged from 1 to 4 percentage points, depending on the cohort (and we cannot reject the null hypothesis that the coefficient is the same in all cohorts).
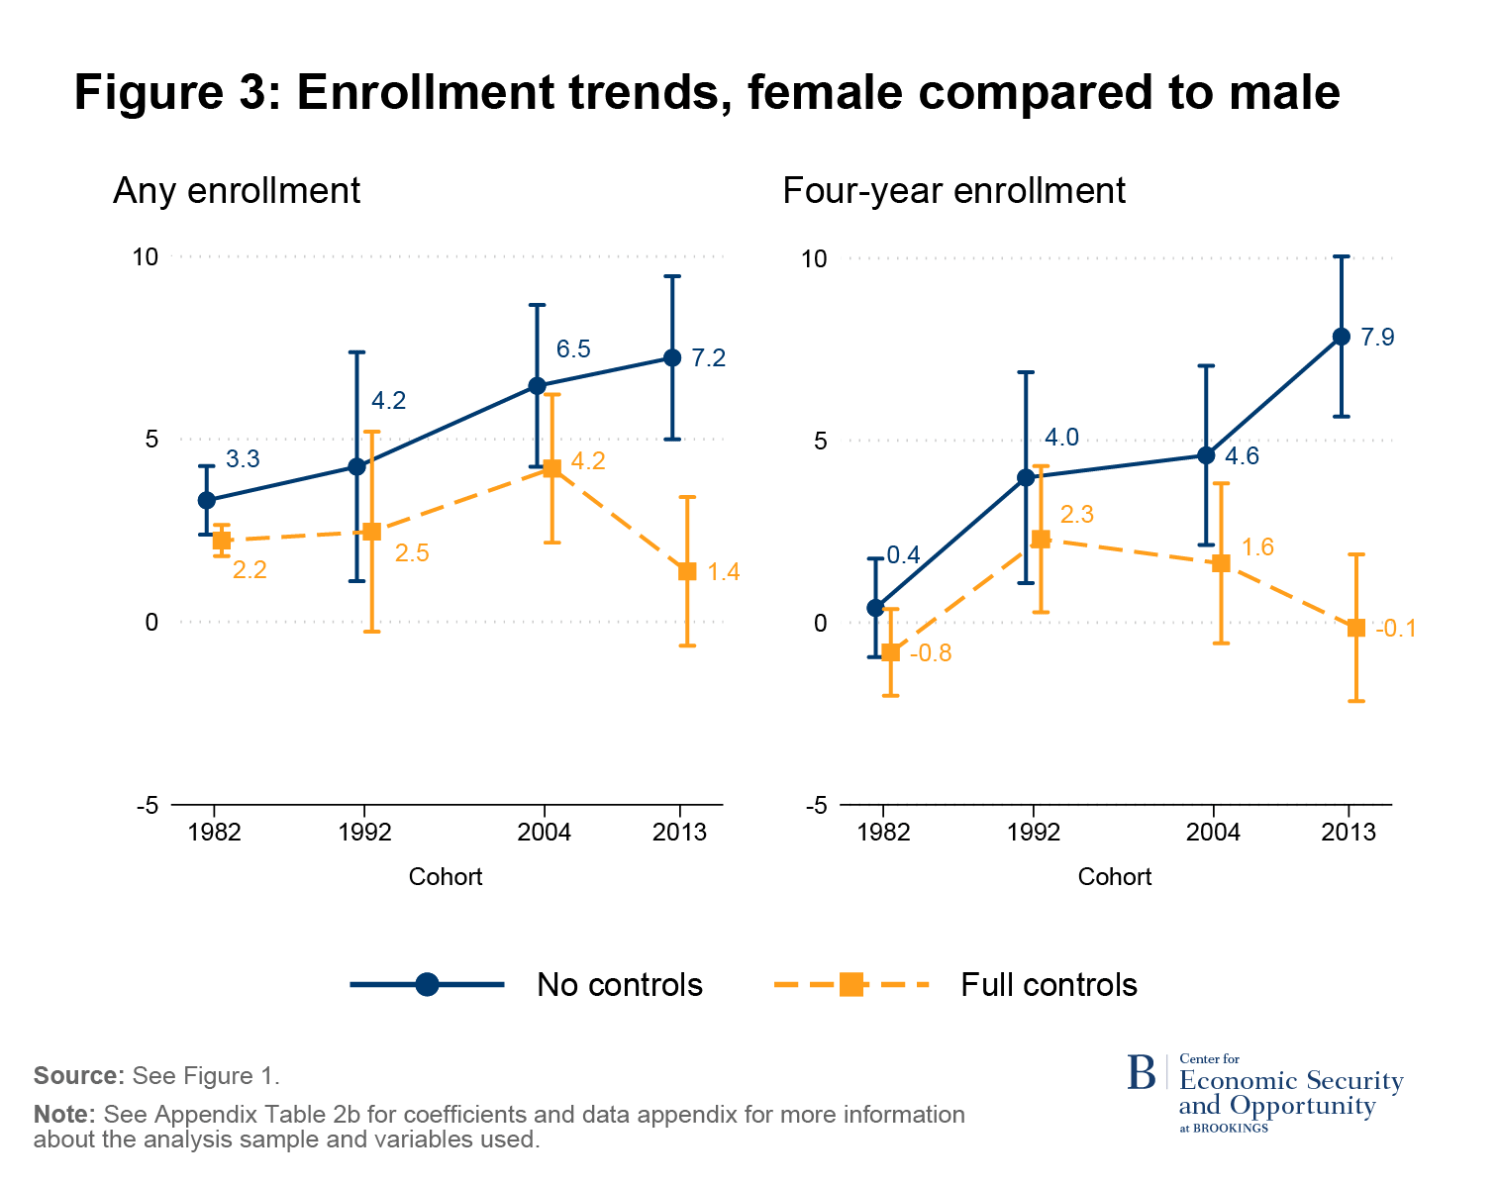
The second panel shows the results for four-year enrollment. Male and female high school graduates in the 1982 cohort were about equally likely to enroll in a four-year college; a gender gap of 4 percentage points emerged for the 1992 cohort, growing to 5 percentage points for the 2004 cohort, and 8 percentage points for the 2013 cohort. Controlling for academic preparation, the gender gap in four-year college enrollment ranged from -1 to 2 percentage points (and was not statistically significantly different from zero, except in 1992).
That is, across all four cohorts, gender gaps in four-year college enrollment were about what would be predicted based on gender gaps in high school preparation. The gender gap in four-year enrollment increased over time because the gender gap in academic preparation increased. This growing academic preparation gap can also be seen in the summary statistics in Appendix Table 1b. For example, between the 1982 and 2013 cohorts the gender gap in academic GPA increased from 0.28 to 0.30, and the gap in our summary measure of academic preparation (“predicted four-year enrollment”) increased from 1 to 8 percentage points.
In their analysis of the 2013 cohort, Reber and Smith (2023) showed that in-school measures of academic preparation (such as grades and advanced course-taking, which they refer to as “high school performance”) do more to explain gender gaps than do test scores.9 This is in contrast to analysis of gaps by SES and race, where controlling for in-school measures, test scores, or both produce similar results. This was also true in the additional cohorts we examine here (results not reported).
Race
Figures 4a to 4d report the findings by race. Unfortunately, the sample of American Indian and Alaska Native (AIAN) students is too small to produce reliable estimates; the “other” category is also relatively small and its definition changes over time.10 With four racial groups (API, Black, Hispanic, and white), there are multiple comparisons of interest. For purposes of the regression, we choose white as the omitted category because it is the numerically largest group in the sample, but here we show separate figures for each group, comparing the focal group to each of the others. This approach makes it easier to compare trends for different groups and avoids privileging comparisons to the omitted category (in this case, whites). Each panel shows the figure’s focal group compared to another racial group, with the focal group listed first in the panel title. For example, the Hispanic-API panel shows the coefficient on the Hispanic indicator minus the coefficient on the API indicator, with and without controls for academic preparation. Negative gaps indicate that the focal group has a lower enrollment rate than the comparison group, and vice versa.
Figure 4a shows the results for Hispanic high school graduates. Across all cohorts, Hispanic high school graduates generally had the lowest overall and four-year enrollment rates. Starting in 1982, the largest racial gaps were between API and Hispanic high school graduates. While the Hispanic-API four-year enrollment gap hovered around 30 percentage points across all cohorts, the Hispanic-API any enrollment gap dropped from about 38 to 17 percentage points between the 1982 and 1992 cohorts. After this decline, it remained relatively stable through the 2013 cohort. Academic preparation gaps explain most of the API-Hispanic enrollment gaps, particularly for four-year enrollment and any enrollment from 1992 onwards.
Both the any and four-year enrollment rates among Hispanic high school graduates were about 20 percentage points below those of white high school graduates in 1982. However, while the four-year enrollment gap remained relatively stable, the gap in any enrollment dropped to 8 percentage points in the 1992 cohort and then continued to hover around this lower level. Across all cohorts, academic preparation appears to account for most of the white-Hispanic gap in enrollment outcomes.
Hispanic enrollment rates have been closest to Black enrollment rates across cohorts. For the 1982 cohort, Black high school graduates were about 12 percentage points more likely to enroll in both any college and four-year college, compared to Hispanics. While the Hispanic-Black four-year enrollment gap slightly increased in later cohorts, the any enrollment gap shrunk starting with the 1992 cohort. Unlike the other comparisons to Hispanic high school graduates, the Hispanic-Black enrollment gap wasn’t significantly altered after controlling for academic preparation.
Overall, while four-year enrollment gaps between Hispanics and other groups were relatively stagnant since 1982, there was a significant reduction in gaps in enrollment in any college, driven by a decline between the 1982 and 1992 cohorts. Consequently, as of 2013, the gap in four-year college enrollment between Hispanic high school graduates and the other groups, was substantially larger than were the gaps for any college enrollment. Controlling for academic preparation, enrollment gaps between Hispanics and API and white high school graduates, respectively, were smaller than the without controls gaps. On the other hand, the gap with Black high school graduates was more similar with and without controls for academic preparation; this is because Black and Hispanic high school graduates had similar academic preparation on average.
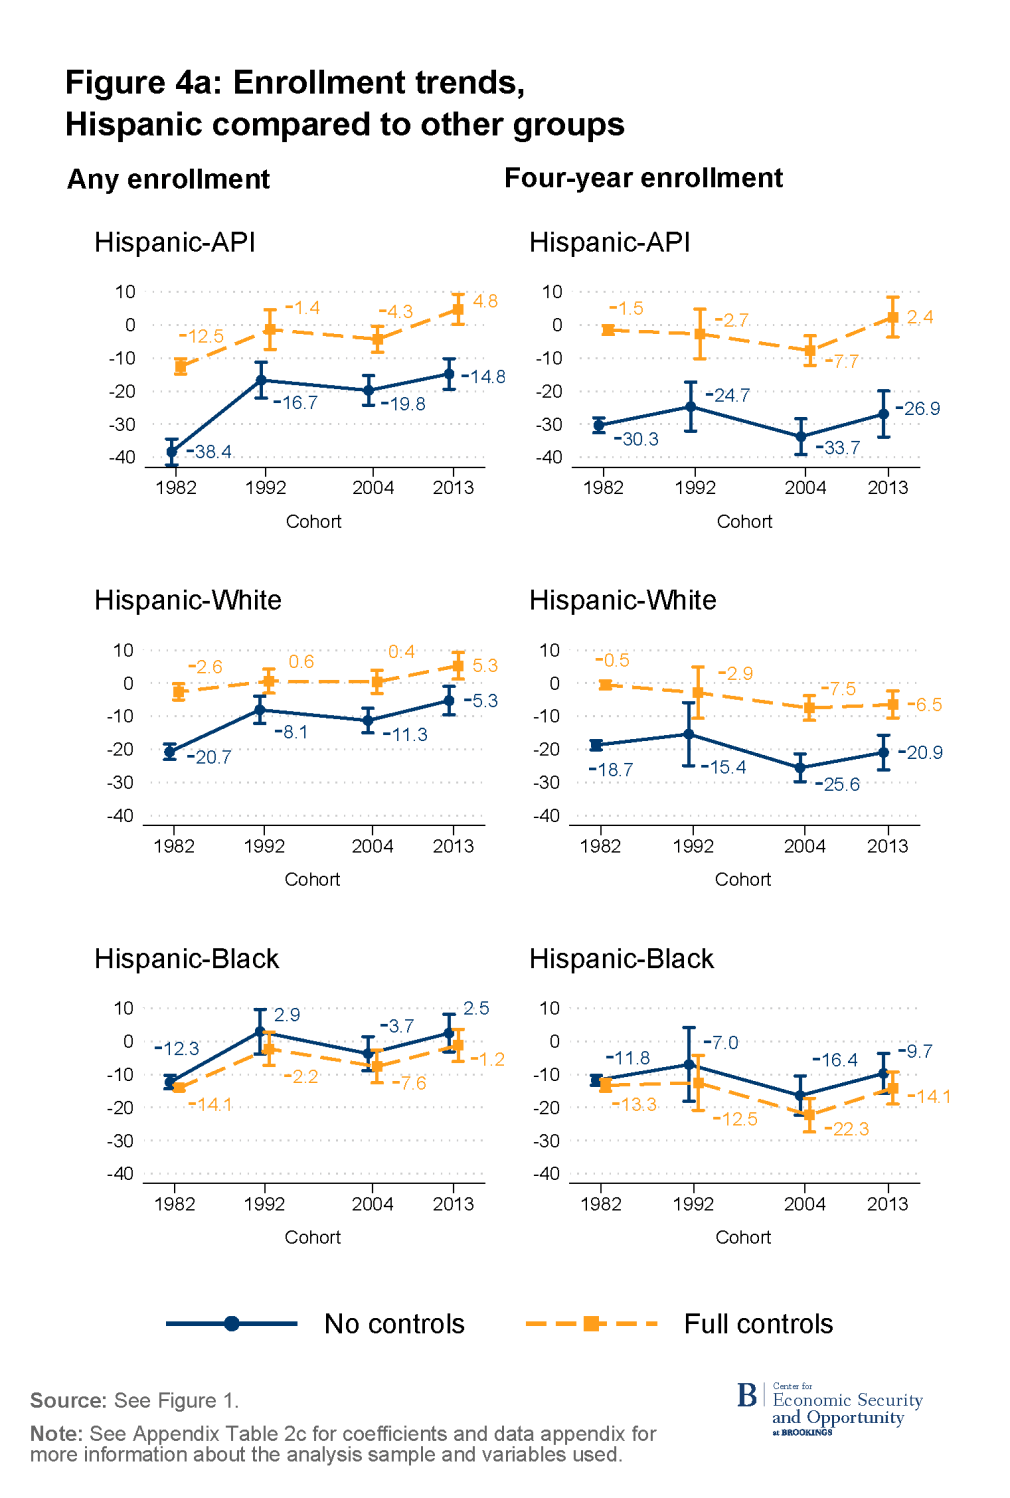
Figure 4b shows the results for Black high school graduates. Compared to APIs—the group with the highest enrollment rates—the any and four-year college enrollment gaps were large, between 16 and 26 percentage points, across cohorts. Accounting for academic preparation disparities mostly explains the gap in any college enrollment and reverses the four-year enrollment gap. In other words, while overall Black high school graduates were less likely to attend a four-year college than API high school graduates, among graduates with the same level of academic preparation, Black graduates were slightly more likely to attend a four-year college than their API counterparts.
Black high school graduates were about 10 percentage points less likely than white high school graduates to enroll in both any college and four-year colleges across the cohorts. Controlling for academic achievement reverses both the any and four-year enrollment gaps; that is, among students with the same level of academic preparation, Black high school graduates were more likely than their white counterparts to enroll in both any college and four-year colleges.
As previously illustrated in figure 4a, Black high school graduates historically had higher enrollment rates than Hispanic high school graduates. The Black-Hispanic any enrollment gap fell, while the four-year enrollment gap remained relatively consistent.
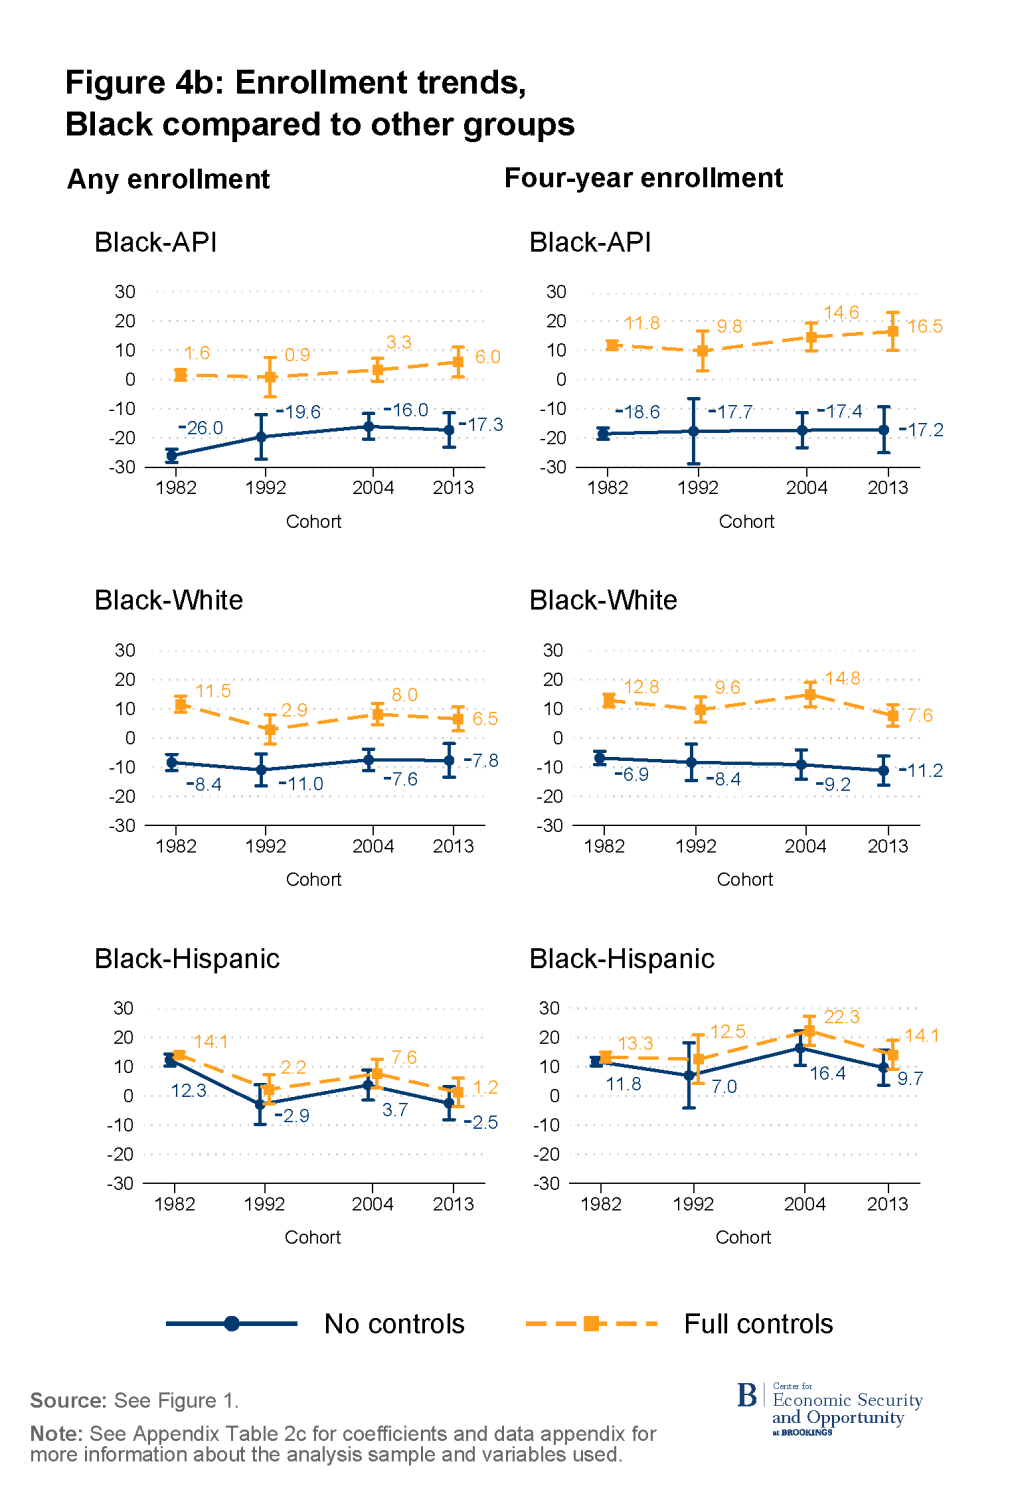
Figure 4c shows the results for API high school graduates. API enrollment in both any and four-year colleges was higher than for any other group. As displayed in figures 4a and 4b, both any enrollment and four-year enrollment were significantly higher for API than Black and Hispanic high school graduates. While both the any and four-year API-Black enrollment gaps have hovered around 20 percentage points across cohorts, the API-Hispanic gaps diverged, with the any enrollment gap significantly lower by the 2013 cohort. For the 1982 cohort, API high school graduates had about an 18 percentage point higher any college enrollment rate than white high school graduates and 12 percentage point higher four-year enrollment rate. In the later cohorts, both types of enrollment gaps hovered around 10 percentage points.
Controlling for academic preparation, gaps between API high school graduates and other groups were generally much smaller, or even reversed, reflecting substantially stronger academic achievement among API students. For example, in the most recent cohort, among high school graduates with similar academic preparation, APIs had four-year college enrollment rates lower than the other groups and any college enrollment rates similar to rates for whites and lower than rates for Black or Hispanic high school graduates.
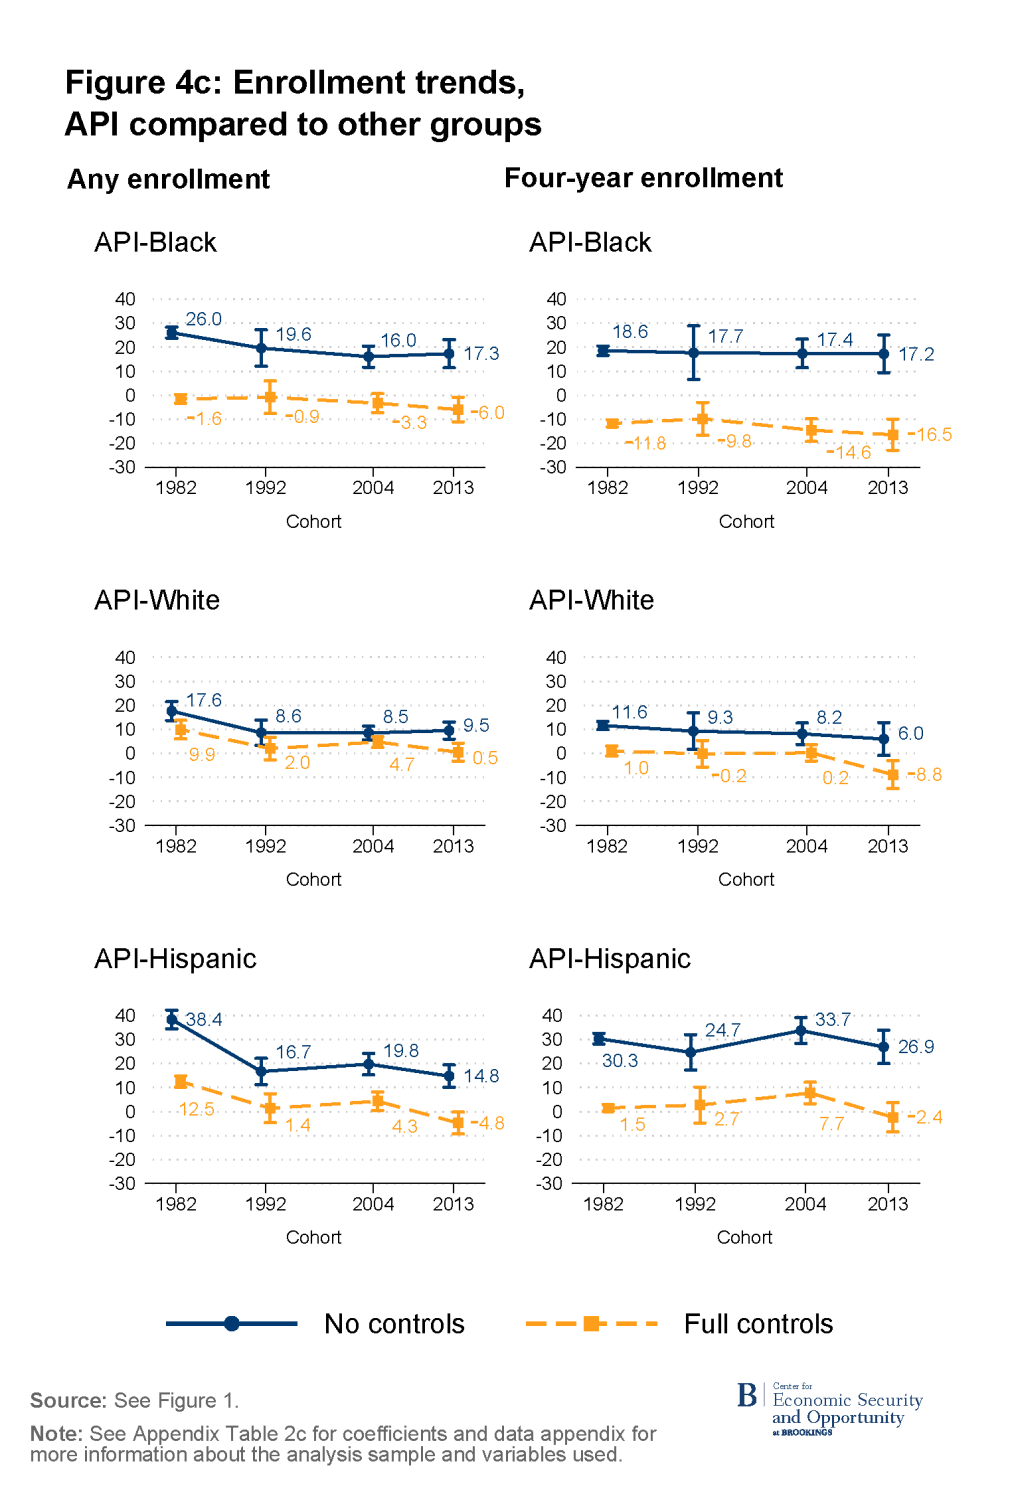
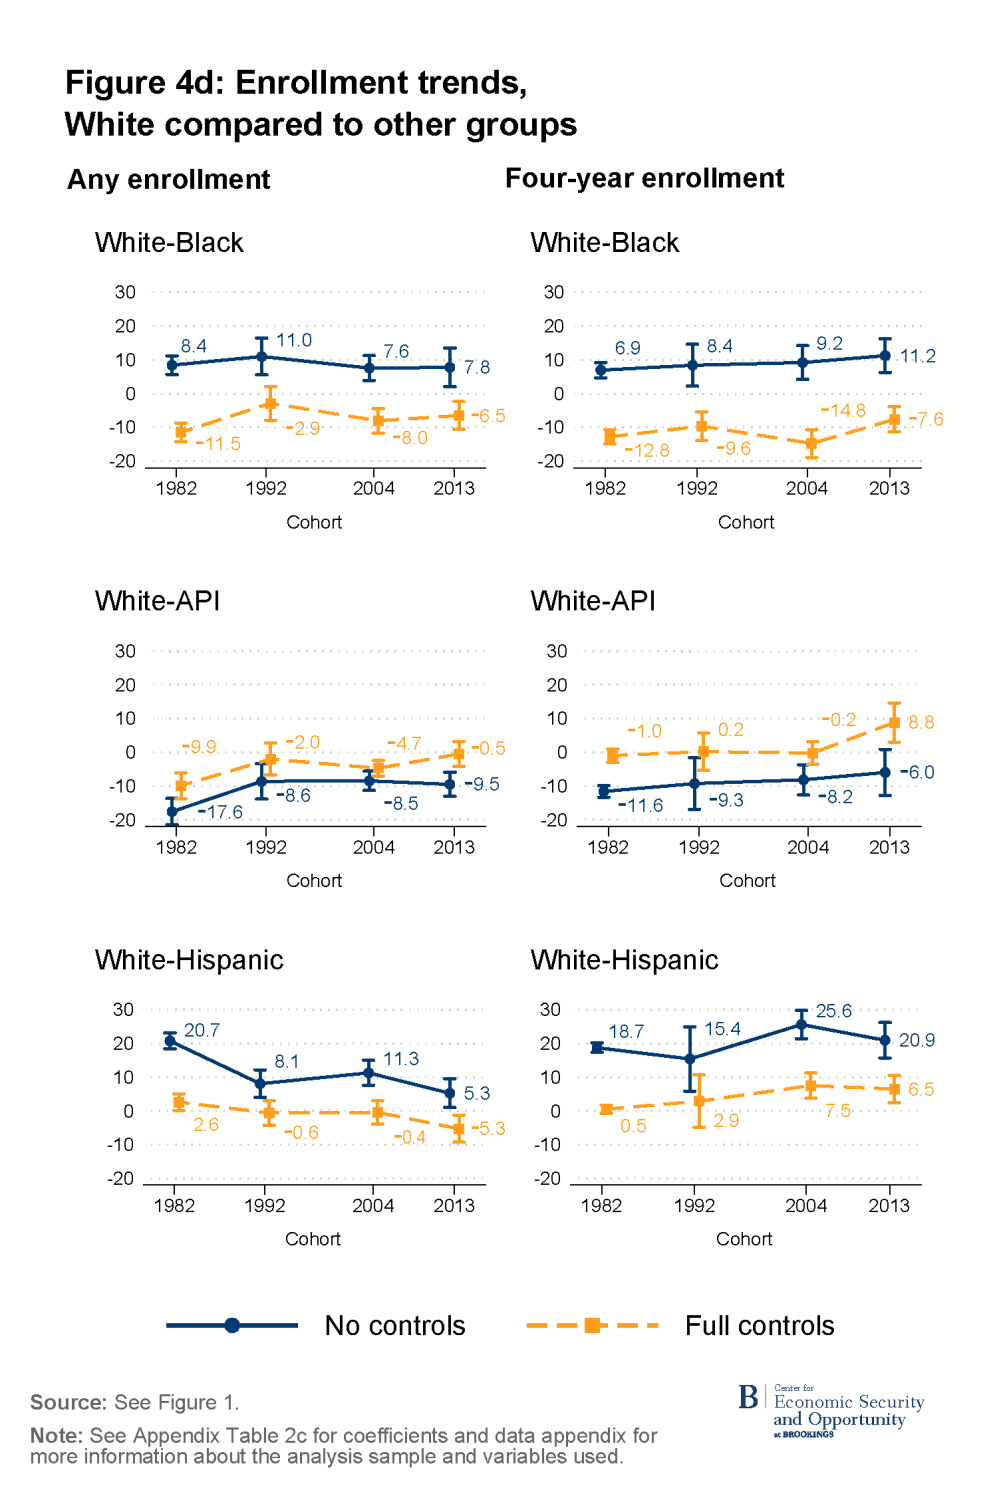
Figure 4d highlights the results for white high school graduates, all of which have been featured in the previous figures through comparisons with other groups. White high school graduates had higher any and four-year enrollment rates than both Black and Hispanic high school graduates, and lower enrollment rates than API high school graduates. Academic preparation disparities appear to explain most or all of the white-API and white-Hispanic gaps across cohorts—white high school graduates had similar enrollment rates compared to their API and Hispanic counterparts with the same level of academic preparation. Accounting for academic preparation reverses the white-Black gap’s direction—among high school graduates with the same level of academic preparation, white students had lower rates of any and four-year enrollment than Black students.
Discussion
In this report, we explore how disparities in academic preparation and college enrollment by socioeconomic status (SES), gender, and race/ethnicity have changed over time. We use NCES data covering cohorts that graduated in 1982, 1992, 2004, and 2013.
While four-year college enrollment has increased, enrollment in any college has remained relatively stable and disparities across groups have been persistent. Disparities by SES are the largest of those we looked at, both with and without controlling for academic preparation.
Differences in college enrollment rates by socioeconomic status have been strikingly large since 1982. High school graduates growing up in the top SES quintile were about 50 percentage points more likely to attend a four-year college compared to their bottom-quintile counterparts across all cohorts since 1982. The SES enrollment gap for any college, including two-year colleges, is smaller and showed more progress—but is still quite large and persistent.
Controlling for academic preparation, college enrollment gaps by SES were much smaller, and shrinking; but still stubbornly large—top SES quintile high school graduates were 13 percentage points more likely to enroll in any college and 19 percentage points more likely to attend a four-year college than their academically similar bottom SES quintile counterparts. The decline in SES gaps among academically similar high school graduates suggests that non-academic barriers such as financial constraints and difficulty navigating the college application process may have ameliorated somewhat. On the other hand, we also find evidence that SES gaps in academic preparation increased, especially in the most recent cohort.
Starting from a small gap in any college enrollment and no difference in four-year enrollment in 1982, women’s enrollment has steadily increased relative to men’s. Most or all of these gender gaps are explained by differences in academic preparation, especially in the most recent cohort. That is, male and female high school graduates with similar academic preparation have similar college-going rates. But females increasingly outperform males academically in high school.
Gaps among the four racial groups with large enough sample sizes to produce reliable estimates—Asian and Pacific Islander (API), Black, Hispanic, and white—are mostly stable across cohorts. With a few exceptions, API high school graduates had the highest enrollment rates for both any and four-year college, followed by white, Black, then Hispanic high school graduates. Among academically similar high school graduates, Black graduates had the highest enrollment in any college or a four-year college.
While most of the racial gaps have been fairly stable across cohorts, the decline in the gap between Hispanics and each of the other groups between 1982 and 1992 in enrollment in any college is striking. There was no comparable change in four-year enrollment gaps between Hispanic and other graduates, and little progress has been made closing college enrollment gaps since 1992.
A college education remains the most reliable path to economic mobility. Our findings highlight that disparities in academic preparation play a key role in driving college enrollment gaps. Race and gender gaps are almost fully explained by differences in academic preparation. Persistent SES enrollment gaps likely stem from a combination of academic preparation differences as well as barriers such as the cost of attendance, difficulty learning about and navigating the college application process, or a need to enter the labor market or attend to family obligations.
Reducing academic preparation disparities is an important but difficult task. Gaps by SES, gender, and race are all driven by complex and interconnected underlying factors. Policies targeted at improving instruction and academic support in K-12 schools are steps in the right direction. However, leveling the playing field also requires addressing the more systemic factors impacting opportunities to learn. Factors such as discrimination, family socioeconomic background, and neighborhood environment can all influence the educational opportunities that a student can access. Mitigating gaps in academic preparation (and therefore college enrollment) requires addressing inequities both in and out of the classroom.
Related Content


Authors


-
Footnotes
- We refer the reader to that report for a summary of prior research on college enrollment disparities. See, for example, Ellwood and Kane (2000) on disparities by socioeconomic status, Goldin, et al. (2006) and Jacob (2002) on gender disparities, and Phillips (2011) on race/ethnicity disparities.
- For the two later cohorts (ELS and HSLS), the data indicate whether an institution is a two-year or four-year institution. Classifications for the two earlier cohorts (HSB and NELS) did not correspond exactly to those categories. For NELS, students that enrolled in a public two-year or private not-for-profit less than four-year institution are categorized as having attended a two-year college. Students that attended a four-year public or private not-for-profit are categorized as having attended a four-year institution. For HSB, students that enrolled in a public two-year or any private less than four-year are categorized as having attended a two-year college. Students that enrolled in a public or private four-year college are counted as having attended a four-year college.
- Formally, we estimate an Ordinary Least Squares (OLS) regression of the indicator for college enrollment on the academic preparation variables described above and calculate the probability that a respondent enrolled using the estimated equation. We estimate separate regressions for each cohort and for each enrollment measure (any enrollment and four-year enrollment). With this method, predicted probabilities can fall outside the 0 to 1 range; in practice, they rarely do, so we use OLS (rather than probit or logit) for simplicity and consistency with the linear decomposition methods used below.
- In earlier work (Reber and Smith 2023), we found that test scores and measures of high school performance do not quite capture the same underlying “academic preparation” construct. The differences were especially important in understanding gender gaps, which were generally explained by high school performance measures but not test scores. We estimated versions of the equation described above with different combinations of academic control variables: test scores only, high school preparation measures only, and both together.
- This is defined slightly differently in each survey, but in general means that the respondent earned a high school diploma or GED by the summer (or for the HSLS cohort, November) after expected graduation for their cohort. See the data appendix for details.
- In Reber and Smith (2023), we did not make this restriction and instead relied on the weights to adjust for the observations that were dropped due to missing data. We could take that approach here, but the older surveys do not have as many weight options, and we prefer this more straightforward approach. The results we report here for the HSLS cohort are generally quite close to those in Reber and Smith (2023), suggesting this restriction may not be that consequential.
- These estimates are, of course, based on a sample, so the estimates are subject to statistical uncertainty. With four cohorts and five quintiles, there are many potential hypothesis tests that might be of interest. We report the p-values for the tests that the coefficients for the first quintile are equal across all four cohorts; that is, we ask if we can reject the null hypothesis that the gap between the first and third quintiles is the same for all four cohorts. We do this also for the second, fourth, and fifth quintiles (implicitly compared to the third quintile, which is the omitted category). We also test for equality of the difference between the first and fifth quintile across cohorts. We report the p-values for these tests in the appendix. The p-values for all those tests are less than .05, except for the fourth quintile. That is, we cannot reject the hypothesis that the gap between the third and fourth quintiles is the same in all four cohorts—this is apparent in Appendix Figure 1b.
- The change in the gender gap over cohorts is statistically significant; we reject the null hypothesis that the coefficient on female is the same in all cohorts at the .001 level.
- They report a slightly larger gender gap for the 2013 cohort (9, rather than 8, percentage points) for both any and four-year college enrollment. This is because they include all students in the sample, and we restrict the sample to high school completers. For the 2013 cohort, the only test available is in math. They conclude that the difference between controlling for test scores and high school performance measures is most likely partly a subject effect (gender gaps in math are smaller or reversed) and partly a test effect (among those with similar high school performance, boys appear to score higher on tests, regardless of subject), but they are limited by the lack of a reading score.
- We also do not report the results for the “other” category for this reason. Although the “Asian and Pacific Islander” category was replaced with separate “Asian” and “Native Hawaiian or Pacific Islander” categories in later cohorts, we combine them here for consistency and because the sample size for the latter group is too small to produce reliable estimates.
The Brookings Institution is committed to quality, independence, and impact.
We are supported by a diverse array of funders. In line with our values and policies, each Brookings publication represents the sole views of its author(s).