



Introduction
Medicare today is both the same—and very different—from the program launched in 1965. From the perspective of beneficiaries, the traditional Medicare program (TM) hasn’t changed much in 61 years, except through the addition of Part D in 2003 and through changes in provider reimbursement. But with the addition of the Medicare Advantage program (MA; originally established as Medicare Part C), which enrolled 54% of beneficiaries in 2025, the program as a whole has evolved to reflect changes in health care markets that have occurred over the succeeding six decades.
Policymakers and stakeholders today are assessing and debating what the future of Medicare will be. There is considerable sentiment that traditional Medicare should be maintained, both to offer enrollees more choice and as a check on the MA program. But there are several serious issues with the TM benefit design. TM is designed as a separate hospital benefit (Part A) and medical benefit (Part B), with distinct cost-sharing parameters that reflect coverage practices in the mid-1960s and no out-of-pocket (OOP) cap on cost-sharing. This cost-sharing design, in turn, has contributed to the growth of Medicare supplemental coverage.
The TM benefit design is outdated. The lack of an OOP cap means the program provides insufficient risk protection to beneficiaries who incur catastrophic costs. The cost-sharing parameters within each part do not efficiently balance financial protection and incentives to use appropriate services. The overall generosity of the benefit, measured as actuarial value, is substantially poorer than that of MA. This poor benefit generosity, in turn, leads beneficiaries to obtain supplemental coverage, which increases Medicare costs and further erodes incentives for efficient service use. Finally, the combination of a two-part benefit and supplemental coverage increases the complexity of decisionmaking required of beneficiaries. This paper lays out the challenges in TM’s current design and proposes solutions, beginning with a catastrophic cap, which will address them.
Traditional Medicare’s current design
A central reason for the existence of health insurance is to protect people against catastrophically large financial risks and alleviate the uncertainties of illness. To provide this protection, insurers can lower the price paid for services at the point of care through cost–sharing (e.g., charging coinsurance and copayments, which are only a fraction of the original service price). They can also target the overall level of annual spending by limiting total OOP spending. An OOP limit greatly reduces uncertainty, and it ensures the well-being of patients in medical crises. For this reason, almost all health insurance plans, both public and private, include a cap on people’s OOP spending. All expenses above that cap are paid by the insurer. TM stands as a stark exception in that it does not have an OOP cap unless beneficiaries purchase supplemental coverage.
At the same time, when beneficiaries do not bear the costs of additional health care, there is a risk of an inefficient increase in the utilization of services, a phenomenon known as moral hazard. Optimal insurance design balances financial risk protection against moral hazard through a combination of coinsurance and OOP limits. The current TM cost-sharing structure is a consequence of the historical evolution of the Medicare program. It does not achieve the desired balance between moral hazard and risk protection.
Medicare’s cost-sharing design is built on its original, bifurcated design. TM beneficiaries have separate deductibles for Part A and Part B services. The architecture of Part A cost–sharing is especially baroque. The inpatient hospital deductible for Part A is $1,736 in 2026. After 60 days, cost–sharing is $434 per day. After the 90th day, a beneficiary begins drawing on lifetime reserve days (of which they have 60) at a cost of $868 per day. After all lifetime reserve days are expended, the beneficiary pays all costs. Skilled nursing facilities (SNFs) have a separate daily copayment, which kicks in after 21 days at $217 per day. Cost-sharing should be designed to reduce inefficient use of services by targeting those with high responsiveness to price. But under today’s prospective hospital payment incentives, there is little reason to impose costs on beneficiaries for long hospital stays (which they cannot control and which hospitals have no reason to induce). Part A cost-sharing is the opposite of what we would expect under optimal design.
Part B cost-sharing is relatively simple. The Part B deductible is $283 for 2026. Most Part B services have coinsurance of 20%. Coinsurance provides people with incentives to reduce the use of costly care and choose lower–cost providers. Commercial insurance has evolved to favor copayments, rather than coinsurance, for routine primary care visits, simplifying decisions and encouraging use of these services (66% of commercially insured workers have flat copayments for primary care). This logic is even more salient for Medicare, which sets all provider prices, leaving less rationale for using coinsurance rather than simple copayments for services.
The complicated coinsurance and deductible structure, together with the lack of an OOP cap, leaves beneficiaries with significant risk. In many cases, they respond to this risk by buying supplemental coverage that covers part of the TM cost-sharing. Many TM enrollees purchase a supplemental insurance plan called a Medigap plan. Other enrollees receive supplemental coverage from a former employer. These supplemental insurance (SI) plans can often eliminate so much risk that they result in substantial moral hazard, increasing utilization and raising program costs for all enrollees. At the same time, they can be inaccessible both because they are very costly and because they are often underwritten. The result is a bifurcated program that fails to prevent moral hazard for some enrollees and leaves coverage gaps for others.
The TM cost-sharing structure has also generated an imbalance between the value of TM and MA plans. Actuarial value is one way to measure the relative generosity of benefits covered by an insurance plan. It measures the average share of health spending covered by the plan, as opposed to being paid out of pocket by the beneficiary, accounting for cost–sharing features such as coinsurance, deductibles, and OOP limits. It does not consider premiums. The actuarial value of Medicare Advantage Prescription Drug (MA-PD) plans in 2025 has been estimated at 92.2%, while traditional Medicare plus Prescription Drug Plans (TM-PDP) without supplemental insurance have an actuarial value of just 85.6%. This difference in actuarial value favors the choice of an MA plan.
In general, MA and TM enrollees both pay Part B premiums ($185 per month in 2025). However, MA plans sometimes rebate part of the Part B premium. MA enrollees also get an OOP cap and often drug coverage, while paying an average of only $17 a month in plan premiums on top of Part B in 2025. By contrast, adding Medigap can significantly increase the actuarial value of TM, but TM beneficiaries pay substantial costs for that additional coverage. Medigap added an average of $217 a month in premiums in 2023. Even then, a TM beneficiary still needs a separate drug plan. The value proposition between MA and TM is increasingly skewed.
Figure 1. The average actuarial value of traditional Medicare and Medicare Advantage, compared to employer/group plans and ACA Marketplace benchmarks

Sources: Milliman, 2025; Actuarial Research Corporation (2024)
Note: Affordable Care Act (ACA); Health Maintenance Organization (HMO); Preferred Provider Organization (PPO); Medicare Advantage Prescription Drug (MA-PD); Prescription Drug Plans (PDP)
Finally, the enrollment process for TM is too complicated. New beneficiaries must make separate choices about Part A and B enrollment, prescription drug plans, and Medigap coverage. Once enrolled, they face complicated cost-sharing arrangements, including separate plan deductibles and an OOP cap for drug coverage, but not for other forms of medical spending. They can also face penalties for switching between MA and TM, such as underwriting, if they opt into Medigap. By unifying the deductible and reducing the importance of Medigap, this paper moves toward a simpler choice set for enrollees.
In what follows, we consider benefit design improvements in TM, which are intended to address these issues, noting interactions with MA throughout. We review options in TM in three main areas: adding an OOP cap (catastrophic coverage), modifying coinsurance and deductible parameters, and restricting/reforming supplemental insurance. In each case, we discuss the implications for both TM and MA. We conclude with recommendations for action from among these options. We also emphasize that these reforms should not come at the expense of the solvency of the Hospital Insurance (HI) trust fund.
Capping out–of–pocket spending
The first step in reforming the TM benefit design is to add an out-of-pocket spending cap. Such a cap would protect people from catastrophic risk and improve the actuarial value of TM relative to MA. The numbers from the Urban Institute model (Table 4) imply that adding a $5,000 cap to TM would increase actuarial value by about 5 percentage points. MedPAC focus groups suggest that adding OOP protection is the most desired change to TM offerings. Similarly, a recent survey found that one-fifth of MA enrollees reported choosing MA over TM because MA plans do provide an OOP limit.
Introducing an OOP cap would help reduce cost–sharing burdens. Importantly, this is most protective for those beneficiaries with serious health issues. According to a 2017 study of Medicare beneficiaries with a cancer diagnosis, the mean annual OOP costs in the first two years after diagnosis were $11,585 (inflation–adjusted) for TM beneficiaries without supplemental insurance, implying that many beneficiaries have even higher OOP spending.1 Overall, TM beneficiaries in the 90th percentile of spending or higher spent an average of $10,535 OOP on health services, adjusted for inflation.
For context, the median annual household income for those over 65 was $56,680 in 2024, and this tends to decline substantially with age. Clearly, OOP costs of $10,535 or more are catastrophic for the typical Medicare beneficiary, and they can be even more overwhelming for many low-income beneficiaries. For instance, a senior living at 150% of the poverty line is not eligible for dual enrollment in Medicaid, and $10,535 would represent almost half of their annual income.
For those using TM without supplemental insurance, OOP costs can grow especially fast. In 2016, this group had average OOP spending on services of $7,820 (inflation–adjusted). Consistent with these high OOP levels, 11% of Medicare beneficiaries delayed medical care due to cost concerns in 2017, disproportionately driven by those with annual incomes below $25,000.
These figures highlight that an OOP cap aligns well with our goals for benefit redesign. It improves the risk–bearing structure of TM, increases parity between MA and TM, and reduces coverage gaps for those without supplemental insurance. An OOP cap already exists for Part D spending, and this paper focuses on the implementation of an OOP cap in Medicare Parts A and B.
General considerations in setting an out-of-pocket cap
Many proposals over the years have considered adding an OOP cap to Medicare. Appendix Table 1 surveys several comprehensive proposals that have been made since the Affordable Care Act (ACA). Importantly, we do not adjust for inflation when reporting numbers from the OOP cap proposals in this paper. Both the cap level and any cost estimates are reported directly and in the dollar-years chosen by the authors. Because many of these estimates predate 2025, the figures may be lower than their 2025 dollar equivalents.
Most reform proposals would both cap OOP spending and change cost–sharing structures and financing more generally. The Congressional Budget Office (CBO), for instance, has regularly released an estimate on the effect of instituting an OOP cap while simultaneously creating a combined Part A and B deductible and uniform 20% coinsurance rate. The most recent estimate (2024) was for an OOP cap of $8,500 with a combined Part A and B deductible of $850. While the OOP cap would increase costs to the Medicare program, the additional changes to the combined deductible and coinsurance would reduce these costs. In the CBO proposal, the deductible is set higher than the current Part B deductible but lower than the current Part A deductible. While a decrease in Part A cost-sharing for those with high inpatient spending pushes up costs for Medicare, this is more than offset by an increase in cost-sharing for the majority of beneficiaries who have only Part B spending. On net, introducing these policies would save around $3 billion per year from 2028 to 2034.
It is also helpful to know what the effect of an OOP cap would be on budgets and beneficiaries when it is considered separately from other policies. This provides a sense of the possible budget outcomes and factors affecting spending. These estimates should be used with caution since changes to the OOP cap will interact with Medigap, deductibles, and coinsurance adjustments in ways that may be difficult to predict. An OOP cap is also likely to reduce Medicaid spending, since Medicare is the primary payer for those who are dual eligible for both programs.
Two recent analyses that focus on the effect of an OOP cap alone are a 2022 Urban Institute proposal and a 2020 KFF proposal. The three key parameters that determine the cost to the Medicare program of an OOP cap are how the cap will affect service utilization, how it will affect decisions to enroll in TM versus MA, and how it will affect decisions to enroll in supplemental insurance.
When beneficiaries do not bear the costs of additional health care, there is a risk of moral hazard. This happens because after enrollees reach the cap, their cost-sharing for services falls to zero, and people are much more likely to use services when the price is zero. This reduction in cost-sharing has been shown to increase service use, even among those with high initial utilization. There is, however, considerable uncertainty about the extent of this utilization effect, especially in the Medicare program.
A cap will also affect the decision to enroll in MA rather than TM. One of the benefits of MA plans is that they do incorporate a cap on OOP expenses. In the short run, evidence suggests that an OOP cap will induce only a small amount of switching. Medicare beneficiaries show some sensitivity to OOP cost protection for prescription drugs, but often undervalue it relative to its worth. And historically, even when differences between plans are reflected in salient premium prices, rates of switching between MA and TM are low. In the longer run, the survey evidence above suggests that an OOP cap in Medicare might induce new enrollees to forego initial enrollment in MA.
Finally, a cap on OOP costs may affect beneficiaries’ decisions to purchase Medigap supplemental insurance. Some (though not all) SI plans currently include an OOP cap. In MedPAC focus groups, future beneficiaries expressed that a cap on costs would reduce their desire for supplemental insurance. Many proposals assume that an OOP cap (and other improvements to the generosity of cost-sharing) would push beneficiaries away from SI. For example, the KFF 2016 model assumes that the OOP cap, combined with a proposal requiring SI plans to cover at most 50% of the Part A/B deductible, would lead 600,000 enrollees to drop their SI coverage. Much of this projected change, however, is likely due to the restriction on SI cost-sharing, rather than the cap.
In the absence of this restriction on SI cost-sharing, there is less reason to believe that an OOP cap would have a strong effect on SI preferences. SI plans reduce all cost-sharing (often to zero for older plans), not just high-end cost-sharing. This reduction in cost-sharing, rather than the OOP cap, may be the attraction for most beneficiaries. That’s particularly true for those already enrolled in Medigap, whose preferences appear to be especially sticky.
Indeed, an OOP cap might even encourage enrollment in SI by reducing SI premiums. An OOP cap would mean Medigap insurers would no longer be on the hook for beneficiaries with OOP spending beyond the cap. The Urban Institute estimates that SI providers would realize $12 billion per year in savings from a $5,000 OOP cap, representing a 26.5% reduction in expenditures relative to current law. These savings would eventually be passed on to beneficiaries in the form of lower premiums. The Commonwealth Fund estimates that a $3,500 cap would lower Medigap premiums by at least $3.7 billion per year overall. The Commonwealth Fund estimated costs of implementation for 2016; as with other estimates in the paper, the change would be substantially larger in 2025 dollars. If an OOP cap lowers premiums for Medigap plans, it could promote more enrollment in Medigap.
The effect of changes to an OOP cap or cost–sharing on employer–sponsored supplemental insurance plans is even less clear because these plans are more diverse and more opaque. The Commonwealth Fund estimates that employer–sponsored supplemental insurance plans would save $6.5 billion per year if a $3,500 OOP cap were introduced. By contrast, the CBO estimated in 2019 that introducing a unified deductible of $750 plus a $7,500 OOP cap would increase employer-sponsored insurance costs by 4.2% overall from 2022 to 2028. It is unclear how much of this divergence is driven by differences in the proposals versus differences in modeling. Regardless, it makes clear the unpredictable effect of a cap on the provision of employer-sponsored SI.
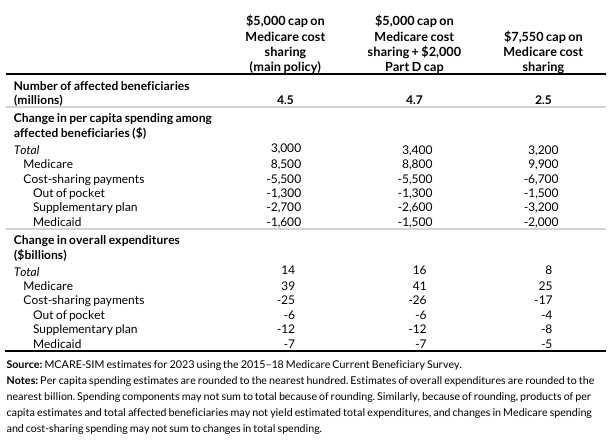
The Urban Institute and KFF analyses make different assumptions about these key parameters and reach different conclusions about costs. The Urban Institute estimates that the Medicare program would incur costs of $39 billion in the first year of implementation under a $5,000 cap, and $25 billion under a $7,550 cap. It is important to note that some of these increased costs are already borne by the Medicaid program, so the total effect on the federal budget is meaningfully lower than this headline number.
How the cap affects different payers is shown in the chart below, which shows projections for the implementation of a cap in 2023. When the OOP cap is hit, cost–sharing drops to zero. A variety of experimental and quasi-experimental evidence has shown that reduced cost–sharing, and especially zero-dollar cost–sharing, leads to substantial increases in the use of discretionary care. The Urban Institute accounts for this demand response but not for the effect of an OOP cap on the decision to switch between TM and MA or the decision to enroll in SI.
Figure 2. Estimated effects of a $5,000 cap (with two policy alternatives) on the number of affected Medicare beneficiaries and spending relative to current law, 2023
Source: The Urban Institute (2022)
KFF (2020) estimates the cost of a $5,000 cap at $19.4 billion per year for traditional Medicare specifically. Overall federal costs are estimated to be $24.6 billion. This estimate incorporates both utilization effects and switching between TM and MA. The baseline estimate does not model SI enrollment changes. The 2020 proposal does not make an exact estimate of the switching effect, but prior KFF Medicare reform proposals have assumed that 2.4% of MA beneficiaries would switch to TM. Incorporating switching is useful for making the projection more realistic, but the budget impact of switching ultimately rests on decisions about MA overpayments, which may vary with other policy choices.
A final note is that the costs of a cap and the number of beneficiaries it affects should level out as the cap increases. For instance, introducing a $5,000 cap is likely to affect more beneficiaries (and have a greater impact on program costs) than moving from a $5,000 cap to a $10,000 cap. Initial research has found evidence of this effect.
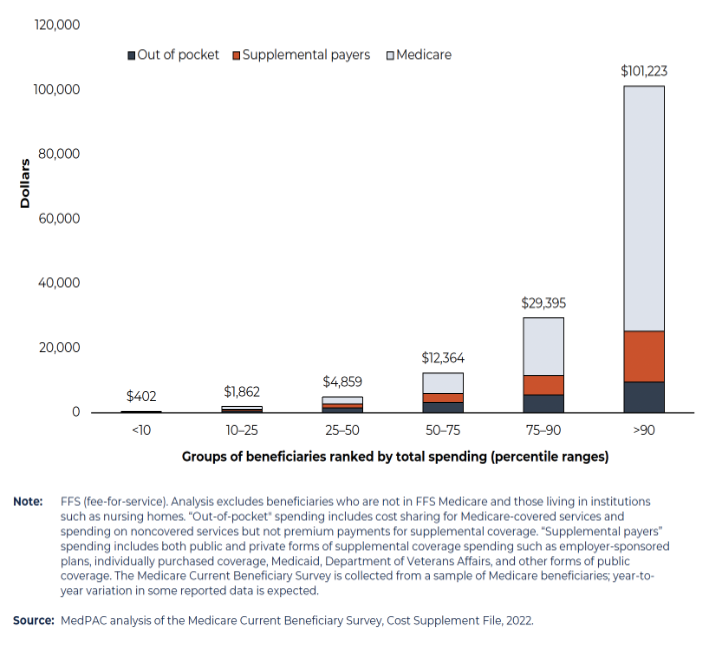
Each of the estimates mentioned so far assumes that a cost–sharing limit would apply to direct spending by beneficiaries, and also to spending by supplemental insurers, and to Medicaid spending on dual-eligible enrollees. That is to say that they evaluate a cap on beneficiaries’ total cost–sharing liability, not just their direct OOP spending. The cost-sharing liability of a beneficiary may be covered by a supplemental insurance plan, either provided by an employer or bought from a commercial insurer. Supplemental insurance pays a large share of OOP expenditures. For example, the same MedPAC 2025 report that found that the top 10% of spenders paid an average of $10,535 (inflation–adjusted) out of pocket also found that supplemental payers for that same group paid an additional $17,540 (inflation-adjusted) on average. The figure below from MedPAC shows how supplemental insurance and cost–sharing affect spending among different groups of beneficiaries in 2022.
Figure 3. Distribution of per capita total spending on health care services among noninstitutionalized fee-for-service beneficiaries, by source of payment, 2022
Source: MedPAC (2025)
The chart above highlights the important distinction between a cost-sharing limit and what is sometimes called a true OOP cost (TrOOP) cap. A TrOOP approach would not apply to spending by supplemental insurers or Medicaid. If beneficiary expenses are covered by one of those sources, Medicare would not count that toward the OOP limit. Only spending by the beneficiaries themselves would count. This seems attractive because it is estimated (in the short run) to cost the Medicare program and the federal government substantially less than a cap which includes payments by supplemental insurers. The drawback is that it adds substantial administrative complexity. It also means that some beneficiaries with Medigap or dual Medicaid coverage could face higher levels of spending. For this latter, low-income group, the additional cost-sharing might be especially onerous.
Another design option is whether to let the OOP cap vary with income. A high-income beneficiary could easily manage an OOP expense that would be catastrophic to a lower-income beneficiary. Under an income-related OOP cap, lower-income beneficiaries would have a lower OOP cap than higher-income beneficiaries. The fiscal impact of such an income-related cap is ambiguous because there are so many possibilities for how the scale is set. The KFF income-related proposal from 2020 holds spending at the same level as the flat $5,000 cap. Jonathan Gruber’s 2013 plan for The Hamilton Project similarly anticipated that the costs of implementing an income-related option would match those of a flat rate.
These income-related options could be especially helpful to the 19.2% of seniors living between 100% and 200% of the federal poverty level (FPL). This group is also disproportionately reliant on TM without SI. One drawback is that the existence of an income-related scale would increase administrative complexity. The required administrative integration between Medicare and the Internal Revenue Service (IRS), however, would not be novel and has precedent in the ACA.
The KFF 2020 proposal helpfully estimates a separate cost to Medicare for the various possible combinations of options, as if they were implemented in 2021. Their estimates are attached in Table 1.
Table 1. Comparison of budgetary effects of options to add an annual out-of-pocket spending limit to the Medicare program, assuming full implementation in 2021

Source: KFF (2020)
One final design possibility worth mentioning is to create separate spending limits for Parts A and B. This approach is not recommended in any of the proposals reviewed here; however, Congress has often preferred to address parts of Medicare separately rather than adjusting the program as a whole. The biggest changes have been made by creating new parts of Medicare (Parts C and D), and other major changes have often been made to Parts A and B separately. The most relevant example is the Medicare Catastrophic Coverage Act of 1988, where the only explicit cap was a limit on Part B spending. The cap was set to affect 7% of enrollees, and it started at $1,370 in 1990. Part A spending was limited by a benefit expansion, as beneficiaries had no cost-sharing for inpatient stays after meeting their deductible, though this did not apply to SNFs and hospice care. Drug benefits were subject to a $600 deductible in 1991, which was meant to be adjusted to keep the proportion of enrollees affected constant at 16.8%. Past the deductible, drug coverage had a coinsurance rate of 50% in 1991, tapering down to 20% by 1993. This complicated scheme made it harder for legislators to defend the act and created confusion among beneficiaries, which played a large role in the ultimate repeal of the law.
There may be good reasons to implement separate OOP caps for Parts A and B. For instance, it avoids issues of committee jurisdiction that arise in the House of Representatives. In the House, the Committee on Ways and Means has exclusive jurisdiction over Part A because of its association with the HI trust fund, but it shares that jurisdiction with the House Committee on Energy and Commerce over Parts B, C, and D. Working through legislation piecemeal might ease jurisdictional issues and negotiations. This same issue affects the separate deductibles for Parts A and B and could be an impediment to unifying the deductible.
However, there are drawbacks to instituting a separate cap. The major issue is adding even more complications to a program that can already be overwhelming to navigate. Establishing separate OOP caps could create confusion for beneficiaries and add administrative complexity without a strong economic or health care rationale. It could be especially frustrating to patients in ongoing medical crises, such as cancer patients, who may easily incur Part A and Part B costs simultaneously. From a beneficiary’s perspective, a unified OOP cap is likely to be preferable. We discuss issues related to a separate deductible in the next section.
The upshot of all of this is that there are three important questions about implementing an OOP cap:
- To what kind of spending should it apply?
- Should it have a progressive structure?
- At what level (or levels) should it be set?
Since an OOP cap will increase spending, the answers to these questions also affect the HI trust fund. To offset the cost of a cap, increased revenues or savings in other parts of the program will be necessary to maintain the HI trust fund‘s solvency.
Ways to set the level of the out-of-pocket cap
Many different benchmarks have been proposed for setting an OOP maximum. Here, we consider a health care burden benchmark, a Medicare Advantage benchmark, and an Affordable Care Act (ACA) benchmark. Regardless of the benchmark chosen, the cap could be set to increase mechanically with inflation. Either it could be tied to the consumer price index (CPI), or it could be set based on the average increase in covered Medicare services for the previous year, similar to Part D.
Health care burden benchmark
One reason an OOP cap is important in the first place is that it helps prevent catastrophic levels of spending, which can lead to debt, impoverishment, and worse health outcomes. Therefore, it may be reasonable to benchmark an OOP cap to a “health care burden” standard, which takes income, assets, cash savings, or consumption into account.
The three charts below, adapted from KFF data for 2024, give a sense of the distribution of income and savings among Medicare beneficiaries. This data makes clear that an OOP cap set at a single level for all beneficiaries is likely to be regressive. This occurs because the cap is more likely to affect well-off beneficiaries, who may spend more on coverage they can afford, but less likely to be binding for low-income beneficiaries. A single cap at $7,000, for instance, would, on average, reduce total OOP spending for those with incomes of $40,000 or more, but not for those with incomes less than $40,000.
Addressing regressivity, access, and cost burdens may require some kind of means–tested approach. The issue is establishing a non-arbitrary and administratively feasible standard.
One approach is to link allowable OOP costs to Social Security or total annual income to keep the percentage of income that a given beneficiary spends on health care below a certain threshold. This is an attractive option because it allows the OOP cap to be tailored to the beneficiary in a way that clearly matters to their actual financial situation. It also has the effect of tapering off naturally as income rises.
There are several ways to do this. One approach mirrors a 2024 Brookings issue brief, which proposed a gradual increase in Part B premiums as income rises. That proposal required no premiums for households below 150% of FPL and then allowed premiums to rise gradually as household incomes rose. A similar income-related structure could be used for an OOP cap in Medicare by setting a low cap below a certain percentage of the FPL and allowing the cap to rise gradually with income. An example would be to set a minimum OOP cap starting at $2,000 through 200% of FPL. The cap could then increase by $1,000 for each 100% increase in the poverty level up to $5,000 at 500% of FPL. This would be a more generous structure than those found in the estimates reviewed so far; therefore, it is likely to affect more beneficiaries and cost more than other structures mentioned.
An OOP cap could also be based on some percentage of Social Security income. The table below gives a sense of the OOP max levels that would result from such a structure (at either a 10% or 20% limit) by income level. This is also likely to be an expensive option. Using the KFF income-related proposal as a lower limit, this approach is expected to cost Medicare well over $25 billion, though the lack of data on the distribution of OOP spending by income makes it hard to provide a more accurate estimate. Rather than reading Table 5 as a proposal, it may be helpful to think about it as a guide to the level of spending that might begin to represent a burden at various income brackets.
Rather than setting the limit as a percentage of Social Security or income, a more common approach is to have a set of income-related brackets. Table 3 above shows that for those above 200% of the FPL, savings are high enough to absorb modest OOP health care costs. Low-income beneficiaries are already highly sensitive to costs when accessing medical care, and for the 25% of those below 200% of the FPL, even OOP costs above $200 are unaffordable. This is well below the lowest OOP cap set in most income-related proposals, as shown in the first table of the appendix. This may suggest that an income-related scale with a very low bottom bracket is necessary to avoid erasing savings for low-income beneficiaries. By contrast, median savings of those in the 200% to 399% of FPL range are more than six times higher. This may indicate that a less gradual income-related structure is desirable, with a low OOP cap for those below 200% of FPL and a substantial increase at higher income levels.
Ultimately, though, there are substantial limitations to what an OOP cap can be expected to do. In general, beneficiaries respond not just to the year-end price of health care, but also to the price paid for any given visit. A cap can address only the former and not the latter. For low-income beneficiaries in particular, concerns about day-of prices, rather than annual risks, often drive the decision not to access health care. For this reason, the expansion of premium subsidies and/or dual eligibility with Medicaid may be a more sensible option for addressing cost and access concerns than trying to set a very low OOP cap. While concerns about income, consumption, and savings should inform the determination of an OOP cap, those concerns can only be fully addressed by a large swathe of benefit redesigns.
Affordable Care Act benchmark
Another option is to draw a traditional Medicare OOP cap in line with the Affordable Care Act. Even though the populations served are quite different, applying the ACA’s OOP standard to TM helps ensure that federal policy is consistent across programs.
The ACA made OOP limits a nearly ubiquitous part of health insurance plans, and it provides a clear benchmark. In 2026, the basic ACA cap was $10,600 for an individual. Such a cap would affect a small percentage of TM beneficiaries each year. If applied by a TrOOP standard, this would likely affect a single–digit percentage of beneficiaries and, using KFF estimates as an upper bound, would likely cost less than $3 billion per year (perhaps much less). However, the ACA also incorporates an income-related cost-sharing cap, with cost–sharing reductions set out in section 1402 (c), that applies to ACA Marketplace silver plans. The exact OOP maximum for a given plan varies, but an example of a typical structure is presented in Table 6.
The ACA presumed that those under 100% of the FPL would be covered by Medicaid. For the Medicare dual–eligible population, this is generally true, as those below 100% of the FPL are eligible for the Qualified Medicare Beneficiaries (QMB) program. However, QMB enrollment is subject to an asset test, and it also requires opt-in enrollment. Consequently, a cap for those below 100% of FPL, either at the 100% to 200% or lower, would help those who might otherwise fall through the cracks.
Medicare Advantage benchmark
A final option is to set the traditional Medicare OOP cap to match the Medicare Advantage cap. This could mean using the statutorily set MA cap of $9,250 (in the same range as the ACA cap) for in-network services in 2026. (This is intentionally set at around the 95th percentile of fee-for-service (FFS) beneficiary spending for that year.) Alternatively, it is possible to use the average of the MA plan OOP caps. The average for in-network services in 2026 was $5,421. One benefit of benchmarking to MA is that it may help equalize the competitive positions of TM and MA. It may also make consumer choices easier during enrollment. Overall, establishing a flat rate based on a comparison to MA is a simple, clear option, and the costs of a flat-rate OOP cap of this kind are well understood. It directly addresses the goal of aligning the value of TM with MA.
An issue with this cap, if set at the statutory level, is that it would affect a few beneficiaries. It will also be inadequate for some beneficiaries. Though dual eligibility for Medicaid helps, the statistics reveal that some low-income beneficiaries are falling through the cracks. Those with incomes of $10,000 to $20,000 spend $3,790 out of pocket on average, representing 20% of their income. However, as we discuss in the next section, it may be better to address the needs of the lowest-income TM beneficiaries in ways other than a cap.
Deductible and cost-sharing changes
As discussed in the introduction, the current structure of traditional Medicare can create substantial burdens for beneficiaries. Unwieldy cost-sharing and complicated benefit design lead to access and cost barriers. Burdensome spending is not uncommon across the Medicare program; 11% of Medicare beneficiaries (around 6 million people) delayed medical care due to cost concerns in 2017. Disproportionately, those delaying medical care have incomes below $25,000 a year, including many beneficiaries with dual eligibility in Medicare and Medicaid. Unifying the TM deductible and adjusting coinsurance can make the program simpler and less burdensome for enrollees.
Unifying the deductible
Unifying and simplifying the Part A and B deductibles is a component of almost every benefit redesign proposal. Moving from separate Part A and Part B deductibles to a single, unified deductible simplifies beneficiary decisionmaking, improves comparability with MA, and reduces benefit cliffs created by site‑of‑service rules. The proposals surveyed in Appendix Table 1 propose unified deductibles from $250 to $850. Different versions of the unified deductible have very different budgetary effects. A 2019 analysis by the Urban Institute finds that if implemented separately from an OOP cap, a unified deductible between Parts A, B, and D at $500 with a 25% coinsurance rate would reduce Medicare spending by $6.5 billion and OOP beneficiary spending by $1.5 billion, primarily by shifting costs to Medicaid and supplemental insurers.
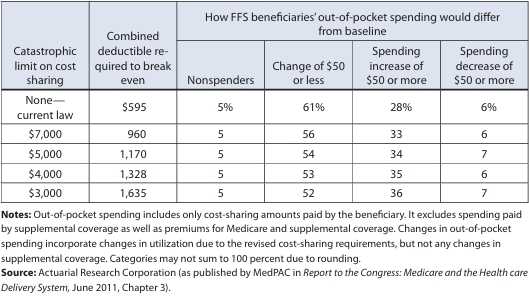
A unified deductible could be set to be budget–neutral and can be combined with an OOP cap. The American Academy of Actuaries provides a useful, though now outdated, sense of how the deductible and OOP cap can be set to maintain budget neutrality. Their work can be seen in the table below.
Table 7. Level of combined traditional Medicare deductible required to hold Medicare program spending constant in 2011, plus the impact on out-of-pocket spending among beneficiaries
Of course, the deductible could also be set at a level that is not budget neutral, and savings from SI reform, MA reform, or another mechanism could pay for that change.
The unified deductible would likely be set at a level much lower than the 2026 Part A deductible of $1,736. This would increase the cost-sharing burden borne by the HI trust fund relative to current law. By contrast, the Part B deductible is $283 in 2026, and a unified deductible above that value would decrease the cost–sharing burden on Part B. Consequently, even a budget–neutral combined deductible might leave the HI trust fund worse off, and policymakers should consider countermeasures to preserve solvency.
Copayments and coinsurance
Once the deductible is met, there are still serious questions about how cost-sharing should be managed. There are two common kinds of cost-sharing that beneficiaries pay when they receive a service: copayments and coinsurance. Copayments are flat fees associated with the service (e.g., each time a beneficiary visits a primary care provider, they pay $20). Coinsurance is a fee based on a percentage of the service price (e.g., a beneficiary might pay 20% of the total price of a visit to a specialist).
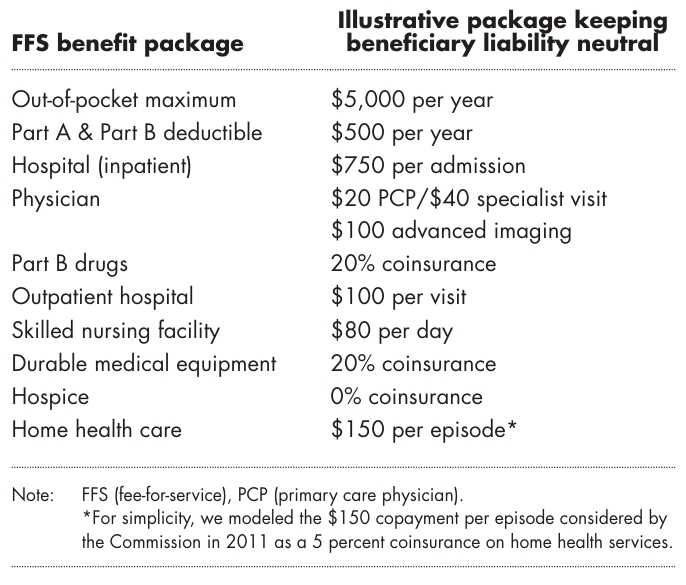
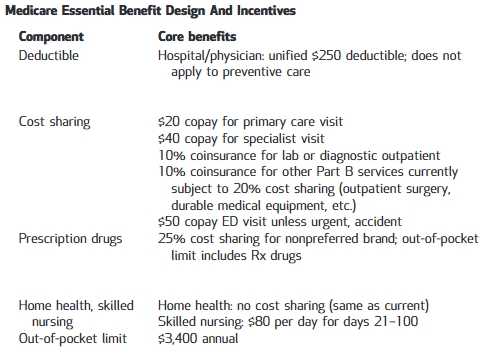
One option is to simply require a universal 20% coinsurance payment for everything above the unified deductible, as analyzed by the CBO. Another option is to apply a consistent schedule of copayments set for each individual service category, as proposed by KFF, MedPAC, and others. The two figures below, from MedPAC and the Medicare Essential proposal, give examples of specific cost-sharing architectures. MedPAC based its design on MA plan offerings.
Figure 4. Illustrative example of a benefit and cost-sharing redesign for traditional Medicare from MedPAC
Source: MedPAC (2012)
Figure 5. Proposed example of a benefit and cost-sharing redesign for traditional Medicare from the Medicare Essential proposal
Source: Davis et al. (2013)
The benefit of a universal coinsurance rate is simplicity and predictability. It does not require regular revision, and it is easy to understand. The benefit of tailored copayments/coinsurance is that it allows Medicare to encourage the use of high-value forms of care. A specified list of copayments (as opposed to coinsurance rates) may also make it easier for patients to understand the exact amount they will pay for services. The available evidence, however, suggests that while tailored cost–sharing may improve patterns of service utilization, it does not result in savings.
A potentially significant problem with the specific copayment design is determining the copayment/coinsurance rates for specific services year after year. There would need to be a mechanism to update cost–sharing in accordance with changes in the actual cost of care and the relative value of services. It would be possible to draw on MedPAC to make recommendations or engage in rulemaking at regular intervals.
Another consideration is whether deductibles or copayments should have an income-related structure. In part, concerns about cost–sharing would be ameliorated with a generous, income-related OOP cap. This is the approach taken by several proposals in Appendix Table 1. Some proposals also make the deductible income–related. The second KFF option in Appendix Table 1 takes a different approach by eliminating cost–sharing for SLMB, QI, and LIS beneficiaries. The issue with that approach is that many beneficiaries who are just above dual eligibility would still have no special protection against high cost–sharing.
None of the surveyed proposals provides a separate copayment or coinsurance structure for low-income beneficiaries, but there is no reason this cannot be done by instituting nominal copayments or low coinsurance for beneficiaries below a certain threshold.
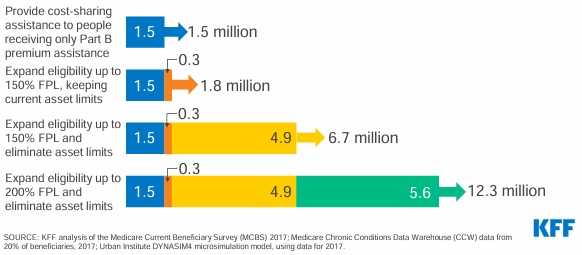
A final possibility for making Medicare cost-sharing more sensitive to income is to expand the generosity and scope of the Medicare Savings Programs (QMB, SLMB, and QI). KFF 2020 analyzes four proposals, which are specified in the figure below. These proposals would make Medicare much more generous for those affected by expanded eligibility and undoubtedly help low-income beneficiaries. However, KFF provides no cost estimate for what is likely to be a quite expensive plan. This option also does not address the broader goal of simplifying and streamlining the Medicare benefit structure, so it should be seen as a useful addition rather than a fix to the general problems of complexity and cost.
Figure 6. Number of additional Medicare beneficiaries helped by changes to the Medicare Savings Program, by policy choices, 2017
Source: KFF (2020)
Supplemental insurance reform
Supplemental insurance for TM is often used to fill the gaps in the program’s cost-sharing structure, including the lack of an OOP cap. Given the value of an OOP cap, most TM beneficiaries have some form of supplemental insurance. That SI is often quite generous in its coverage, but acquiring a plan in the first place can be prohibitively expensive for many beneficiaries. Among those with SI, this can lead to moral hazard and overspending. It leaves those without SI facing major financial risk. For both populations, the slate of Medigap options is large and complicated, and enrollment must be timely, or beneficiaries may have their premiums increased by underwriting. By balancing SI reform and benefit redesign, Medicare could simplify and improve the beneficiary experience while holding beneficiary cost-sharing neutral. We will examine several options, ranging from restricting Medigap plan offerings to the complete elimination of Medigap.
Structure of supplemental insurance
It is extremely common for FFS beneficiaries to have supplemental coverage. Of the 28.2 million TM beneficiaries in 2023, only 3.5 million had no form of supplemental coverage. The most common form of supplemental coverage was a Medigap plan (12.2 million), followed by employer-sponsored insurance (8.2 million), and then dual enrollment with Medicaid (4.0 million). Overall, beneficiaries with Medigap plans are whiter, wealthier, and more educated than TM beneficiaries as a whole. This makes sense because Medigap can be expensive, with average premium costs of $2,770 a year (inflation-adjusted). Medigap users also have better self-reported health status than TM beneficiaries overall or MA beneficiaries, though the actual relative health status of Medigap enrollees compared to the overall Medicare population is controversial.
There are currently eight standardized Medigap plans that private insurers may provide (A, B, D, G, K, L, M, N) and two plans that are not available to those who enrolled after 2020 (C and F). The rationale for stopping enrollment in these plans was to reduce the availability of first-dollar coverage. First-dollar coverage means the beneficiary has no deductible to meet and pays no OOP expenses, only premiums. The figure below, from KFF, shows what currently existing Medigap plans cover.
Figure 7. Standard plan benefits for Medigap plans by type

Source: KFF (2024)
Less is known about employer-sponsored supplemental insurance (ESI), and there are many different plans of this type. A 2006 survey found that 81% of ESI plans had a deductible, with an average deductible of $326 (inflation-adjusted to $520). 84% of plans provided an OOP maximum, with an average of $1,900 (inflation-adjusted to $3,030). The CBO model for cost–sharing assumes that beneficiaries are typically on the hook for about 50% of cost–sharing in retiree plans.
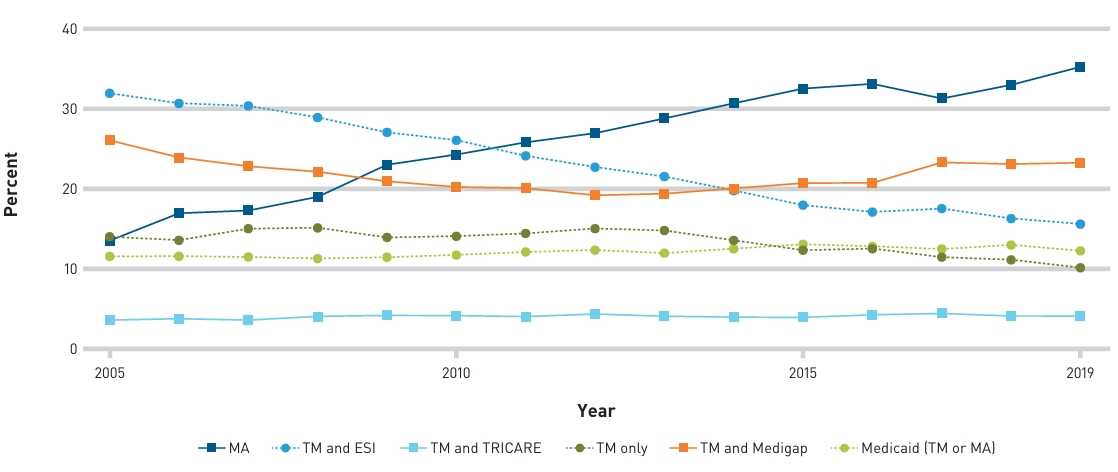
The trend over time has been toward fewer Medicare beneficiaries with ESI. One estimate is that from 2010 to 2016 alone, the percentage of Medicare beneficiaries with ESI dropped from 38% to 28%. Another study found that the percentage with ESI dropped from 31.8% to 15.5% between 2005 and 2019, while the percentage enrolled in MA plans went from 13.4% to 35.1%, as shown in the figure below.
Figure 8. Trends in coverage among Medicare beneficiaries by program choice and supplement type, 2005 to 2019
Source: Marr and Polsky (2024)
Medicare beneficiaries with supplemental employer coverage are, by some margin, the wealthiest and most educated subpopulation of TM beneficiaries, and they are also wealthier and more educated than the MA population overall. Further, TM enrollees with ESI are tied with Medigap enrollees for having the highest share reporting good to excellent health. These facts should attenuate concerns about restricting or taxing coverage for this population.
Medicare-only beneficiaries
As noted above, 3.5 million traditional Medicare enrollees had no supplemental coverage in 2023, leaving them exposed to unlimited levels of OOP spending. They stand to gain the most from an OOP cap and to lose the least from supplemental insurance reform. Characteristics of this population are given in the table below with a comparison to other Medicare beneficiary populations (with 2019 data from ASPE):
The size of this group has been in slow decline, from 13.9% in 2005 to 10.1% in 2019. Marr and Polsky (2024) propose that this is driven by increasing enrollment in Medicare Advantage. While the size of the Medicare-only population has not altered dramatically, its composition changes substantially from year to year. According to Hogan (2014), “half the population observed to have no secondary coverage in 2010 had private secondary insurance in 2000 … 71% of the population started with some secondary coverage in 2000. Over the decade, under 13% of the final Medicare-only population had never had any secondary coverage.”
There is limited focus group evidence suggesting that switching to Medicare-only is driven by concerns about cost. However, in general, switching from MA to TM seems to be most strongly linked to concerns about access to care when needed. It is possible that traditional Medicare-only enrollees are beneficiaries who have recently moved out of dual eligibility, or who (as hypothesized by Hogan) are on a downward financial trajectory that is likely to terminate dual eligibility. Alternatively, they may simply be younger and healthier beneficiaries who are not forward-looking and wish to avoid the cost of Medigap enrollment while retaining the broad access options of TM. Notably, however, Medicare-only beneficiaries have the heaviest OOP spending on long-term care by a large margin, as shown in the figure below from KFF. Overall, there is no clear evidence about why these beneficiaries remain in Medicare-only, though over time, the population as a whole does seem to be shifting away from Medicare-only coverage and toward MA.
Figure 9. Average out-of-pocket health care spending by traditional Medicare beneficiaries in 2016, by type of services and type of supplemental coverage

Source: KFF (2019)
Effects of supplemental coverage
Both Medigap and employer-sponsored insurance drive up Medicare spending. This is particularly true of the two most popular Medigap plans, Plan F and Plan G, which cover nearly the entirety of patient cost–sharing and account for 75% of Medigap enrollees. Drawing cost-sharing toward zero in this way may induce increased utilization of services. Causal studies in 2016 and 2019 estimated that Medigap coverage increases an individual’s Medicare spending by 24% and 22%, respectively. This is clear evidence of moral hazard.
In a report on their cost-sharing model, CBO (2019) explained that, relative to 25% coinsurance rate, first-dollar coverage increases Part A spending by 8.8% and Part B spending by 20% (Table 4). Though this is not an estimate for the impact of Medigap specifically, it does make clear the issue with first-dollar coverage. The same CBO report cites the MedPAC estimate that Medicare spends 27% more per enrollee with Medigap coverage than on those without supplemental coverage, when accounting for observable differences.
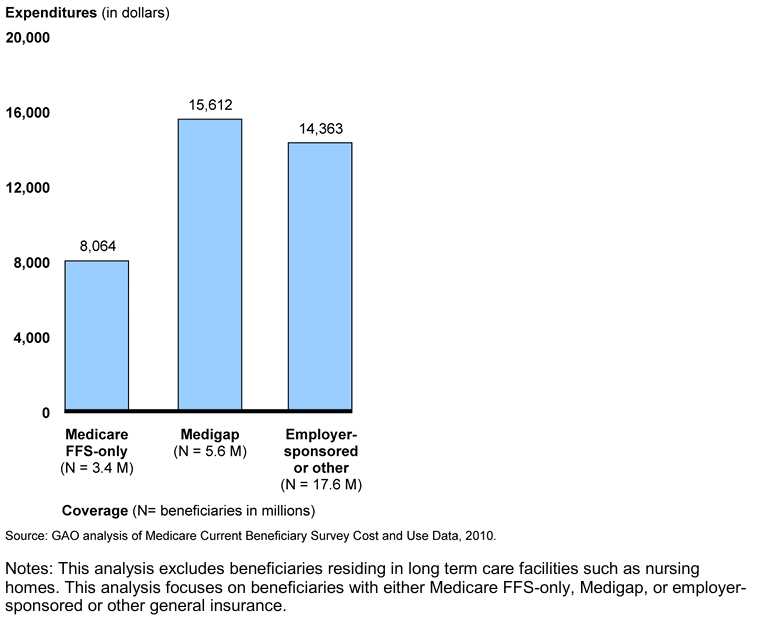
Similarly, GAO analysis shows that spending by both Medigap beneficiaries and beneficiaries with ESI is about twice that of those without SI, as shown below. While the population without SI is very different from the population with SI, SI clearly increases program costs, as the GAO literature review makes clear and the numbers from the CBO validate.
Figure 10. Estimated average health care expenditures per Medicare beneficiary by supplemental coverage category, 2010
Source: GAO (2013)
Major reform options
Restrictions on Medigap or ESI would likely produce substantial savings for Medicare, which could be used to pay for an OOP cap and other improvements to the TM benefit design. The estimated budgetary effects of Medigap restrictions or elimination depend on which policy is chosen. A critical reference point to keep in mind is the CBO estimate, which has been made for many years on the impact of restricting first-dollar coverage. The latest version of that estimate from 2024 proposes to “bar [Medigap policies] from paying any of the first $850 of an enrollee’s cost-sharing obligations for Part A and Part B services and would limit coverage to 50% of the next $7,650 of those cost-sharing obligations [beginning in 2028].” CBO estimates that restrictions on first-dollar Medigap coverage could save $11 billion in the first year of implementation and $116 billion from 2025 to 2034. This is roughly in line with what might be needed to pay for a modest cap in TM. The CBO has recognized the synergy between an OOP cap and Medigap restrictions and has often considered the two reforms in conjunction.
Given the difference in population characteristics between those with and without SI, a policy to restrict SI would curb overuse and free up money for other important objectives without being regressive or necessarily creating excessive financial hardship. Insofar as the other options in this paper may draw down the HI trust fund reserve, reform to SI can help improve HI trust fund solvency.
There are many possible reforms to supplemental insurance. Four types of supplemental insurance reform proposals are considered here:
- Prohibitions on first-dollar cost–sharing among those plans which still permit first-dollar coverage and other cost-sharing restrictions in Medigap
- Taxes to discourage enrollment in SI plans while raising revenues
- A new structure for TM that is designed to make supplemental insurance unnecessary
- Guaranteed issue reform, which makes it easier to switch into Medigap plans
A further summary of these four types, and a longer list of specific reform options from legislation, policy proposals, and journal articles, are attached in Appendix Tables 2 and 3.
Medigap restrictions
Restricting Medigap to prevent first-dollar coverage is a well-known proposal that has been scored by the CBO for many years. First-dollar coverage means that, after paying the premium for a Medigap plan, a beneficiary is no longer on the hook for any OOP spending.
Consistent, high-quality evidence, including from the RAND health insurance experiment and a report commissioned by MedPAC in 2014, has shown that beneficiaries respond to increased cost–sharing by reducing their use. The increase in spending per patient due to Medigap coverage is probably somewhere in the range of 20% to 30%. This demand response to cost-sharing reductions results in spending increases amounting to billions of dollars per year. As mentioned above, the CBO restriction option is expected to save $116 billion over 10 years. This would likely be enough to more than pay for the cost of a $5,000 OOP cap on TrOOP spending.
Tradeoffs and limitations
It is plausible that increasing patient cost–sharing reduces the use of valuable care by some patients. The evidence shows that health care consumers underuse high-value care when faced with high cost–sharing, just as they overuse low-value care when faced with low cost–sharing. This should lead reformers to be careful with cost-sharing reform, especially for high-value care. Hogan (2014) found that the difference in health outcomes between first-dollar coverage and secondary coverage with some cost–sharing was minimal. However, he found a large difference between having some secondary coverage and being enrolled in TM without any supplementary coverage at all. This evidence suggests that it is possible to make beneficiaries more utilization sensitive without harming health, but that the balance lies somewhere between first-dollar coverage and TM without any supplement.
If there is a disincentive to use high-value medical care, this might dull the savings of Medigap restrictions. If beneficiaries choose not to get services in one period because they want to avoid cost–sharing, it may lead to future medical issues that require more intense services and ultimately increase overall costs. This is called an “offset.” The RAND health insurance experiment found little evidence of offsetting, as have some more recent studies, but this evidence is all from the non-elderly population. Chandra, Gruber, and McKnight (2010) examined the results of a policy change in retiree supplemental insurance in the state of California. They found substantial evidence of offsets. Specifically, copayment increases were associated with fewer payments for office visits and drugs, but more payments for hospital services. This increased use offset 20% of the policy’s overall cost savings and 53% of the savings to the Medicare program. If offsets, which tend to increase the use of hospital services, are seen from Medigap restrictions, this may be a special issue for the HI trust fund.
A further spending concern is that restrictions on Medigap make TM much less attractive and may accelerate the growth of costly MA enrollment. However, it is unclear how much switching would occur because of Medigap restrictions (discussed below).
Another important limitation is that existing policy proposals based on restrictions take aim at Medigap and do not address externalities that may be introduced by employer-sponsored supplemental insurance. In principle, it may be possible to extend restrictions to ESI as well, though this may add administrative, political, and legal difficulties.
Finally, certain Medigap restriction plans may increase Part B premiums. This is because Part B premiums are purposefully set to cover 25% of projected Part B costs, and the CBO model expects their suite of analyzed changes to increase Part B spending.
Supplemental insurance taxation
A simple and appealing option is to tax supplemental insurance plans to offset the additional costs to Medicare associated with their use. Generally, this is conceived as a tax on premiums. As discussed above, beneficiaries exhibit meaningful, though not dramatic, responses to changes in the price of premiums. A tax makes it possible for beneficiaries to express how much they value their coverage, either by dropping it if it is not worth it, or by retaining it at a substantially higher price. Either way, Medicare can recoup the costs associated with extra spending. A supplemental insurance tax also has the benefit of applying to both employer–sponsored plans and Medigap.
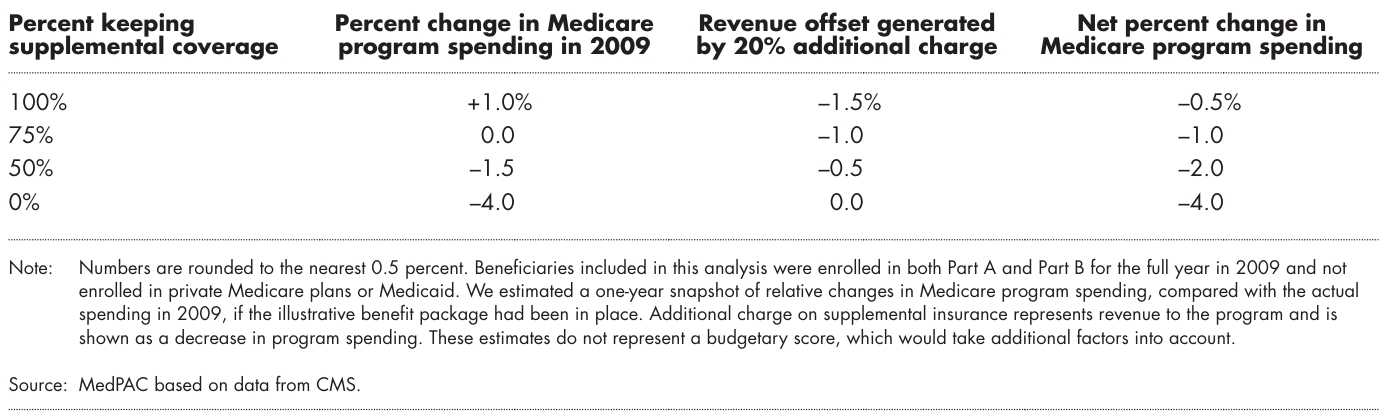
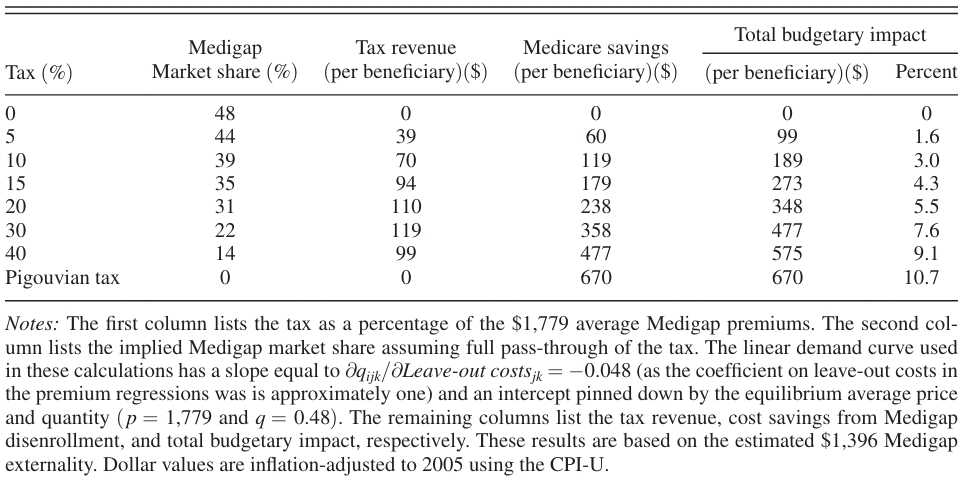
The revenue or savings that are received by a tax depend on the size of the tax and on how beneficiaries respond. MedPAC (June 2012) deferred estimating how many beneficiaries would drop SI coverage because of a 20% tax and instead presented a range of options as reflected in the table below. Cabral and Mahoney made an estimate that incorporates assumptions about how many people would drop coverage, which is also provided below. In both cases, the savings from a tax are expected to be very high.
Cabral and Mahoney find that an approximately 78% tax fully offsets the deleterious fiscal consequences that SI imposes on Medicare. This tax would save about 10.7% of the entire Medicare budget and eliminate Medigap. A more conservative 15% tax would save 4.3%. Adjusting their estimates for inflation, a 15% tax would raise or save $21.1 billion per year, and a 78% tax would raise or save $51.6 billion per year. The funds from this tax may support an OOP cap or be applied to shoring up the HI trust fund.
An important note is that the cost savings estimated by Cabral and Mahoney are likely to be too high in today’s market. This is for three reasons. First, the methodology is more likely to be biased toward overestimating the externality than underestimating it. Second, Medigap has a much smaller market share now than it did in the years that form the backbone of that analysis. Third, first-dollar coverage, which is associated with the heaviest overuse, has already been curtailed since that time.
Figure 11. The impact of a 20% supplemental insurance tax on Medicare spending and revenue depends on how many beneficiaries respond to the tax, 2009
Source: MedPAC (2012)
Figure 12. Impact of different possible Medigap tax rates on Medigap market share, tax revenue, Medicare savings, and the overall budget, in 2005 dollars
Source: Cabral and Mahoney (2019)
Tradeoffs and limitations
There are multiple reasons that a tax, while directionally effective, may have a blunted impact. First, to the extent that the tax leads people to choose less generous or no Medigap coverage, there may be offset issues as described above. Another concern is that a single tax rate treats all plans the same. There is considerable variation in how much SI plans may increase spending, so it may be unreasonable to penalize high cost-sharing plans in the same way as first-dollar coverage plans.
Some evidence has shown that raising supplemental insurance premiums increases movement into MA. A 2002 study found that an approximately $250 increase in Medigap premiums was associated with an 8% increase in Health Maintenance Organization (HMO) enrollees. By contrast, dropping MA to move into TM is very unusual, perhaps in part because of the difficulty in purchasing Medigap (see below). Statutes could be changed to make it easier to move into TM.
Medigap elimination
Given the significant externality burden, a question worth answering is whether there is any need to retain Medigap at all. Some proposals suggest the eventual elimination of Medigap, which could save money and simplify the enrollment process for seniors. Proposals that make this suggestion are usually paired with substantial improvements to the benefit design of TM. The elimination of Medigap is likely to save Medicare a very large amount and is more certain in its effect than restrictions or a tax would be. One proposal from the American Action Forum finds that eliminating Medigap in 2026 would save $22 billion in the first year and $286 billion over a 10-year period.
Eliminating Medigap would help simplify the currently complex process of enrolling in TM. The challenges of Medicare enrollment are a major impediment for many in choosing a plan that works for them. Today, despite the number of MA plans, MA enrollees only need to choose one plan. By contrast, TM enrollees must make a series of choices about participation in Parts A and B, supplemental insurance, and Part D benefits. This is what Garrett, Holahan, and Zuckerman call the “three-stop shop” of TM. The difficulty of this process makes older adults reluctant to switch coverage and may deter some from enrolling in TM in the first place.
Limitations
The obvious drawback is that eliminating Medigap under the status quo would leave millions on the hook for higher levels of spending. Further, the vast majority of Medigap enrollees are satisfied with their existing supplemental coverage, and eliminating that coverage would be a shock. This is why it is essential to improve the current Medicare-only benefit design before eliminating Medigap. How generous does the benefit design need to be before it is reasonable to eliminate Medigap? There is no clear answer.
Seniors value supplemental coverage for different reasons and to different degrees. While they do express the desire for a cap as one of the main reasons they choose supplemental coverage, they also like the other benefits of their plans and the reassurance that comes with paying a monthly premium rather than always thinking about cost–sharing. It may be difficult to replicate the wide range of benefits that Medigap enrollees enjoy, and it is difficult to know which of those benefits they consider most essential. The introduction of an OOP cap alone may not be enough to counter the concerns about benefit loss among many Medigap enrollees. If beneficiaries perceive TM without Medigap as too stripped down for their level of comfort, then eliminating Medigap might provide a strong incentive for shifts to Medicare Advantage. The American Action Forum estimates that Medigap elimination would lead 7.4 million enrollees to switch to Medicare Advantage. Presumably, an OOP cap or otherwise improved cost-sharing structure would blunt that effect.
The primary issue that elimination solves, not to be underrated, is that of complexity. It also maximizes the positive fiscal impact for Medicare. However, eliminating Medigap still leaves much of the complexity of TM enrollment intact, as questions remain related to initial Part A and Part B enrollment, Part D coverage, and employer wraparound coverage. Elimination also risks creating a large political backlash and leaves any issues related to employer-based supplemental insurance unsolved.
Medicare Advantage and guaranteed issue
Currently, there is a six-month Medigap open enrollment period for beneficiaries over 65 who are enrolling in Medicare Part B for the first time. Unfortunately, it can be extremely difficult for those enrolling after the initial six-month window to obtain a Medigap plan because insurers, after the window period, are allowed to use medical underwriting to deny a policy or charge higher premiums. Guaranteed issue protection could allow those in Medicare Advantage plans to enroll in TM plans without being subject to medical underwriting. This reform is different from the other SI reforms listed here because it would likely increase, rather than curb, enrollment in Medigap plans. This means it is important to combine guaranteed issue with the other reforms proposed above. If combined with a tax or Medigap restriction, then on balance, the reforms could still reduce SI enrollment, and savings would still be seen.
The argument for guaranteed issue protection in the context of the overall reform project is that some portion of enrollees would benefit from the large range of options in TM, but they are currently locked into MA plans because of concerns about cost. This is a special problem for those experiencing negative health shocks who might benefit from the flexibility of TM. Indeed, the population of switchers appears to be sicker on average, and they cost more than the typical TM enrollee. Experiencing a negative health shock is associated with transitioning from MA to TM. Guaranteed issue can empower enrollees, both sick and healthy, to make the choice that is right for them.
This may present a problem for Medicare financing; however, the ultimate budget impact is likely to be quite small. First, some research indicates that switchers from MA to TM are becoming less adversely selected. Second, the absolute rate of switching induced by guaranteed issue will probably be low. Implementation of guaranteed issue regulation in several states was not associated with a statistically significant change in switching from MA to TM in the overall Medicare population, and was associated with only a 1% increase in switching from MA to TM for those experiencing negative health shocks. Third, if beneficiaries induced to switch to TM by guaranteed issue had stayed in MA, the cost of their care would have been reflected in the rebates paid to MA plans. Finally, switchers’ cost of care is driven by SNF usage, and Cabral and Mahoney find no evidence that Medigap insurance induces overutilization of SNF care.
The bottom line is that guaranteed issue protection is unlikely to be a significant drag on the budget. It is even possible that it is a budgetary positive if beneficiaries who move from MA to TM with Medigap are less costly to insure under TM. Regardless, guaranteed issue is quite likely to increase Medigap premiums for the entire pool of Medigap beneficiaries. This probably should not be a major concern since Medigap plans are currently priced too low given their externalities.
The introduction of an OOP cap may make switching between MA and TM more likely, even without guaranteed issue, but guaranteed issue is a reasonable way to try to accelerate the process and is not incompatible with Medigap restrictions or taxation.
Concluding observations
This paper reviewed options to improve TM across three design domains, with the intention of maintaining TM as a good choice for Medicare beneficiaries. The most fundamental change we consider would involve capping beneficiary OOP costs. That reform stems directly from the basic principles of insurance—the most valuable forms of coverage protect against large losses, and currently TM does not provide that protection. A well-designed catastrophic cap would both improve efficiency in risk–bearing and strengthen TM’s competitive position relative to MA. While a range of caps is plausible, a cap of $5,000, roughly the average currently imposed by MA plans, would achieve these efficiency and competitive goals. Estimates of the cost of a cap at this level range from about $20 to $40 billion per year.
The establishment of an OOP cap should be accompanied by a redesign of Medicare’s cost–sharing provisions and reform of the supplemental insurance market. Current cost–sharing in TM is complex, and its design, which particularly targets inpatient treatment, is generally inconsistent with the areas where concerns about overuse are greatest. There is little downside to unifying the deductible for Medicare Parts A and B into a single annual deductible for all Part A and B spending. This would substantially reduce complexity. The design of cost–sharing above the deductible, and in particular, whether there should be constant coinsurance or a schedule of copayments, involves a trade-off between complexity and policies that promote the use of higher–value services. Given the limited evidence on the effectiveness of service-specific cost-sharing and the need for continuous updates of this design, it may be more straightforward to adopt simple coinsurance rates.
Most, though not all, TM beneficiaries have supplemental insurance, either by purchasing Medigap coverage or through employer retiree plans. One reason people choose this coverage is to cap OOP payments—but that is not the only reason. Supplemental insurance reduces cost-sharing for beneficiaries, providing people with risk and convenience protection, but it also substantially increases Medicare spending. Eliminating supplemental insurance altogether would generate considerable savings for Medicare, but even if coupled with an OOP cap and redesigned cost-sharing in TM, it would disadvantage many current purchasers. A middle ground would be to tax all sources of supplemental insurance and to use the funds to enhance the TM program, further reducing the demand for supplemental insurance.
At the same time, it would make sense to make regulatory reforms to the supplemental insurance market. Currently, in most states, people who seek to enroll in supplemental insurance after the initial enrollment window closes face underwriting, intended to limit adverse selection into supplemental coverage. Difficulties with enrolling in supplemental insurance may impede MA beneficiaries from returning to TM. Evidence from states that have guaranteed issue for Medigap coverage suggests that while guaranteed issue is likely to raise Medigap premiums somewhat, adverse selection will not destroy this market. Requiring guaranteed issue for Medigap coverage would make transitions from MA to TM easier and would provide people with serious health conditions valuable protection.
Related Content


Authors
Appendix
-
Acknowledgements and disclosures
The authors gratefully acknowledge financial support from the Commonwealth Fund and Arnold Ventures.
The authors thank Michael Chernew, Gretchen Jacobson, and Wendell Primus for their comments on earlier drafts. The authors also thank Shivaek Venkateswaran for fact-checking assistance and Rasa Siniakovas for editorial and web posting assistance.
-
Footnotes
- Throughout the paper, numbers noted as inflation-adjusted are adjusted to 2025 dollars by the core consumer price index.
The Brookings Institution is committed to quality, independence, and impact.
We are supported by a diverse array of funders. In line with our values and policies, each Brookings publication represents the sole views of its author(s).