Introduction
In 2017, Congress launched one of the nation’s largest-ever experiments in using the federal tax code to attract private investment into economically distressed communities: Opportunity Zones. The tax incentive offered tax benefits to investors who directed eligible capital gains into designated low-income census tracts. The underlying proposition was straightforward but consequential: Patient private capital, encouraged by a federal incentive, could help generate economic activity in communities that conventional markets and public investment had failed to reach, or help accelerate community-led efforts to advance local development goals.
Opportunity Zones (OZs) emerged from a long, bipartisan history of place-based economic policy. Across several presidential administrations, federal policymakers have used place-based tools such as Enterprise Communities, Empowerment Zones, the New Markets Tax Credit, Promise Zones, and—more recently—the Justice40 initiative to concentrate resources, reduce barriers to investment, and improve economic conditions in communities facing persistent challenges. These programs vary substantially in their design and implementation, yet each reflects a recurring recognition that equitable and sustainable economic growth is neither guaranteed nor evenly distributed, and that the long-term economic performance of the United States depends, in part, on whether more communities can connect their residents and business to investments, jobs, infrastructure, and a better quality of life.
The scale and flexibility of OZs distinguished the tax incentive program from many of its predecessors. Governors designated thousands of eligible census tracts and investors were given considerable discretion over where and how to deploy capital within them. Supporters argued that this flexibility could move resources more quickly and support projects that otherwise struggled to secure financing. Critics warned that limited reporting requirements and target rules as well as the absence of explicit community-benefit standards could direct subsidies toward projects that would have proceeded without the incentive or toward neighborhoods already positioned for growth. These competing claims have shaped the public debate over OZs since the first investments were made.
In Partnership With

This report brings new evidence to that debate. It offers retrospective, tract-level analysis of 7,174 of the 7,826 designated OZ tracts across all 50 states and Washington, D.C., from 2018 through 2025. We use a novel dataset of building activity (albeit one that does not distinguish buildings by cost or size) to examine how the tax incentive has shaped construction activity and neighborhood change (namely, displacement). We also assess how these outcomes vary across communities with different predominant land uses. The central question is not whether OZs uniformly succeed or fail, but to understand where they have generated stronger economic and community outcomes, where they have not, and what local factors help determine success.
We know investment alone is not synonymous with shared prosperity. In some places, OZ capital has expanded housing supply, supported business formation, created jobs, and leveraged underutilized community assets—while in others, it flowed toward projects with limited community benefits or into neighborhoods already on a growth path. A rigorous assessment of OZs must therefore look beyond total investment to understand tract-level changes. This report applies that framework to “OZ 1.0” (the 2017 iteration of the program from the Tax Cuts and Jobs Act, which is distinct from the permanent “OZ 2.0” version that will have new round of designations in 2026), identifying the conditions under which investment translated into inclusive growth in order to inform more effective place-based strategies going forward. Our key findings include:
- The OZ period aligns with a period of increased building in the United States. Builds per year rose 9% in 2019-2024 relative to 2017-2018.
- Building market share shifted into OZs during the designation period (2019-2024). OZs represent 9.9% of all census tracts, and in 2017-2018, their share of building activity was only 5.8%. After designation, the share of all U.S. new building construction in OZs increased 13.8% (from 5.8% 2017-2018 to 6.6% 2019-2024). Yet even with the generous incentive, OZs remain below market share parity, consistent with their economic circumstances.
- The existing land use of a tract matters, as do macroeconomic conditions. We classify OZs into five types by dominant land use. Of the five tract types, three saw big increases in building activity after designation, while two saw notable declines.
- Almost half of OZs saw accelerated growth: 46% of designated OZs saw increases in building activity of at least 15%. However, tract type plays a big role in those increases. In three out of five tract types, the median OZ saw almost no building activity.
- We found no association between growth and displacement in most OZ tract types and states. However, only 26% of OZ tracts saw growth without displacement. This speaks to the macroeconomic and demographic conditions facing these tracts, which have greater influence than the tax incentive.
- Tract characteristics beyond land use also matter. Our exploratory statistical analysis suggests some tract characteristics that may be more conducive to positive outcomes.
Taken together, our findings reveal interdependent—and at times, seemingly contradictory—patterns of state-level variation in OZ outcomes. These differences suggest that the federal tax incentive’s effects were shaped not only by the flow of OZ capital, but also by local market conditions and complementary state and local policies. Overall, however, the results are consistent with much of the existing literature: OZs can be a powerful financing tool for accelerating capital deployment into less economically dynamic communities, particularly for real estate development.
The experience of OZ 1.0 also makes clear that capital is a means, not an outcome. As states approach OZ 2.0, they should work closely with local governments, residents, and businesses to define success before selecting tracts. That definition should identify both the policy objectives the incentive is intended to advance—such as housing production, clean energy deployment, rural redevelopment, or entrepreneurship—and the place-based outcomes communities seek, including local ownership, community wealth creation, affordability, and stronger economic mobility. States should then develop an explicit theory of change that explains what the capital is intended to accomplish and identifies the complementary policies, public investments, incentives, capacity-building strategies, and regulatory reforms required to achieve those results. This planning will be especially important in tracts where single-family housing is the predominant land use and the tax incentive alone may be insufficient to support meaningful development or broader community benefits.
Context and literature review
The Opportunity Zone tax incentive was part of the Tax Cuts and Jobs Act of 2017; in 2025, the One Big Beautiful Bill Act made a modified version of it (“OZ 2.0”) permanent. In both versions of the program, investors can defer or avoid taxation of realized capital gains by reinvesting those gains in an investment vehicle, known as a Qualified Opportunity Fund, that holds at least 90% of its assets as new or substantially improved property in census tracts the IRS has designated as Qualified Opportunity Zones.
The original program allowed each state’s governor to nominate as OZs a number of census tracts equal to either: 25% of the state’s number of low-income communities as defined in 26 USC § 45D(e)(1) (based on 2011-2015 or 2012-2016 American Community Survey data, and rounding down); or 25 tracts, whichever was greater.
A census tract can qualify as a low-income community in two ways: either it has a poverty rate of at least 20%, or its median family income (MFI) is below 80% of the area MFI (the statewide MFI or, if the tract is in a metropolitan area, the greater of the statewide and metropolitan area MFI). As a result, states with larger numbers of qualifying low-income communities generally received more OZs, while states with fewer than 100 such communities could designate up to 25 tracts, giving them a proportionally larger allocation.
Along with low-income communities, up to 5% of a state’s designated OZs were permitted to be non-low-income-community tracts. However, for such a tract to be eligible, it had to be contiguous with a low-income-community OZ and have a median family income not exceeding 125% of the median family income of that OZ.
In addition, while the program initially only included the 50 U.S. states and Washington, D.C., the Bipartisan Budget Act of 2018 amended this, designating all Puerto Rico census tracts identified as low-income communities based on 2011-2015 American Community Survey (ACS) data as OZs.
Overall, 8,764 census tracts have been designated as OZs, with 7,826 of them in the 50 states and Washington, D.C. (Figure 1). OZs had roughly twice the median poverty rate and two-thirds the median family income of tracts overall, as well as elevated unemployment rates, housing and transportation costs, and populations of racial and ethnic minorities. A set of descriptive statistics for OZs in the 50 states and Washington, D.C., can be found in Table 1. Additional statistics are included in Table 3 in the Appendix.




The IRS certified the final OZ designations on July 9, 2018. Since then, research has yielded some illustrative insights into the program. A study conducted by group of authors that included employees of the U.S. Treasury Department with access to the confidential tax records of Opportunity Funds found that half of OZ capital was invested exclusively in housing, and 75% included a residential component. This is consistent with reporting from industry sources.
The primary benefit of the OZ designation appears to be new housing. Designated OZs saw on average 47.5 additional new housing units per tract between 2019 and 2025, with the effect accelerating over time. In urban areas, researcher Harrison Wheeler found that designated tracts saw significant increases in new construction for both residential and commercial land uses compared to eligible but undesignated tracts. In addition, designated OZs saw increases in job creation, but that was often associated with job decreases in nearby tracts, and changes in OZ resident employment likely benefited new movers to those zones, not existing residents.
Examinations of OZs have found significant variations in the process by which states designated the zones, including both political effects and already planned development activity, and thus real differences in the characteristics of OZ tract populations between states. As implementation proceeded, a 2021 survey of 56 state government officials by the Government Accountability Office (GAO) found that only 20 respondents felt the program was a net positive. This is likely in part because OZ investment is not geographically evenly spread between or within states. OZ investment tends to flow to low-income tracts in higher-income counties, and 65% of OZ fund capital went to the top 20% of tracts by pre-existing investment history. An Urban Institute study of Ohio’s Opportunity Zones found even more highly concentrated investment, with just nine tracts receiving over half of the state’s OZ capital flow (Ohio has 320 designated OZs). Ultimately, the Urban Institute finding on capital concentration juxtaposed with the Treasury study suggests that the OZ experience from state to state continued to vary after designation and into outcomes.
Many of the neighborhoods experiencing demographic and economic change were already on that trajectory before OZ designations took effect. An early analysis from the National Community Reinvestment Coalition found high overlap and adjacency (69%) between OZs and census tracts that were already gentrifying prior to designation, and a unique exploration by Kurban et. al., using local administrative data found an association between OZ designation, in-migration of higher-income residents, and out-migration of lower-income residents in the District of Columbia. While these findings do not establish that OZ designation alone caused displacement, they do suggest states often selected areas where revitalization was already underway and where incentives may have accelerated existing market trends.
Further research is needed to clarify when OZ investment contributes to displacement and which policies best ensure that residents and business can remain in and benefit from revitalizing communities. Overall, these findings from the existing literature raise two key, mostly unanswered research questions that we explore in this paper. First, to what extent do OZ outcomes vary by state, and what states are potential candidates for showing helpful lessons learned on designation and implementation? And second, to what extent did designated OZs actually see change, and was the change positive or negative?
Data and methods
Our analysis is based on a dataset of building construction dates by year acquired from Cotality’s ListSource database. This database, compiled from state and county real property records, covers the District of Columbia and all states except Idaho, Kansas, Montana, and South Carolina. In addition, several counties in other states are missing or incomplete. With two exceptions (Pennsylvania and Maine), these omissions were not large enough to invalidate state-level analysis. (See the methodological appendix for details on the data quality and exclusions.)
The Cotality dataset consists of the addresses of all buildings recorded as built between 2017 and 2024, inclusive, for designated census tracts. We geocoded these addresses and calculated per-year counts of structures constructed in each 2018 Qualified Opportunity Zone for the periods before (2017-2018) and after (2019-2024) the OZ program went into effect. We also have state-level building totals for the same period. We use per-year counts to normalize the data to account for the fact that we have only two years of baseline data available to compare to the six years of data for the period after OZ designation.
It is important to keep in mind that the per-year building counts generated from the Cotality dataset represent numbers of structures, without regard to the sizes or use types of those structures. In other words, a single-family home, a free-standing convenience store, a hundred-unit apartment building, and a 20-story office building will each appear as a single building in the data. While this means that we cannot measure the scale of what is built in terms of, for example, number of housing units or square feet of commercial space, it also means that we have broader visibility into construction than more-focused datasets would provide: Both residential and all forms of non-residential buildings are included in the Cotality dataset.
In addition, only new-build construction, or renovation significant enough for government real property records to update year-built values, will show up in this dataset. This means that we can more accurately measure the amount of change through new investment compared to working with counts of housing units from the ACS or counts of addresses from the U.S. Postal Service, where demolition projects are conflated with new construction.
Assessing the effect of land use type on tract growth
To account for the differences in building types and associated differences in the significance of a given number of new buildings per year, we divided OZ tracts into five groups (Figure 2) based on their built environment:
- Rural tracts: All tracts the IRS has identified as qualifying as Rural Opportunity Zones under the One Big Beautiful Bill Act of 2025. Because these tracts generally cover large areas and contain a variety of land use types, we did not find it useful to subdivide them by type.
- Commercial tracts: Non-rural tracts containing fewer than 100 housing units in 2018, or with more than twice as many jobs as residents in 2018 based on LEHD-LODES jobs data. Due to the absence of 2018 LEHD-LODES data for Alaska, only the housing unit count rule was applied to Alaska tracts.
- Single-family home (SFH) residential tracts: Non-rural, non-commercial tracts with at least two-thirds of their housing units consisting of single-family homes, whether attached or detached.
- Mixed residential tracts: Non-rural, non-commercial tracts with between one-third and two-thirds of their housing units consisting of single-family homes, whether attached or detached.
- Multi-family home (MFH) residential tracts: Non-rural, non-commercial tracts with fewer than one-third of housing units consisting of single-family homes.

Measuring the relationship between growth and displacement in Opportunity Zones
We analyzed growth and displacement in OZs via a two-dimensional analysis, with independent determinations of whether each tract had experienced growth and displacement over the period from 2018 to 2024. We identified tracts as experiencing displacement following Acharya and Morris 2022: Displacement occurred if the tract experienced a loss of total population or population of a plurality racial-ethnic group (other than non-Hispanic whites). We classified tracts as experiencing growth if the average builds per year in the tract was at least 15% higher during the period 2019-2024 than during the period 2017-2018.
Identifying non-land-use determinants of growth in Opportunity Zones
To analyze the determinants of growth other than land use in OZs, we performed exploratory multi-variable linear regressions with the common logarithm of the number of builds per year over the period 2019-2024 as the dependent variable and with a large selection of potential independent variables. Details on model fits and the variables used can be found in the methodological appendix.
Finding #1: The OZ period aligns with a period of increased building in the United States
The larger context around the OZ program is the dramatic decline of the U.S. construction sector after the 2007 Great Recession, as reported by the industry (per Chart 4a of CWPR 2025) and observed in public macroeconomic data. By 2018, when the OZ program was created, the construction sector had completed a roughly decade-long recovery to its 2007 level on several measures, including the number of non-employer establishments and real value added to gross domestic product. This growth continued in subsequent years, as U.S. building activity per capita increased by 24% between 2017 and 2021 (Figure 3). More recently, construction activity has declined from its 2021 peak amid a sharp surge in construction-sector inflation in 2022 that substantially exceeded overall consumer inflation.
By 2024, building activity per capita nationally had fallen back to its 2017 level (Figure 3). OZs were a notable exception. Although building activity in OZs also declined from its pre-inflationary peak, builds per 100,000 residents remained 28% above their 2017 level in 2024, narrowing the gap with the country as a whole by 47%. This relative performance is especially notable given the composition of designated OZs: Single-family tracts are substantially underrepresented, while multi-family tracts are overrepresented (Figure 2). Because builds per capita are structurally lower in denser, multi-family areas, this composition would tend to depress the OZ measure rather than improve it.

In addition to the larger context of the recovery from the Great Recession, the story of building activity trends in the United States cannot be understood without noting the multi-decade rise of the Sun Belt. For most states outside the Sun Belt, building market share trends were just slightly negative when looking at change before and after the OZ designation milestone, while California’s market share loss stands out (Figure 4). This macro trend created a structural disadvantage for OZs in those states, while Sun Belt gains, especially in Texas and Florida, could have given marginal locations in those states a lift.

Finding #2: Building market share shifted into OZs during the designated period
The average annual rate of building activity in OZs over the 2019-2024 period increased 26% relative to 2017-2018. Some of this increase represents growth that would have occurred anyway in other census tracts, and some is perhaps net new building activity. To explore this, Figure 5 juxtaposes the percentage-point change in OZ market share within a state to the percentage-point change in the state’s share of the national market before and during the OZ period. If a state gained market share relative to other states within the nation, it is plotted on the right side of the Y-axis. If as a state gained market share, the OZ tracts within that state simply grew at roughly the same rate as all other tracts in that state, the state’s point would remain near the X-axis (for example, as in the case of Tennessee). If as a state gained market share, OZs disproportionately sited that growth, the state’s point is located in the upper right quadrant (as with North Carolina, Florida, and Texas).
It is notable that there are no cases in which states gained market share and OZs within lost substantial market share (the vacant lower right quadrant of Figure 5). Table 5 in the appendix presents these statistics for each state. In this table, Utah stands out as a state that experienced a very large increase in OZ building activity, but where OZs ticked slightly down in market share in the state because other tracts in the state grew even more.

Most states had close to stable national market share, as shown by the very large cluster of points around the Y-axis. The spread around the X-axis is far more notable: Some states saw relatively dramatic market share shift into designated OZs after 2018 (e.g., West Virginia), some saw no change (e.g., New York and Tennessee), and a small number saw notable declines (Wyoming, New Mexico, and Iowa). Because we do not have tract-level building data for the low-income census tracts that were eligible but not designated as OZs, we do not know from this analysis whether market share gains for OZs came at the expense of undesignated low-income tracts or other tracts in the state as a whole. Interpreting Figure 5, however, it is clear that most gains for OZs came from within-state shifts rather than net state gains (the possible exceptions being North Carolina, Florida, and Texas). This may explain the limited enthusiasm for the program among the state government officials the GAO surveyed.
This finding remains notable from a parity perspective. The share of all new U.S. building construction happening in OZs increased from 5.8% in 2017-2018 to 6.6% in the aggregate of 2019-2024. In other words, OZ national building market share increased 13.8% after designation. However, many of the states where OZs gained significant market share are relatively small, and these national gains are driven primarily by Texas and Florida. Without Texas and Florida, the OZ share of new building construction rises from 5.6% to 5.9% rather than 5.8% to 6.6%.
Opportunity Zones are 9.9% of all census tracts, and the movement toward parity (i.e., if 9.9% of tracts got 9.9% of builds) can be summarized in a single statistic as the ratio of OZ building market share to OZ coverage, shifting from 0.6 to 0.7, closer to the parity build-to-coverage ratio of 1. Twelve states, shown in the left half of Figure 6, outperformed the national parity measure of 0.7, and two states outperformed parity itself (i.e., had ratios greater than 1). For example, New Mexico had 499 census tracts in 2017. Of these, 63 (12.6%) were designated as OZs. Per Table 5, these tracts contained 16.1% of the building activity in New Mexico between 2019 and 2024. The ratio of 16.1 divided by 12.6 is 1.27, indicating that New Mexico OZs captured more building activity than their proportionate share should have been based on geographic coverage.


Even with the generous OZ incentive, most zones in most states remained below market share parity, consistent with their economic circumstances. For example, even though Texas had more builds in OZs per capita than any other state, OZs still saw lower build market share than they would have if building activity was distributed evenly. This illustrates how challenging it is for economic development policy to move the needle or even hold the line in contexts with higher concentrations of poverty or macroeconomic contraction, such as the state as a whole losing market share. Just as it was notable that during the 2019-2024 period no states gained market share unless their OZs’ within-state market share remained stable or also grew, it is arguably even more noteworthy that the upper left quadrant of Figure 5 shows states where OZs gained within-state market share even as the state’s share of the national pie shrank (e.g., Colorado, Washington, and Delaware).
Given the market share gains of OZs in many states, this also raises the question of whether there is any relationship between a state’s OZ coverage and state market share. Because poverty is not evenly distributed geographically across or within states, some states have more OZs than others. For example, 18.9% of Wyoming census tracts are OZs, while only 7.6% of Hawaii’s tracts are designated. Could going “all in on OZ” help a state gain market share? We tested for and found no statistical correlation between OZ coverage and change in state market share. A complete set of the statistics referenced in this section for each state can be found in Table 5 in the appendix, while the right half of Figure 6 shows the eight states as of 2024 that had more builds in OZs per capita than the national OZ trend shown in Figure 3 above. The list is a mix of Sun Belt states and states that have the very highest shares of tracts designated as OZs (Wyoming and Mississippi). Colorado again stands out.
Finding #3: The existing land use of a tract matters, as do macroeconomic conditions
Figure 3 presented a “build gap” between OZs and the country as a whole. However, we know from Figure 2 that OZs contain different dominant residential land uses than are more typical in the nation at large. To distinguish apples from oranges, Figure 7 presents the same statistic for OZs typologized by their built environment. In 2017, there was a “build gap” between every type of OZ and the country as a whole. The gap was widest for multi-family zones, which is simply an expression of what multi-family housing is. The trend is more revealing: Over the designation period, the build gap closed for rural and single-family zones, narrowed for residential mixed zones, and widened for commercial and multi-family zones, as summarized in Figure 8.

Designated OZs saw their annual build rates increase 26% on average—nearly triple the national average over the same period. Of five tract types, three saw big increases in building activity after designation, while commercial and multi-family types saw notable declines. The latter two types combined compose 25% of the designated zones (Figure 2). Zones of these types tend to be located in and around the very center of metropolitan areas—in other words, downtowns. (We confirmed this by analyzing the regional geography of each zone type by calculating the distance between each zone centroid and the fifth-nearest regional activity center of the top 110 metropolitan areas by population. The median distances for each tract type are in Table 6 in the appendix.) Some downtown areas were challenged even prior to 2020, but the pandemic certainly collapsed demand for central business districts with the surge in remote work. It is therefore perhaps unsurprising to see a decline in building activity in these types of zones during the 2019-2024 period, even with the availability of a new investment incentive.

Cross-tabulating OZ outcomes by both land use and state is illuminating. The appendix presents a complete set of tables (Tables 8 to 12) showing the “build:coverage” ratios and “build:population” ratios of OZs by type for each state, and Table 2 below shows a shortlist of top-performing states by the latter metric. The “build:population” ratio is the state’s share of all OZ building activity in a particular type of zone divided by the state’s share of the total population covered by our dataset. This figure shows the diverse value propositions pursued by Opportunity Funds in different states. Multi-family investment in the District of Columbia led the nation, while Colorado saw much more development in commercial zones, and Arizona saw a lot of single-family activity. No state dominates across all types.

Finding #4: Almost half of Opportunity Zones saw accelerated growth
Almost half (46%) of designated OZs saw increases in building activity of at least 15% after 2018 (Figure 9). Fifteen percentage points of the 46% represent zones with no building activity at all in 2017 and 2018 and at least one build between 2019 and 2024 (“no-build to build”). We bucket this category separately, because the asymmetry between our pre- and post-designation periods, especially the brevity of the pre-period, could result in some overestimation of the real magnitude of trends, as any change from zero to non-zero is infinite on a percentage basis. However, we argue that two years is an adequate window to provide some insight into the level of building activity in an area the size of a typical census tract, and it is therefore notable that one-third of designated OZs saw a decline in builds per year after designation. Clearly, the designation is not a silver bullet for accelerated or even stable growth in the context of lower-income communities. However, it is equally clear that another one-third of designated zones outperformed the U.S. as a whole (which had a 9% change in builds per year, per Figure 8).

A much smaller share of tracts (16%) saw very large increases in building activity. This finding is consistent with what we know from the analysis of confidential tax records done by a research team that included authors from the U.S. Treasury, which found that 35% of OZ dollars go to the top 20% of tracts by income (Table 17 in the link). Yet our analysis suggests that tract type also plays a big role in illustrating where activity changes occurred (Figure 8). Rural tracts were disproportionately likely to see stable change (-15% to 15% change in building activity) and moderate increase outcomes relative to their actual share of the designated tract mix, while mixed residential tracts had divergent outcomes and were more likely to see big change (either flipping from no build to build or a greater-than-100% increase in build rate).

Two things can be true at the same time: In three out of five tract types, the median OZ saw almost no change in building activity (Figure 11), while close to half of OZs have seen increased growth (Figure 8). The OZ glass is half empty and half full. The state-level experience is even more variable (Table 5 in the appendix). While in 18 states, the median OZ saw no change in the rate of building activity, in three states (Hawaii, Vermont, and Delaware), building activity in the median OZ slowed down. In another 21 states, the median OZ building rate grew more than in the nation as a whole (most notably, Washington, D.C., and Florida). This wide range of outcomes for the OZs themselves both within and across states may also help to explain the mixed feelings about the program reported in the GAO survey.

Finding #5: We found no association between growth and displacement in most OZ tract types and states
While accelerated growth is a key outcome of interest for OZs from an economic development perspective, a key question for community development practitioners has been whether there are specific benefits or harms—especially gentrification and displacement—that accrue to or impact existing residents of designated tracts. In other words, are OZs “gentrification on steroids”?
We did not analyze the in-migration of demographically distinct groups (e.g., by income, race, and/or education). Instead, we focused on the specific harm of displacement, which may be racialized (impacting a specific racial group) or spatialized (impacting a whole tract). Our definition of displacement includes either or both potential outcomes. At the national level, we found that displacement is a common dynamic in OZs. However, this is not unique to designated OZs. The University of Minnesota Institute on Metropolitan Opportunity’s American Neighborhood Change project found that about 30% of all tracts in metropolitan areas are experiencing strong neighborhood change, and that the most common trajectories involve population loss of some kind (most commonly, higher-income households leaving, but also low-income displacement). We found displacement in 45% of designated OZs; given that these zones are almost all drawn from the smaller pool of low-income tracts and include substantial rural areas, it is not surprising that population loss of one kind or another is more common than in the University of Minnesota analysis.
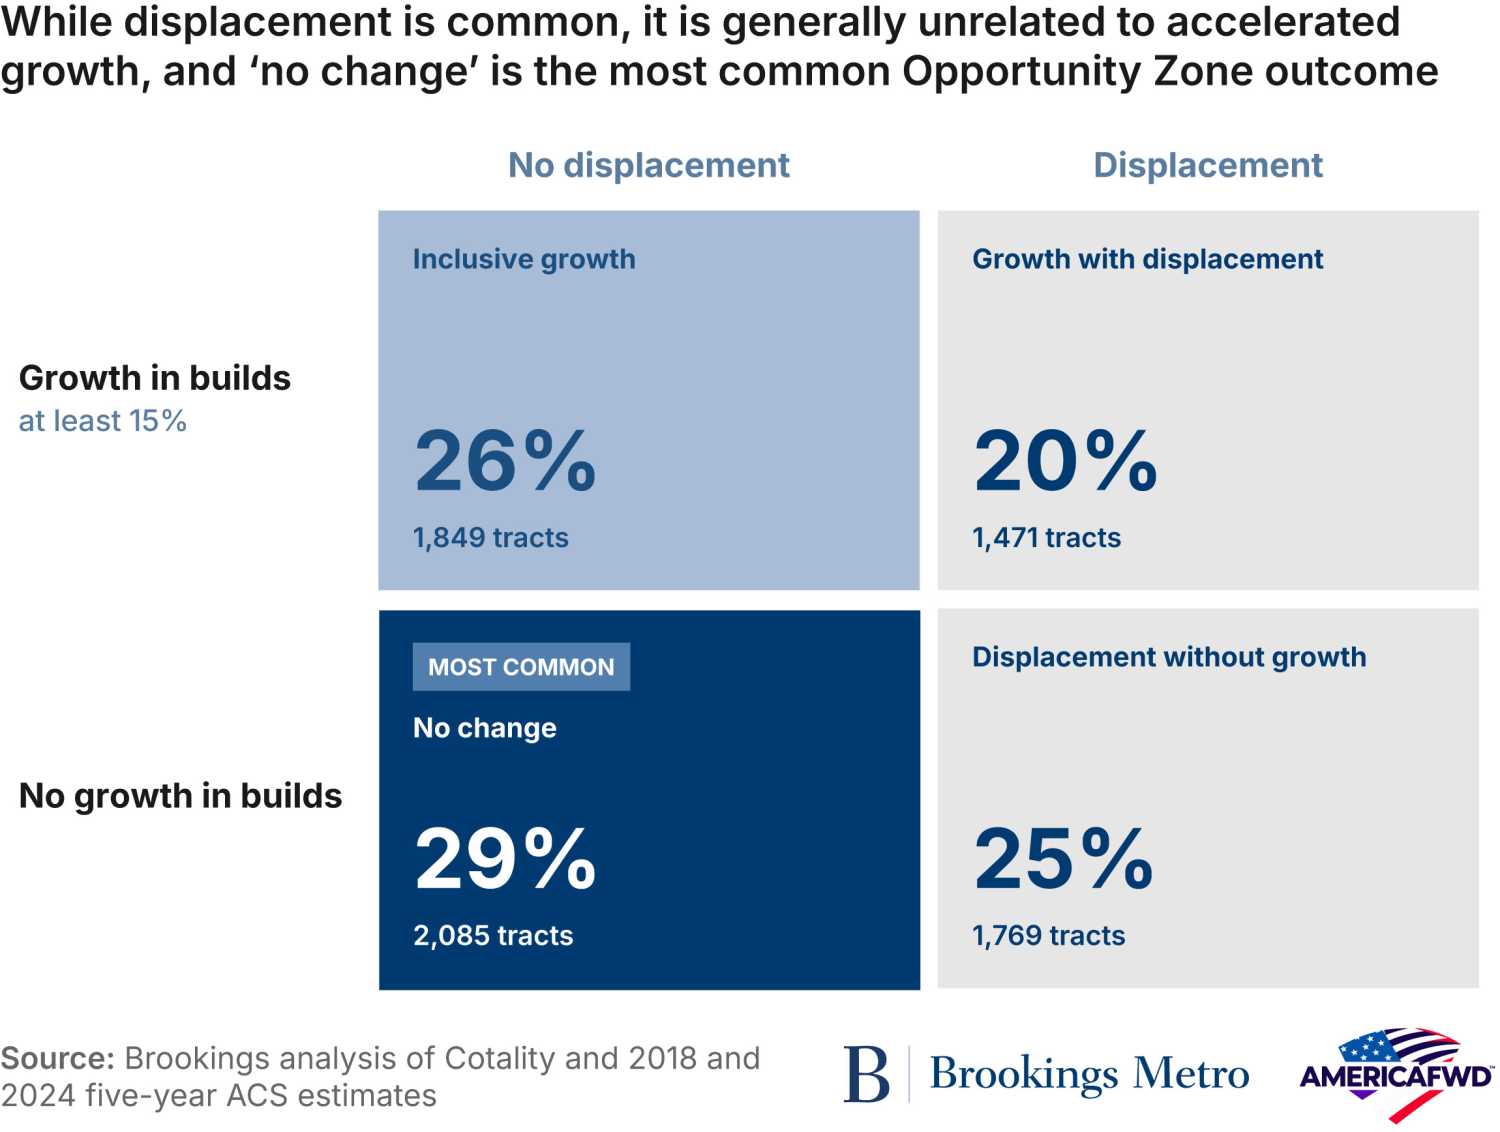
At the national level, we found that displacement is more common in OZs that did not experience substantial accelerated growth in their building rate. In addition, we found that accelerated growth without displacement is more common than with. In Table 13 in the appendix, we report these same distributions of outcomes for each of the tract types described in this report and each state. This cross-tabulation reveals some state-level dynamics that are consistent with concerns critics have raised about the OZ program. The District of Columbia in particular stands out as a jurisdiction with very high rates of displacement in the context of accelerated growth, and it is notable that the District received the highest OZ investment per capita, by far, relative to any other state (see page 10 of Coyne and Johnson 2026). However, in all other states and land use contexts, the share of zones with accelerated growth and no displacement is comparable or (in most cases) greater than zones with both acceleration and displacement. The one other exception is Kentucky, which is also notable for its very high shares of “no change” zones and “displacement without accelerated growth” zones.
Finding #6: Tract characteristics beyond land use also matter
We modeled 2019-2024 builds per year as a continuous outcome variable in five exploratory multivariate regressions (one for each tract type) with a large panel of potential explanatory variables in order to derive insights about what characteristics are associated with higher levels of building activity. These characteristics could be helpful variables for states to consider as they designate future OZs. This model specification allows us to investigate building activity in OZs in a slightly different way than the other analyses presented in this paper. The models do not examine building activity during the 2017-2018 period, so the outcome variable treats as equivalent a zone that has always had a high level of activity with a zone that became higher-activity after designation. In addition, we limited the model sample to only low-income tracts, not tracts that were eligible for designation because of contiguousness, because contiguous tracts are not eligible for designation in the OZ 2.0 program. The full model specifications are included in the appendix.
Our analysis identified only one characteristic that had a statistically significant (at 95% confidence) positive relationship with building activity across all five tract types: newer housing stock, as measured by the share of housing inventory built after 2009. In other words, tracts with more relatively recent housing construction activity also had more building activity during the OZ period. This is consistent with findings from other studies. Similarly, we found that zones with more small business lending activity reported through Community Reinvestment Act compliance had more builds, except in the multi-family residential model. Faster job and population growth, as well as high rates of self-employment, were associated with increased builds for all of the residential tract types, but not rural and commercial zones. Finally, we found that physically larger tracts with more land area had more builds, except in the commercial model.
Looking specifically at the rural model, we found that rural tracts with lower poverty, that were closer to activity centers in metropolitan areas, and that were more racially diverse had more builds. These three variables alone could compose, and perhaps already have composed, an Opportunity Fund investment thesis.
Within the residential tract types, the varying association of median household income was notable. In single-family tracts, lower incomes are associated with more building. In multi-family residential tracts, higher incomes are associated with more building. This divergence is logical considering the baseline conditions that developers are seeking arbitrage around—namely, lower and more attainable cost to enter in a single-family context supplying owner-occupants and higher potential rent returns in a multi-family context supplying rental units. Yet this finding demonstrates that there are no one-size-fits-all answers to what “kind” of zones states “should” designate. If the desired outcome is more building activity, for example, the answer is not zones of one land use or income type, but a checkerboard target crosstab of two variables.
What the data look like in place
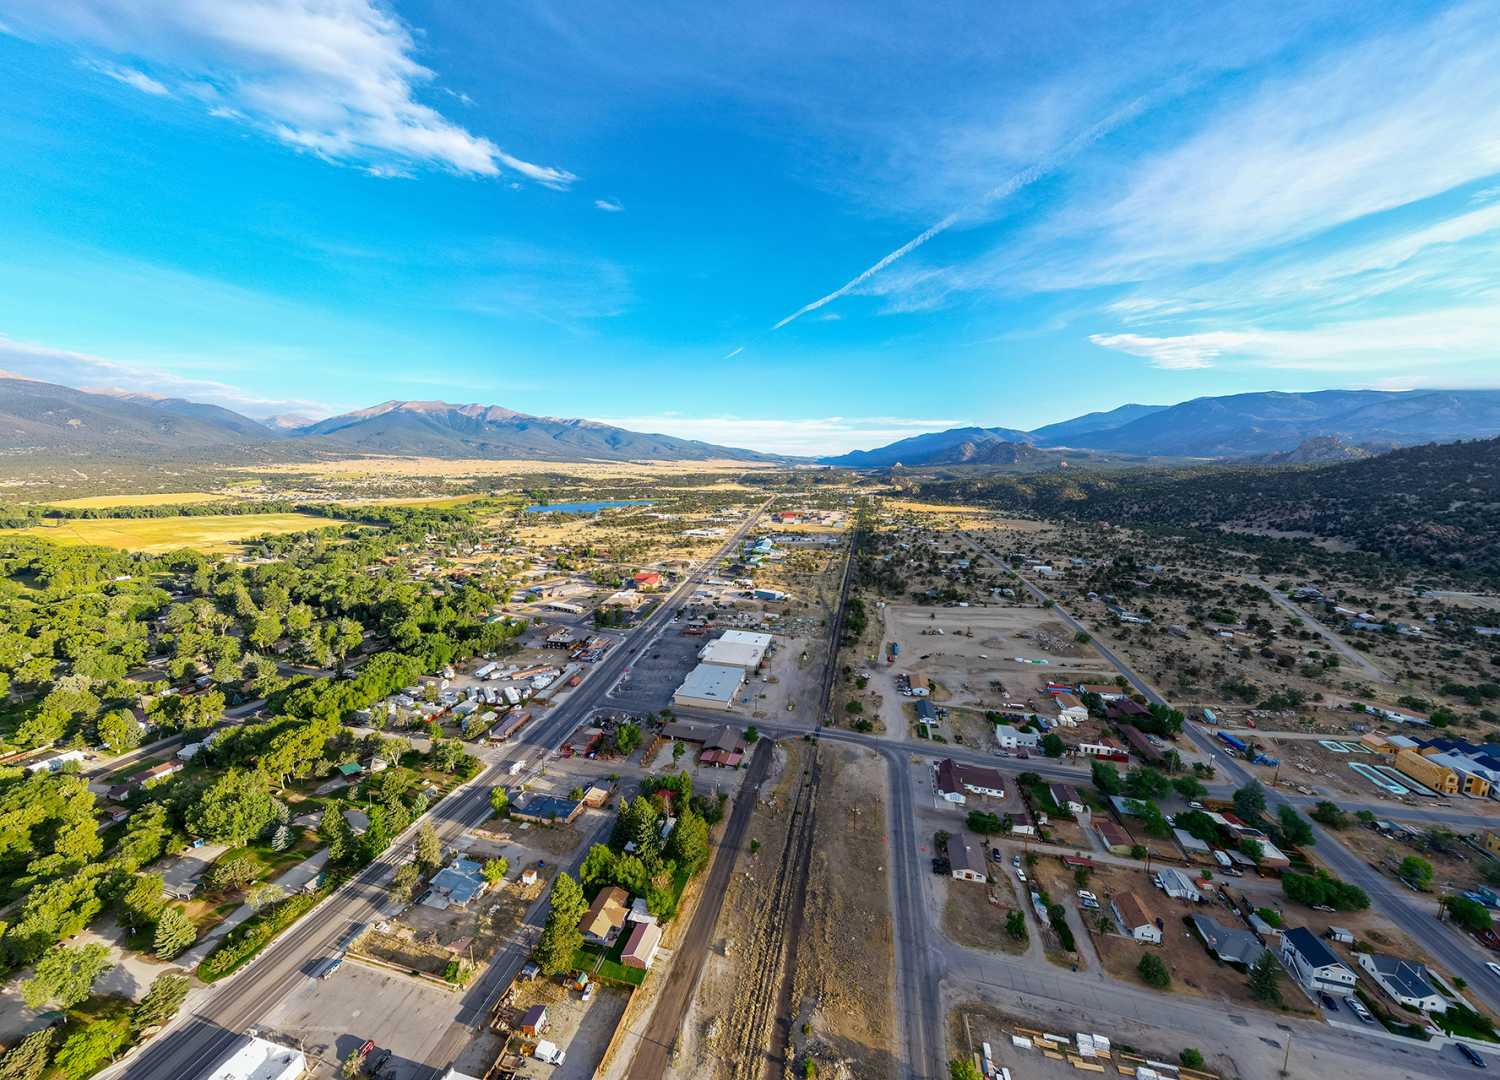
Census tract 08015000402 illustrates the OZ dynamic. The tract is one of two designated OZs covering the town of Buena Vista, Colo., which is located in Chaffee County at the base of the Sawatch Range. The county’s economic development corporation highlights the county’s assets and aligned state programs. The town is in a rural area, not located in any metropolitan statistical area, and a two-hour drive west of Colorado Springs. About 3,000 people live in Buena Vista, and the poverty rate (7.3%) is lower than both the state and country as a whole. However, the town qualified to be designated as an OZ because the median family income in one census tract is 76% of the state level (below the 80% threshold for designation), and the town’s other tract is contiguous. While most readers would not consider a place with 3.1% unemployment to be economically struggling, “rural resort” counties such as Chaffee face a housing affordability crisis comparable to superstar coastal cities: 49.9% of the county’s renter households are cost-burdened, and the median home price is $690,000.
In response to this market dynamic, the Four Points Funding Opportunity Fund focuses primarily on multi-family workforce housing in rural areas of Colorado. The portfolio includes a Buena Vista subdivision of 90 units of single-family homes, townhomes, and accessory dwelling units built on 45 parcels. This project, among others, bumped the building rate up in tract 08015000402 by 50% after 2018 and delivered much-needed new housing to the town. However, it is worth noting that the building rate actually declined by 10% in Buena Vista’s other OZ, even though it was also designated—perhaps because the pre-designation period growth rate in that zone was already high, leaving less available land for development in the post-designation period. In 2021, a modular housing factory opened in Buena Vista, which is supplying units to multiple projects, including a 60-unit affordable project in the town also partially financed by an Opportunity Fund. Most of the factory’s workers, however, come from outside the town, given the town’s already low unemployment rate.
Further south in another rural Colorado tract, almost to the New Mexico border, Costilla County’s one OZ had a different experience. The county has a long history of land speculation and a total population comparable to Buena Vista. In tract 08023972600, where the poverty rate is 25.8% and 44.2% of the population is Latino or Hispanic, the building activity rate fell by 18.2% between the pre- and post-designation periods. The population of the tract itself declined by a similar amount between 2017 and 2024, with the Latino or Hispanic population declining even more (23.7%), meeting our definition of displacement.
Meanwhile, in Denver’s tract 08031004404, there was no change in the (low) rate of building activity after designation. The vibrant, diverse East Colfax neighborhood had a relatively high rate of concentrated poverty in 2017 (34%), which remained largely unchanged even as the tract lost 8% of its population between 2017 and 2024. These losses were disproportionately concentrated among the tract’s Black population, resulting in racialized displacement, partially mitigated by efforts of local partners to prevent displacement and develop affordable housing and commercial spaces. The experience of this community illustrates how the building rate is just one measure of one outcome, and not always the most important way in which a community measures progress or impact. Other measures, such as increased occupancy and adaptive reuse of existing buildings, are equally worthy.
These narratives illustrate a common critique of the OZ tax incentive: that in some markets, it provides a subsidy to projects that were likely to happen eventually anyway, in places that are not really poor, and does nothing for many zones because financing is not their biggest problem. However, it also illustrates a common defense of the OZ tax incentive: that it speeds up much-needed projects that help non-wealthy households and grow the economy, though perhaps not for existing residents or businesses without direct state and local intervention. Critics and defenders of this program are not necessarily disagreeing with each other. There is also a lot of room for states and communities to define success locally and shape outcomes.
Limitations
There are limitations to this analysis that impact how the findings presented in this report should be interpreted and used. First, our findings are biased toward single-family home construction activity, because one house is measured the same way as one factory or one apartment tower. We cross-tabulated our analyses by tract type in order to partially mitigate this bias.
Second, our analysis is based on a dataset of building activity in OZs. However, an unknown share of the construction activity in these zones actually used OZ tax incentives. Therefore, none of the outcomes presented in this analysis should be attributed exclusively to the OZ incentive. These findings present what we hope are productively suggestive, hypothesis-generating observations in the context of the OZ designation, but they do not say anything conclusive about the actual impact of the incentive.
Finally, the uneven size of our pre- and post-designation periods—a limitation based on data cost and availability—mean that our estimates of pre-designation building growth rates are not as accurate as our estimates of post-designation growth rates. Therefore, great weight should not be given to the exact magnitude of an estimate for a single zone. The utility of the analysis is in the overall patterns that emerge over the aggregate population of the zones in terms of the directionality of trends.
Implications and recommendations
The goal of Opportunity Zones or any federal place-based strategy is not simply to move capital. It is to expand opportunity so that every American, regardless of address, can live in a safe, affordable, and thriving community. The findings of this analysis reinforce a core lesson from our earlier OZ research that place matters and policy matters. Outcomes varied across tract types, states, and local conditions. Existing land use patterns, macroeconomic conditions, and other tract characteristics influenced where building activity increased and where it did not. Designation alone did not overcome the underlying differences among communities or produce uniform results across OZs.
The findings suggest that OZs can serve as accelerants in places where some foundations for investment are already present. This does not mean that those communities were already prosperous, that development was inevitable, or that they did not need public intervention. Rather, the OZ incentive existed within and was shaped by local physical, economic, and policy conditions. After designation, OZs’ share of all new U.S. building construction increased from 5.8% to 6.6%, and nearly half of the zones experienced at least a 15% rise in building activity. However, these gains were uneven, and OZs remained below parity of non-OZ census tracts by share of construction activity. These findings suggest that the incentive may help accelerate development under certain conditions, but did not serve as a universal economic growth engine.
This analysis also found no consistent association between increased building activity and displacement in most tract types and states. At the same time, only 26% of OZs experienced growth without displacement, and displacement was not limited to OZs with high levels of building activity. These patterns suggest that construction alone does not explain displacement, and underscore the influence of broader economic and demographic conditions as well as state and local policy frameworks affecting designated communities. For OZ 2.0, states should recognize that fast-tracking investments without parallel affordability and anti-displacement policies may leave residents and businesses vulnerable to neighborhood change pressures.
States should also recognize that accelerating housing construction in neighborhoods experiencing falling poverty can actually reduce displacement. As an area becomes more desirable, there is ultimately no way to prevent new residents from wanting to move in. Policies can increase homeownership, strengthen residents’ ability to remain in place, and reduce involuntary displacement, but existing residents can still be outbid when demand rises. New housing provides a way to absorb some of that additional demand without requiring as much turnover of the existing housing stock. Housing production can itself be an important anti-displacement tool, which is often missing from discussions of place-based anti-poverty policy.
Capital inflow and construction activity are not the same as community benefit. New development may represent meaningful economic activity, but it does not automatically produce affordability, local ownership, stronger businesses, or wealth creation for existing residents. Those outcomes depend on policies, partnerships, and implementation strategies that work in parallel with the tax incentive. OZ capital can be a catalyst, but it is not a substitute for a comprehensive place strategy.
OZ 2.0 offers states an opportunity to apply these lessons more deliberately. Because Opportunity Zones are now a permanent part of the federal tax code, designation should be treated as just one part of a sustained place-based economic strategy—not as the strategy itself. States, in close coordination with local government and communities, should define what success means; align tract selection with those objectives; coordinate complementary policies, investments, and incentives; strengthen local implementation capacity; and engage residents, businesses, local governments, community-based organizations, and investors throughout the process. These actions can help states connect OZ capital to responsible development, community wealth creation, and more broadly shared economic opportunity.
Further research is needed to determine what share of observed building activity directly used OZ financing and distinguish among different types and scales of development. Future work should also examine the relationships among building activity and other outcomes, including entrepreneurship, small business lending, and employment, as well as how pandemic-era economic conditions affected development across different tract types. Most importantly, continued research should assess not only whether investment occurred, but whether existing residents and local businesses participated in and benefited from the value it created.
OZ 1.0 demonstrates both the potential and limitations of place-based tax incentives. Our findings suggest that capital can support or accelerate development under certain conditions, but it cannot substitute for strategy, capacity, or sustained public leadership. The hard work of OZ 2.0 now begins. States, local governments, philanthropy, community organizations, businesses, and investors must work together to ensure that the program produces lasting, shared prosperity—and gives every community and every American a fair chance to thrive.
Authors




Downloads
-
Acknowledgements and disclosures
The authors thank the Robert Wood Johnson Foundation for their generous support of this work.
The views expressed in this report are those of its authors and do not represent the views of the Robert Wood Johnson Foundation, their officers, or employees.
We thank Mary Elizabeth Campbell for her research assistance on this report, Julianne Rhinebeck for project management support, Dr. Stefanie Brodie for advice and insight, and David Wessel for reviewing an earlier draft of this work.
The Brookings Institution is committed to quality, independence, and impact.
We are supported by a diverse array of funders. In line with our values and policies, each Brookings publication represents the sole views of its author(s).