
Introduction
Affordability has recently emerged as one of the central economic and political issues in the United States. Polling data suggests that many Americans feel that core components of a middle-class lifestyle have become increasingly out of reach. A college education is one of those components. Indeed, between 1990 and 2024 the prices of many items have increased faster than median earnings, including housing costs, health care, and gasoline. But the item whose price has risen the most is college tuition. Presumably, that contributes to Americans’ views that education is the least affordable.
But college price statistics and the public’s perception of college prices, are often based on the sticker price, without accounting for financial aid. The sticker price represents the maximum a student can pay. The net price is what matters; that is the sticker price minus scholarships and grants that students do not have to repay. Few students actually pay the full sticker price.
Trends in average net prices over time tell a different story. The average cost of going to college was rising at least since the mid-1990s and up until the mid-2010s, but net prices have stabilized since then and have even fallen recently.1 The drop in average net prices over the last decade stands in stark contrast to the public’s perception.
But the decline in average net prices might mask different trends depending on income. Whose prices fell? Net prices depend on a family’s financial situation, so it is useful to show how trends in net prices have varied by family income.
This report provides an update to previous studies I have conducted that document trends in net prices at four-year colleges and universities for families with different incomes. I collected pricing data from publicly available net price calculators that all colleges and universities are mandated to operate by federal legislation. I also use proprietary data from MyinTuition, a nonprofit organization of which I am the founder and CEO. This year’s update continues to show that net prices are either stable or declining for all income levels other than the top income category. Even for that group, adjusting for inflation, net prices today are less than they were in the late 2010s.
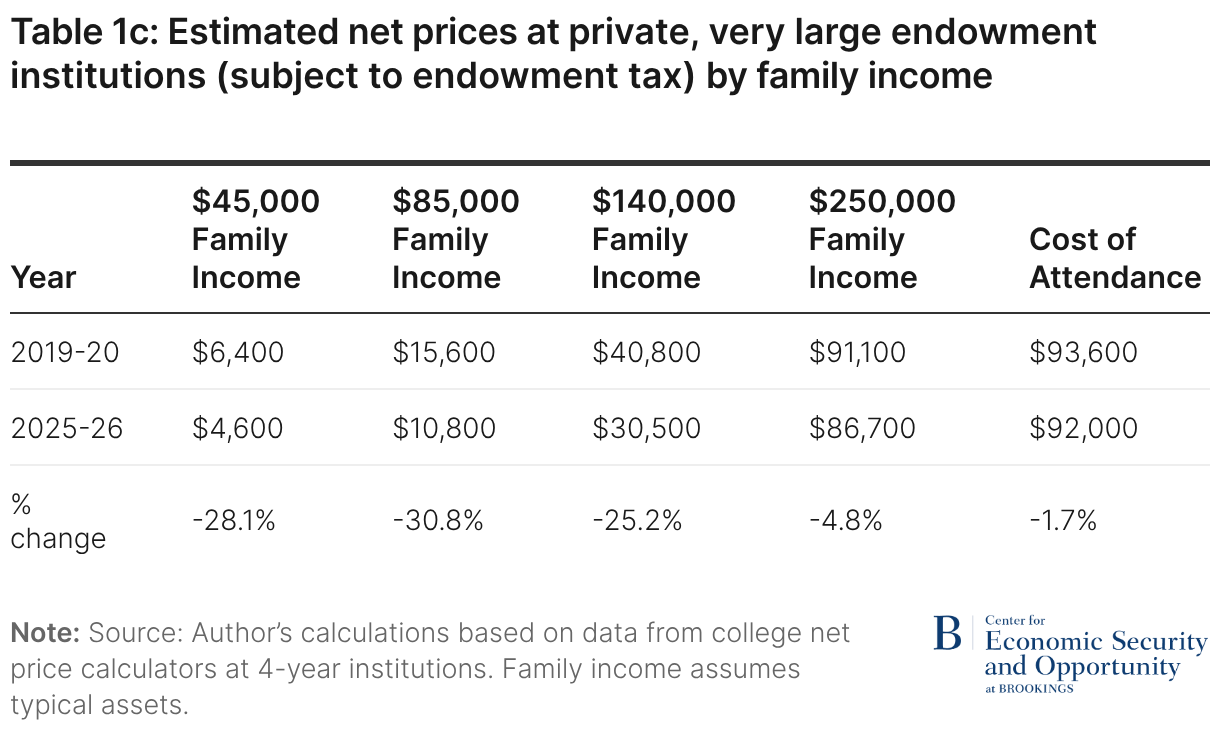
Despite having the highest sticker prices, private institutions with very large endowments are the least expensive option for low-income students who are admitted and enroll. Net prices charged to those students at these institutions are in the vicinity of $5,000 per year. That amount typically is based on anticipated student earnings during the summer and school year through work-study funding with no expectation of payments from parents. The wealth available at these institutions enables them to use their resources to maintain these lower prices for lower-income students. The relatively small number of lower-income students who enroll in these highly selective wealthy institutions, though, is often a cause for concern.
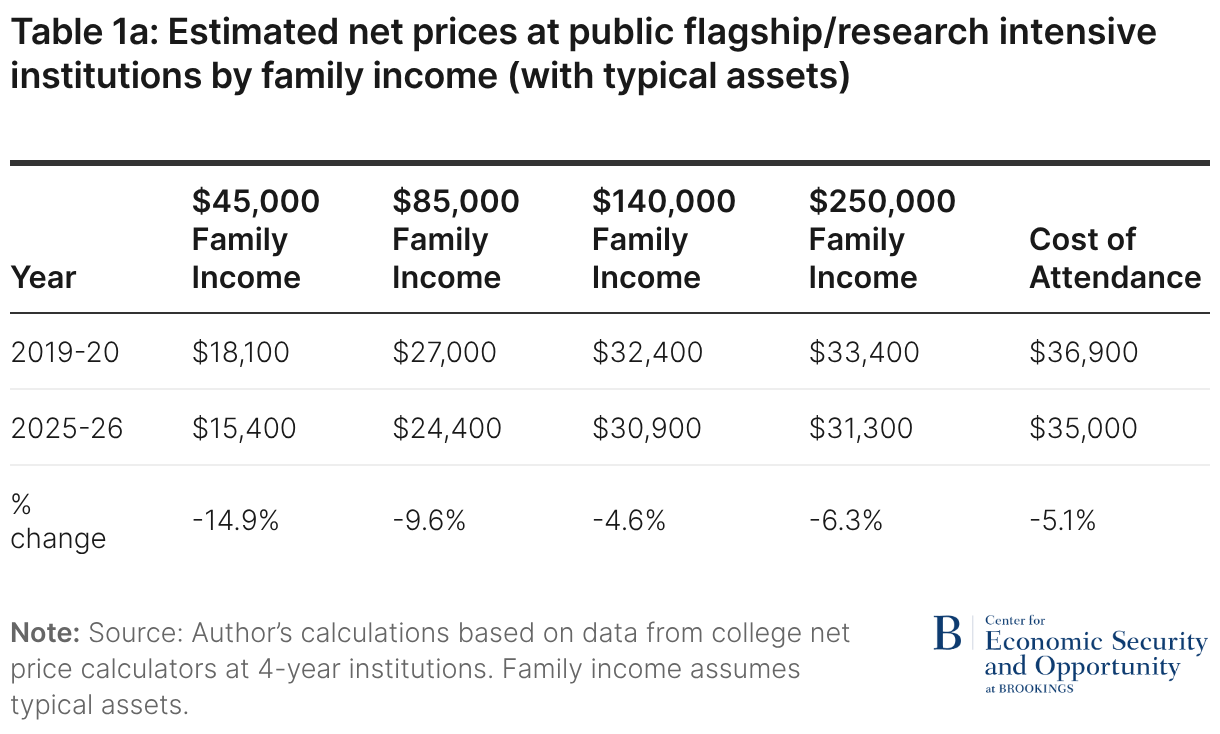
Public institutions are the next lowest-priced option for students in the lowest income category. Net prices for public institutions have also declined, but they still charge an average of roughly $15,000 per year to families with incomes around $45,000; those families typically have limited, if any, assets. To be sure, this statistic misses variation in pricing across states and institutions, but the high average value raises important questions about affordability for this group. Still, there is little evidence that these institutions are becoming less affordable for such families even if affordability concerns remain relevant.
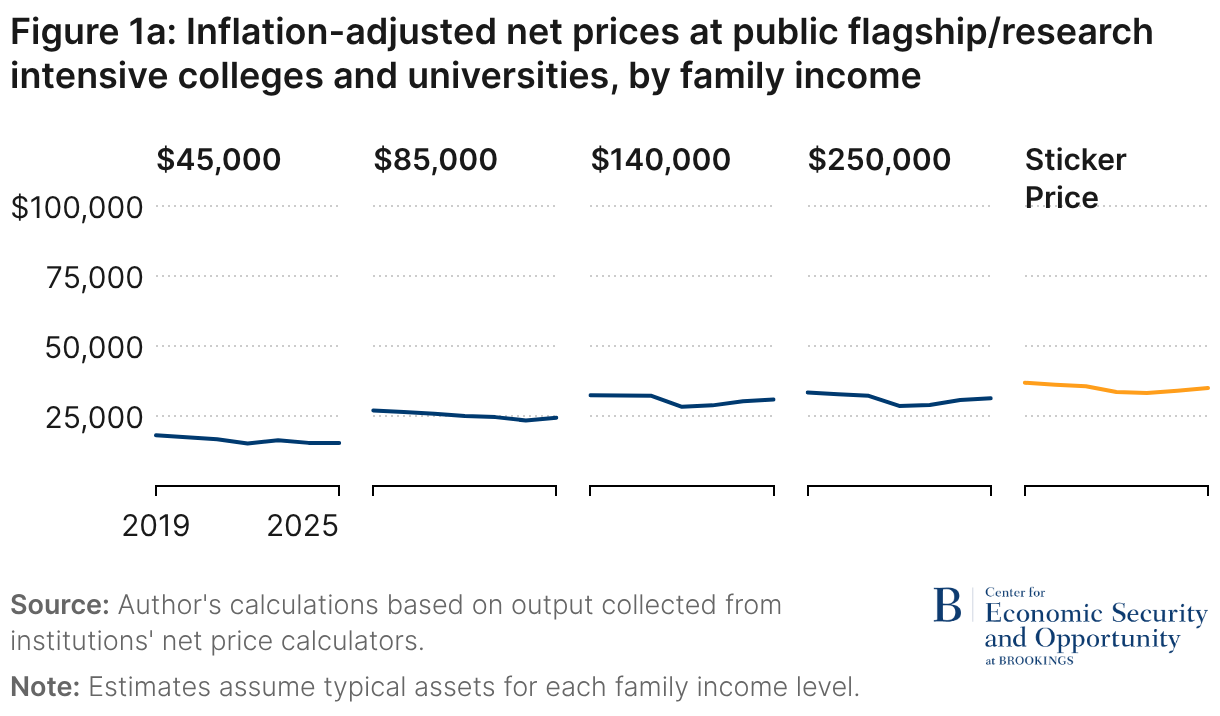
Students at higher income levels also face lower college costs than they did six years ago, though those costs have largely stabilized in recent years. A modest exception exists for students at the 75th ($140,000) and 90th ($250,000) percentiles of the income distribution attending public flagship or R1 institutions. While these students still pay less on average than they did six years ago, they have seen small increases over the past couple of years. Because students in these income ranges are unlikely to qualify for need-based aid, this pattern suggests a slight reduction in discounts provided through merit awards. Outside of this category, pricing for higher-income students is best characterized as broadly stable following earlier declines. The same is true for students at the median income level across all institution types. As with lower-income students, the level of net prices raises legitimate questions about affordability, but there is little evidence that college has become less affordable in recent years.
Even sticker prices—which receive so much attention—are lower now than they were in 2019-2020 after adjusting for inflation. Average sticker prices dropped noticeably in inflation-adjusted terms in 2022-2023 because prices did not keep up with the high inflation at the time. Since then, sticker prices have again increased faster than inflation but have not yet reached their 2019-20 levels. Rising sticker prices are noticed because that is the price that is most easily identified. But it is important to recognize that few students pay that price, and those who do typically have at least reasonably high incomes.
Data from net price calculators shows stable or falling prices
Colleges and universities that participate in federal student aid programs have been required to publish a net price calculator (NPC) since 2011. These calculators provide institution-specific estimates of what students are likely to pay, based on family income, assets, and other information. Past research has documented problems with these tools including difficulty accessing them and inaccuracies in some estimates. Despite these limitations, data collected from net price calculators provides a window into variation in net prices across students with different financial circumstances.
Since 2019, research teams I organized have collected net prices using these calculators for a consistent sample of four-year colleges and universities. Institutions are grouped into private nonprofit and public sectors. Private institutions are further separated into those with larger and smaller endowments per student, while public institutions are divided between state flagship or research-intensive (“R1”) campuses and more regionally focused institutions.
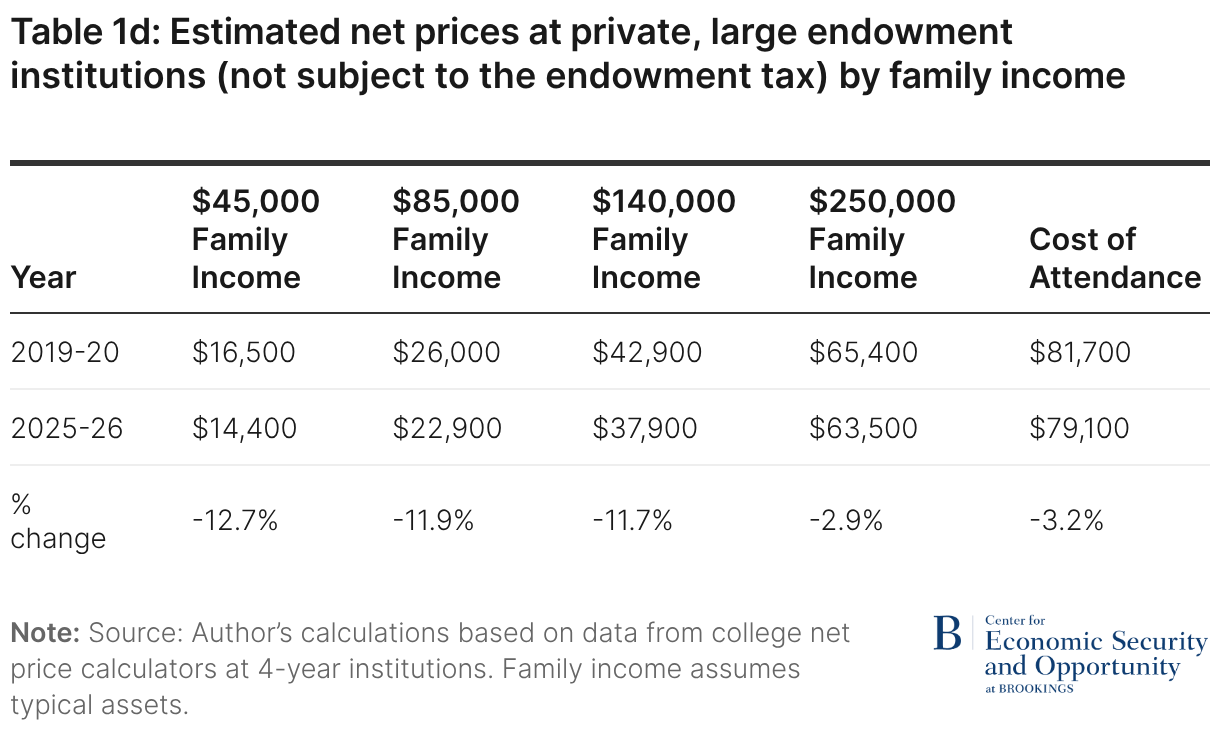
From each category, 50 institutions were randomly selected, yielding a total sample of 200 colleges and universities. The 50 private, well-endowed institutions have been further subdivided to distinguish between those with endowments exceeding $500,000 per full-time equivalent (FTE) student from those with endowments between $100,000 and $500,000 per FTE. Among the selected institutions, 15 are in the former group and 35 are in the latter. Universities in this category with more than 3,000 tuition-paying students are subject to the significantly increased endowment tax introduced as part of the One Big Beautiful Bill Act, enacted last summer.
At each institution, NPC estimates were generated for students from four hypothetical families with different financial circumstances. Income and asset levels correspond to the 25th, 50th, 75th, and 90th percentiles of the distribution for families with children approaching college age observed in the 2019 Survey of Consumer Finances, updated for inflation over time. These income levels correspond to approximately $45,000, $85,000, $140,000, and $250,000 in today’s dollars. In addition to reporting net prices for each scenario, the analysis also presents the full published cost of attendance (the “sticker price”), which continues to receive outsized attention even though few students pay that amount.
Tables 1A–E and Figures 1A–1E present the results for each category of institution. Net prices for all income groups are lower in 2025–26 than they were six years earlier, and the full cost of attendance has declined as well. That is, sticker prices have not kept pace with inflation. While there are some minor year-to-year differences across income groups, the overall patterns are clear. For students at the 25th percentile of the income distribution (incomes below about $45,000) prices have fallen almost continuously and are now roughly 15–30% lower than in 2019–20.


More detailed data show falling net prices at highly selective private colleges
The universal availability of NPCs is an advantage of that approach, but the usefulness of the data collected from NPCs is somewhat diminished by concerns about the accuracy of NPC estimates. In our analysis, we noted examples of calculators that were not functional, reported prices for outdated academic years, or reported results that were not internally consistent—such as estimates implying higher net prices for lower-income students than for their higher-income peers. While these issues may average out when considering a large number of institutions within each category, they nonetheless raise concerns about relying exclusively on NPCs for this analysis.
To more accurately assess pricing trends, I supplement that analysis with an alternative source of administrative data. Specifically, I draw on proprietary records from MyinTuition Corp. For a subset of institutions, these data include anonymized information on family financial circumstances and net prices paid by all students receiving need-based financial aid. For 14 institutions, the data extend back to the 2015–16 academic year.2 Most of these institutions have endowments that place them in the very high endowment category. All are highly selective in admissions; I label them collectively as such. Each has granted permission for these data to be used in this analysis. Using these records, I construct net price estimates for students at the same inflation-adjusted income levels as above.
Table 2 and Figure 2 present the results of this exercise. Consistent with the NPC-based findings, the administrative data show substantial declines in college prices for most students over the past decade.3 Table 2 presents net price estimates in 2015-16 and 2025-26. For students with family incomes at the 25th, 50th, and the 75th percentile (approximately $45,000, $85,000, and $140,000), inflation-adjusted net prices have fallen by 35%, 43%, and 23%, respectively, over the past decade at these institutions. Even for students at the 90th percentile of the income distribution (around $250,000), average net prices have remained essentially flat over this period.


A different pattern emerges at the very top of the income distribution. At these institutions, students from the highest-income families typically receive little or no institutional aid and pay the full published price, or close to it. These students’ families commonly have incomes above $300,000.
These data show that the cost of attendance for these families has increased by 8.5% in real terms over the past decade. That value diverges somewhat from the NPC analysis because the time span is longer. Focusing just on the period since 2019-20, sticker prices also fell and bounced back, resulting in little change over the shorter time span, more in line with the findings from the NPC analysis.
Affordability is difficult to define, but it is not declining
Affordability is an inherently nebulous concept. Translating a family’s financial resources into an amount they can reasonably afford to pay for college requires assumptions that may or may not be well justified. The process includes the assumption that college costs should not only be covered by current income, but by broader measures of financial well-being, including saving and borrowing based on lifetime income. In the end, what is an affordable price is unclear. Sometimes, the affordability issues are sufficiently obvious that they are easily identified. Families earning $45,000 per year with limited assets will struggle to come up with $15,000 to pay for a single year of college. But it is much more difficult to assess how much a family earning, say, $150,000 per year with substantial assets can afford to pay.
The financial aid system, though, uses methodologies designed to answer that question. That is the purpose of completing the FAFSA and, at some institutions, the CSS Profile. Replies on those forms are used to create the Student Aid Index (SAI) and expected family contribution (EFC), respectively. Those values are intended to capture how much a family can afford to pay for college. While those formulas appropriately assign higher affordable payments to families with greater financial resources, a precise relationship between those calculations and true affordability is difficult to pin down. The fact that few colleges and universities have “meet full need” financial aid policies, in which families’ out-of-pocket expenses match the SAI/EFC, suggests that the affordability standard embedded in these methodologies frequently isn’t met.4
What is easier to assess is whether college affordability is changing over time. If net prices—after accounting for financial aid—were rising, college would have become less affordable. For most students, however, that is not what the data show. Over the past decade, net prices have declined. Other research documents this pattern on average, and the analysis presented here shows that it holds for nearly all students (with the possible exception of higher-income students attending primarily private, highly endowed institutions who pay close to the full sticker price). While there may still be room to improve affordability, if anything the evidence suggests that college has, for the most part, become more affordable in the last decade. These findings should not be read as minimizing the financial strain many families experience but rather as evidence that those strains are not being driven by rising college net prices.
These misperceptions regarding college pricing raise the relevant issue of price transparency. The easiest number to find regarding the cost of attending a college is the sticker price. The federal government requires the full cost of attendance to be posted even though most people won’t pay that amount. Determining how much an individual student will pay based on their own finances and academic record is a more complicated process. Finding ways to easily communicate actual college costs is necessary to overcome these misperceptions.
Author

Related Content


-
Footnotes
- Data prior to 2006-07 focus on pricing at four-year colleges. The patterns described after that point are relevant at two-year colleges as well.
- These institutions include Amherst College, Bowdoin College, Carleton College, Colorado College, Columbia University, Dartmouth College, Mount Holyoke College, Pomona College, Rice University, Vassar College, Washington and Lee University, Wellesley College, Wesleyan College, and Williams College.
- Note that the 2025-26 estimates provided in Table 2 are very similar to those reported in Table 1 for colleges with very large endowments. This suggests that the limitations in institutional net price calculators are not apparent in this sector of the market.
- Note that all the highly selective institutions that are examined separately in this analysis do meet full need.
The Brookings Institution is committed to quality, independence, and impact.
We are supported by a diverse array of funders. In line with our values and policies, each Brookings publication represents the sole views of its author(s).