The Great Recession ended in the summer of 2009. The economy has expanded in all but one calendar quarter since the recovery began. Unfortunately, progress in pushing down the unemployment rate and improving worker compensation has been modest. The July 2013 unemployment rate was 7.4%. While this is much lower than the peak unemployment rate we experienced in fall 2009 (10.0%), it is 2.8 percentage points higher than the average rate in 2007. The nation’s job market remains a long way from full employment.
How big is the current gap? In the two years after December 2007 the number of payroll jobs shrank by a total of 8.7 million. In the same two years the number of adults who reported holding a job fell 8.2 million. Since the job market recovery began in early 2009 we have recovered a bit more than three-quarters of the job loss suffered in the Great Recession. The number of payroll jobs has increased 6.7 million, and the number of adults who say they are employed has risen 6.3 million. As of July 2013 we still needed to see an increase of 2 million jobs to bring us back to payroll levels we saw at the end of the last expansion.
America’s working age population has increased since the last expansion ended, however. This implies we need more than just 2 million extra jobs to bring the unemployment rate back to its level in 2007. One way to calculate the exact number of jobs needed is to determine how much the working age population has increased.
The Bureau of Labor Statistics defines the working age population to include noninstitutionalized adults who are at least 16 years old. If the age distribution of the population remained stable, the increase in this population would be a good starting point for estimating the required increase in employment. However, the age structure of the population has shifted in recent years. A rising fraction of the population is past age 55, when employment rates and labor force participation rates tend to decline. A shrinking percentage is between 25 and 54, ages when employment and participation rates reach their lifetime peak (see Chart 1).
One way to calculate the employment level required to bring us back to the labor market conditions we enjoyed at full employment is to estimate how many people would need jobs in each age group to duplicate the 2007 employment rates in these age groups. The employment rate of 35-44 year-olds in 2007 was slightly less than 81%, for example (see Chart 2). By the second quarter of 2013 the employment rate among 35-44 year-olds dropped by about 3.4 percentage points. In order to restore employment among 35-44 year-olds to the employment rate we saw in 2007 we need to boost the employment rate in this age group by 3.4 percentage points (see Chart 3). On the other hand, shifts in the age distribution of the American population mean that the number of 35-44 year-olds has declined by 2.8 million by since 2007.
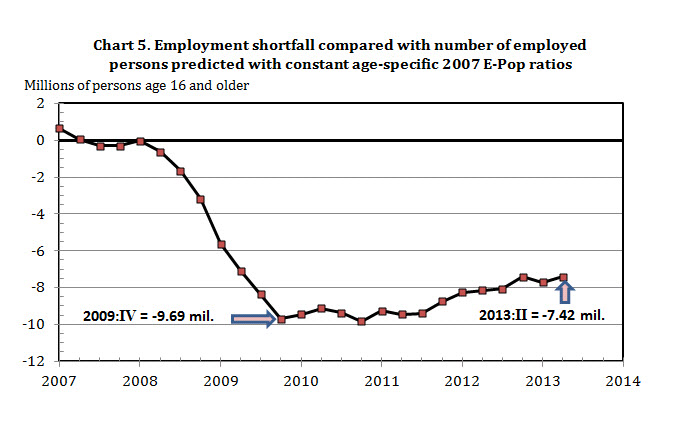
The age groups that have become more important since 2007 tend to have lower employment rates than the age groups that have shrunk in relative size. This means that, even if we duplicated the 2007 employment rates within every age group in the population, we would expect to see a decline in the overall percentage of the adult population that is employed. In 2007 the percentage of the adult population that held a job was 63%. Shifts in the age distribution which gave us an older population have reduced the expected employment rate by about 1.3 or 1.4 percentage points (see Chart 4). Thus, even if the United States had maintained an unchanging employment rate within every age group, we should expect that the adult employment rate would have dropped to about 61.6% by the second quarter of 2013. The actual employment rate in the spring quarter was only 58.6%, or 3.0 percentage points below the employment rate we would have expected if 2007 labor market conditions persisted through 2013. The 3-percentage-point deficit translates into a shortfall of about 7.4 million employed people (see Chart 5). Our employment deficit in the spring quarter was thus about 7.4 million.
Although output began to rebound in the second half of 2009 and the number of payroll jobs began to grow a few months later, the U.S. did not begin making substantial progress in reducing its jobs deficit until the beginning of 2011. Since that time, progress has been painfully slow. Employment reported in the BLS household survey has grown an average of 160,000 per month. Adult employment must grow about 80,000 a month in order keep the jobs deficit from increasing. Thus, since early 2011 we have been whittling back the jobs deficit by about 80,000 per month. Given the current size of the jobs shortfall and the recent pace of employment growth, the nation will need another 7½ to 8 years to restore full employment.
Many explanations have been offered to account for the sluggish recovery. The simplest, most persuasive is that overall demand for goods and services produced in the United States is too low to fully employ the Americans who would be happy to hold jobs at the prevailing wage. To reduce the employment deficit, the Congress and President must spur growth in overall demand. Unfortunately, for the past couple of years fiscal policy has pushed in exactly the opposite direction.


The Brookings Institution is committed to quality, independence, and impact.
We are supported by a diverse array of funders. In line with our values and policies, each Brookings publication represents the sole views of its author(s).


Commentary
Op-edHow Far Are We From Full Employment?
August 27, 2013