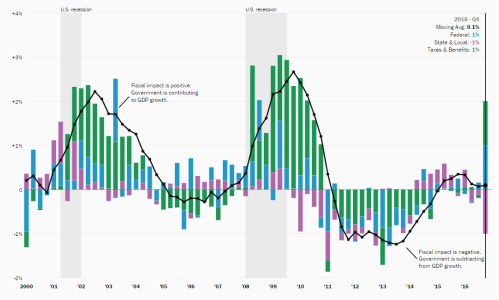
Fiscal policy plays an important role in cushioning the economy and boosting GDP during economic downturns. The Hutchins Center Fiscal Impact Measure (FIM) estimates the direct impact of local, state, and federal fiscal policy on the growth rate of GDP, rather than on its level.
In this post, we illustrate how much stimulus fiscal policy has provided to the economy since the onset of the COVID-19 pandemic in the first quarter of 2020. Although fiscal policy was a factor reducing GDP growth after mid-2021, as the negative reading of the FIM shows, it continued to provide stimulus to the level of activity through the third quarter of 2022.
The FIM shows the amount of stimulus fiscal policy is providing to the economy, which is an important factor for the Federal Reserve to consider in setting interest rates and for analysts to take into account in trying to understand the economy. The ultimate effect of fiscal policy on the economy depends on the extent to which higher demand shows through to higher GDP versus how much it leads to higher inflation or interest rates. This depends on the multiplier, which we discuss below.
When taking the multiplier into account, our assessment suggests that fiscal policy boosted the level of real GDP from the start of the pandemic through at least the first quarter or two of 2021. However, beyond that period, much of the stimulative effect may have been offset by higher inflation and interest rates.
How much economic stimulus was provided by pandemic-era fiscal policy?
The chart below shows the trajectory of actual real GDP and a counterfactual real GDP. The counterfactual (the blue line) is our estimate of what real GDP would have been had government purchases, taxes, and transfers increased at the rate of potential GDP from the first quarter of 2020 onward (based on fiscal policy in 2019 Q4) and had the multiplier—discussed below—been 1. As shown by the orange line, purchases and transfers during the pandemic far exceeded this counterfactual fiscal policy.
The distance between the two lines represents the direct effect of fiscal policy changes on economic activity. Automatic stabilizers and fiscal stimulus legislation played a large role in mitigating the negative economic impacts of the COVID-19 pandemic. In the second, third, and fourth quarters of 2020, the direct effects of fiscal policy increased the level of real GDP by about 4% on average. The significant gap between actual and counterfactual GDP persisted through 2021, reflecting the impact of further stimulus at the end of 2020 and the American Rescue Plan Act of 2021. Fiscal policy became roughly neutral by the third quarter of 2022. We expect the impact of fiscal policy on the level of GDP to remain roughly neutral through 2026 Q4, assuming the expiring provisions of the Tax Cuts and Jobs Act are extended but no other new legislation is passed.
As noted above, the FIM measures fiscal policy’s contribution to GDP growth rather than its level. Thus, when the effect of fiscal policy on the level of GDP gets smaller over time—as it does from the first quarter of 2021 onward—fiscal policy is lowering GDP growth, and the FIM is negative. The difference in the slopes of the two lines in the chart above—the difference between the growth in actual and counterfactual GDP—is roughly equal to the FIM.
How do the different components of fiscal policy affect the level of GDP?
The chart below decomposes the boost to GDP from fiscal policy into its components– indicating the difference, in dollars, between actual and counterfactual real GDP resulting from transfers, taxes, and purchases by federal, state, and local governments.
The light blue line shows the combined effects of taxes and transfers on the level of GDP since 2020 Q1. The expansion of unemployment insurance and the first two rounds of rebate checks explain much of the considerable boost to GDP from transfers at the onset of the pandemic. The impact peaked in 2021, coinciding with the American Rescue Plan Act, which provided substantial assistance to businesses and households. As pandemic spending waned, higher net transfers only moderately increased real GDP.
The combined effects of federal, state, and local purchases boosted the level of real GDP in 2020 but turned negative in 2021 Q2, largely driven by weak state purchases (the dark blue line).
These estimates depend on how much households, businesses, and state and local governments received, and how quickly and how much they changed their spending in response (the marginal propensities to consume, or MPCs). We assume different spending responses for different types of policy. For example, we assume that subsidies from the Paycheck Protection Program (PPP) had a much smaller and slower effect on private spending per dollar of government expenditure than did unemployment insurance benefits because jobless workers tend to spend the benefits quickly.
Given the increase in the deficit since FY 2019, why isn’t the FIM still boosting the level of GDP relative to the pre-pandemic counterfactual?
The federal deficit was 4.6% of GDP in fiscal year (FY) 2019 and 6.4% of GDP in FY 2024. But because the FIM weighs different parts of fiscal policy differently, depending on the assumed MPCs, and because the FIM also includes state and local fiscal policy, there isn’t a one-to-one correlation between the change in the deficit and the FIM. Most importantly, the FIM puts no weight on interest payments by the government, the source of much of the rise in the deficit, because these payments are unlikely to increase the consumption of those receiving them. The primary federal deficit—the deficit excluding net interest—was only modestly higher in FY 2024 than in FY 2019 –3.1% of GDP in FY 2024 vs 2.8% of GDP in FY 2019, consistent with a FIM that is roughly neutral given all the other differences between the FIM and the federal deficit.
How would the counterfactual GDP be affected by including multipliers?
The FIM measures the direct effect of fiscal policy on economic activity. For example, it measures how much households increase their consumption in response to higher transfer payments or lower taxes. Fiscal policy also has indirect effects, measured by the multiplier. The FIM doesn’t include these effects—or, equivalently, assumes the multiplier is 1.
When the economy is operating below its potential output, the indirect effects of fiscal policy reinforce the direct effects: When demand increases, businesses hire more workers who then have additional money to spend, and the effect on total output is “multiplied” beyond the actual dollars spent by the government. In this case, the multiplier would be greater than 1.
In contrast, when the economy is already at or above its potential output, the indirect effects of fiscal policy likely partially or fully offset the direct effects. For example, an increase in demand when the economy is at full employment is likely to lead either to higher inflation or higher interest rates, both of which reduce real GDP and offset the effects of fiscal policy to some degree. In this case, the multiplier is likely less than 1 or even 0.
Estimating the size of the multipliers during the pandemic is difficult. Analysts still debate the extent to which the inflation was the result of fiscal stimulus versus the result of supply chain disruptions caused by the pandemic. Multipliers might also have been smaller than usual while the economy was operating below potential if spending responses were restricted by lockdowns and the desire to socially distance.
The figure below shows CBO’s January 2025 estimate of the ratio of actual to potential GDP: When the ratio is below 1, the economy is below potential, and vice versa. CBO estimates that the economy was below potential for all of 2020 and during the first quarter of 2021, suggesting that multipliers might have made fiscal policy even more stimulative than shown by the FIM. However, from then on, CBO estimates that the economy was operating above or at potential. As a result, fiscal policy might have had a smaller effect on real GDP than indicated by the FIM, instead leading to inflation or prompting the Fed to raise interest rates.
When the economy is at full employment, the FIM can be viewed as a measure of the stimulus from fiscal policy that the Fed needs to consider in making its interest rates decisions. For example, federal deficits are projected to rise over the next few decades, but this increase is unlikely to boost real GDP. Instead, it will raise the neutral rate of interest, meaning that the Fed will have to raise rates if the economy is to remain at full employment without generating inflation.
Authors


Related Content

The Brookings Institution is committed to quality, independence, and impact.
We are supported by a diverse array of funders. In line with our values and policies, each Brookings publication represents the sole views of its author(s).

Commentary
How does fiscal policy affect the level of GDP?
February 19, 2025