Europe is serious about regional development. Each year, the European Union (EU) spends $78 billion on regional development projects. This amount has risen steadily since regional development policies and special funds were first introduced in 1975. Europe’s countries and regions have seven-year plans (called Operational Programs), each requiring regional planning documents of several hundred pages.
But while inequality between EU countries has declined, inequalities within countries have increased over the last two decades (Figure 1). Regions within each country have grown apart from one another, even as national GDP per capita levels have converged. Capital cities have generally prospered, while poorer regions have not caught up.
Figure 1. Inequality between countries has declined, but inequality within European countries has consistently increased
 Source: Authors’ calculations
However, there are exceptions. Regions like Miasto Wrocław in Poland, Trnava in Slovakia, Brasov in Romania, and Kaunas in Lithuania all grew at a rapid pace and converged toward the average EU income level. What growth pathways have they taken? What can other places learn from these successes?
Our analysis uses a large dataset on 1,321 regions in the EU, for the years 2003 to 2017. We focus specifically on NUTS-3 regions, i.e., units of approximately 100,000 to 800,000 population. These small regions are similar in size to districts in India, prefectures in China, or counties in the United States. We are interested in this level of region because Europe is putting a growing faith in local development initiatives such as Integrated Territorial Investments (ITIs).
Three main results stand out:
First, lagging regions are a widespread problem and you find them in most European countries (Figure 2).
Figure 2. Almost all EU member states show high within-country variability in growth rates
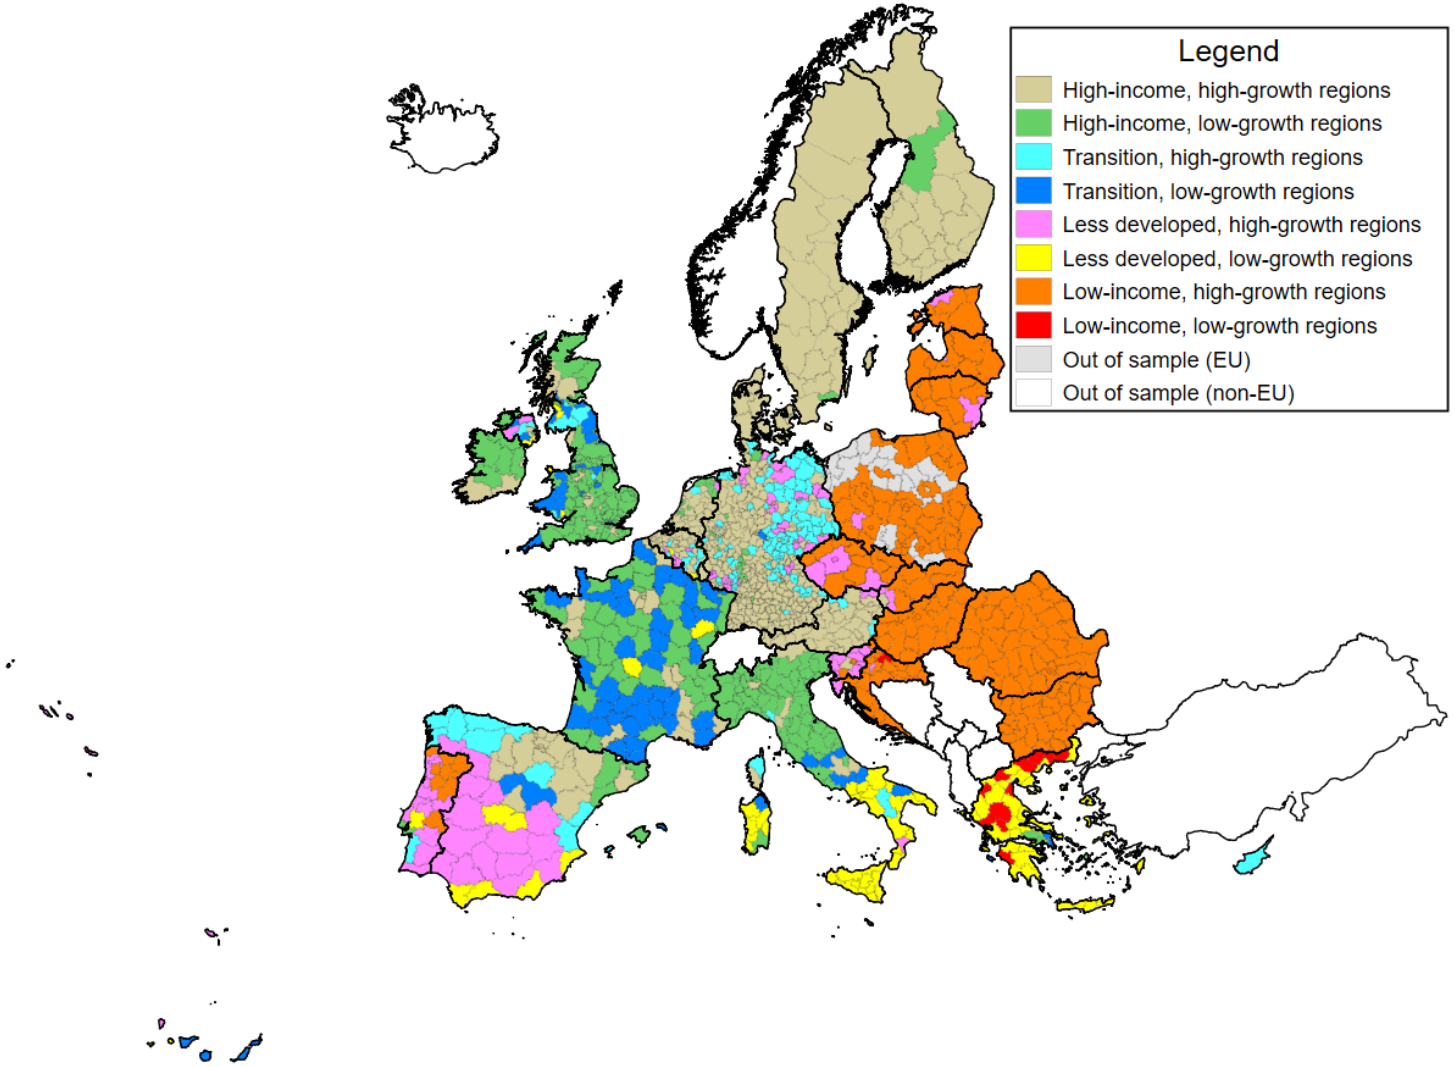
Source: Authors’ calculations
More than two-thirds of EU countries have lagging regions.
- “Low-income” lagging regions are poor, but usually growing. They are found mainly in the east of Europe, in countries like Bulgaria, Romania, Hungary, Poland, and the Baltic states that joined the EU in the most recent two decades.
- “Low-growth” lagging regions are middle income, but stagnant. They are found mainly in southern Europe: Portugal, Italy, Greece, Spain, Croatia. But they are also found in some parts of northern Europe. Indeed, 16 percent of British regions and 40 percent of French regions are middle income but low-growth.
Second, lagging regions are often hidden in official statistics, since they are often part of larger and more prosperous regions. European statistics conventionally focus on larger regions (of 800,000 to 3 million people each). Those larger regions often contain substantial pockets of low incomes and high unemployment.
For instance, the Italian region of Emilia-Romagna hosts the headquarters of Ferrari, Lamborghini, Maserati, and the Barilla food empire, and its agri-food sector includes Parmigiano Reggiano cheese, balsamic vinegar, and prosciutto from Parma. It has a well-developed innovation ecosystem and a huge university sector. But alongside its leading cities of Bologna and Modena, it also has lagging cities such as Ferrara and Rimini, where unemployment is high and growth is low.
In Bulgaria, the region of Yugozapaden includes the capital city Sofia, which achieved 9.5 percent annual growth in GDP per capita from 2003 to 2017, but also includes areas where growth was less than half as fast, meaning they are falling behind the national convergence to European levels. The German region of Oberfranken includes the areas of Coburg (6.7 percent annual growth in 2003-2017) and Hof (only 1.8 percent annual growth).
Third, lagging regions need specific solutions: There is no blueprint for success across Europe. Unlocking each region’s growth potential depends on what type of regional economy you are starting from.
- In low-income regions, with income below 50 percent of the EU average, foreign direct investments (FDI) played a key role in growth. The relationship between FDI and growth was very robust (statistically significant at 0.1 percent). A 1 percent increase in the number of foreign investments is associated with a 1.1 percent increase in GDP per capita growth. Such regions were successful especially with FDI in production activities, logistics, distribution, and transportation. There was no pattern in industry contribution though—in some places, growth was correlated with agribusiness, in other places, it was manufacturing, and services in others.
- In low-growth regions, with income that is below 75 percent of the EU average and growth below 50 percent, FDI was not consistently associated with growth. Growth was correlated with the construction sector and innovation activities. For example, a 1 percent increase in the number of patents is associated with an increase in GDP per capita growth of 0.4 percent.
- In high-income regions, with income above 90 percent of the EU average, growth was correlated with industry and construction sectors, plus tradable services (information and communication, financial and insurance, real estate, professional, scientific and technical activities, administrative and support services, transport, accommodation, food service, wholesale and retail).
Our full analysis is available in a working paper. In a future blog we will focus on how policymakers at national and local levels can leverage these findings for strategies and investments.
Related Content


Authors


The Brookings Institution is committed to quality, independence, and impact.
We are supported by a diverse array of funders. In line with our values and policies, each Brookings publication represents the sole views of its author(s).


Commentary
How do small regions in Europe achieve growth?
January 28, 2021