Executive summary
The axiom that “the user pays” is one of the central ideas to how the United States invests in its publicly owned roads. For decades, federal and state governments have charged road users—most notably through gasoline taxes—and then reinvested those revenues back into the transportation system. Policymakers then have the responsibility to match spending to physical need and relative contribution, particularly when state and local governments own different but interdependent portions of the national network. Such accountable spending is even more important for localities that don’t directly control the gas tax revenues.
Based on an assessment of national driving and spending patterns, it’s clear that local governments are not getting a fair deal. While locally owned roads host 34% of all vehicle miles traveled in the United States—generating a significant sum of tax revenue—states spend only 16% of their total disbursements on local roads, whether those are spent directly or by sub-awarding money to local governments. Meanwhile, congressionally approved formulas overly prioritize state discretion around which federal gas tax revenues will reach locally owned road networks.
It’s little surprise, then, that physical conditions on local roadways are significantly worse than state roadways. For example, 49% of locally owned principal arterial mileage—America’s major roadways—are in poor condition, compared to 7% of mileage on similar state-owned roads.
These funding disparities break the user-pay promise, but they can be addressed. Congress should adopt programming to directly allocate funds to localities and their regional partners. By our estimation, local governments can lay claim to $10 billion in annual federal funding simply as their portion of annual roadway distributions from the Highway Trust Fund. Such funding amounts could have profound effects on addressing America’s backlog of roadway maintenance and make every driving trip more reliable.
Context
The federal gas tax is one of the country’s most streamlined and focused revenue instruments. Established in 1932, Congress assigns the Internal Revenue Service to collect the tax at the wholesale level from gasoline and diesel sellers. This approach keeps administrative costs low for federal tax collectors, while retailers seamlessly pass the tax along to users for every gallon they consume. The U.S. Treasury Department then deposits the tax revenues into the Highway Trust Fund (HTF), where—alongside other deposits from truck use, registration, and tire purchases—the funds are exclusively used to invest in the nation’s transportation system.1 This closed loop ensures that all transportation-generated revenues are reinvested back into the same system enjoyed by all road users.
Yet the gas tax and related HTF revenue instruments are also imprecise. The funds deposited into the HTF can’t differentiate between where the gasoline and diesel were consumed; for example, whether it’s a local Main Street or an interstate highway.2 It’s the same for heavy-vehicle use. The Treasury simply deposits all revenues—$43.5 billion in FY 2024—into the HTF and then assigns over 85% of the revenues to the Highway Account to be reinvested into the nation’s roads.3 It’s then up to congressional lawmakers to determine how and where the HTF’s revenue will be spent.
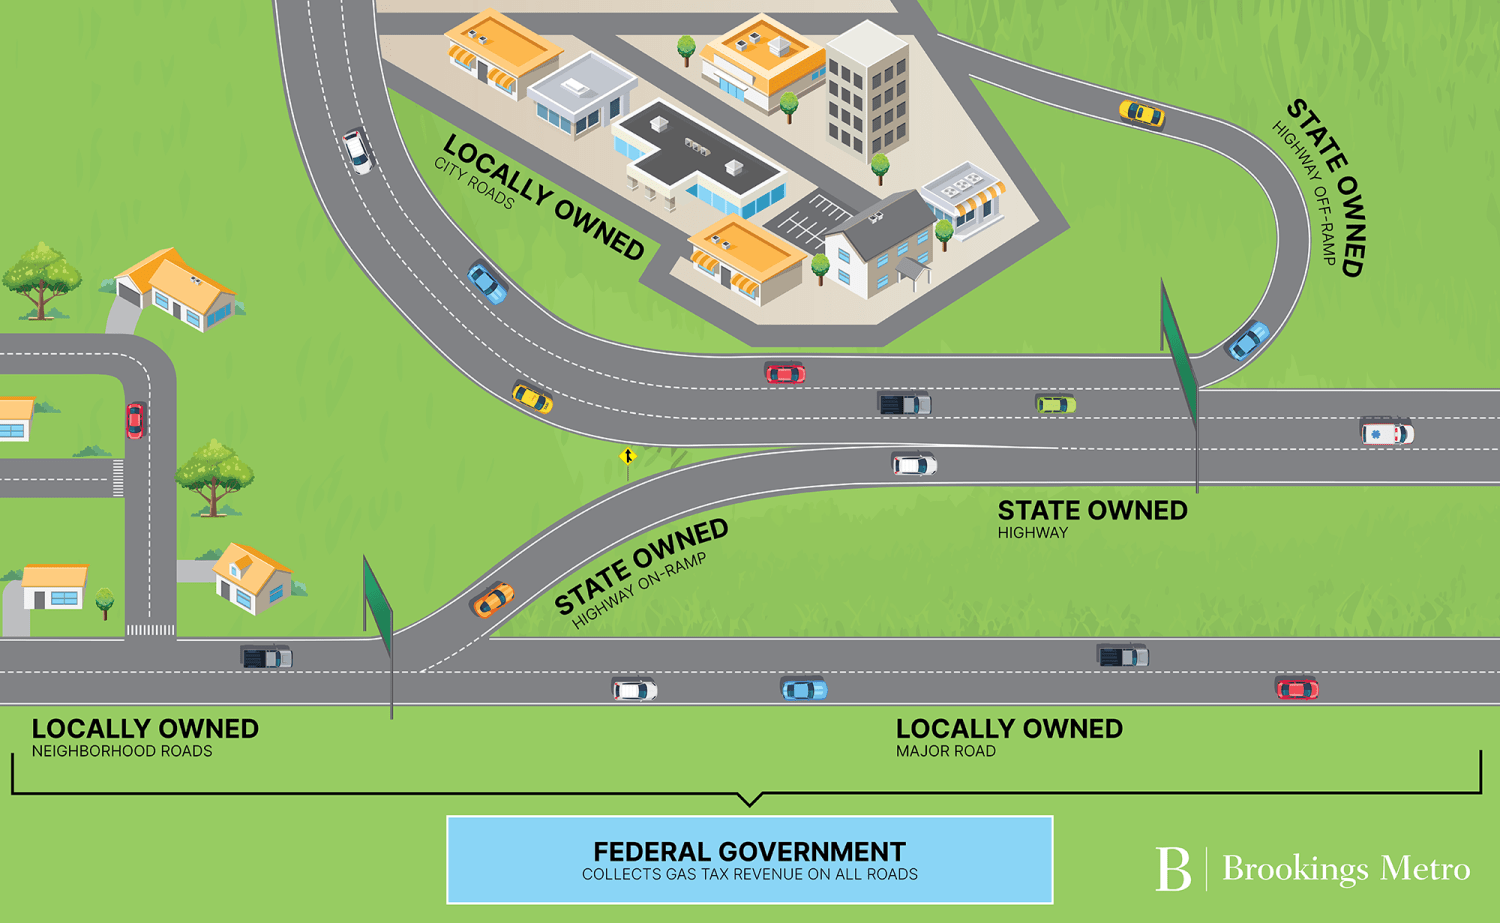
For decades, federal lawmakers have made states the dominant recipients of transportation spending. The vast majority of HTF dollars are sent back to the states using formula apportionment programs, which deliver funds to achieve specific purposes such as interstate maintenance and flexible capital needs. The exact formulas change over time and vary between each program, but their common feature is promoting equity among the states, with lawmakers going so far as to include that word in the title of two authorizing laws.
However, the formula system has a critical weakness: None of the current programs consider what kinds of roads generated revenue. Instead, the formula programs essentially give each state the authority to determine which capital projects should receive funding, with no requirements to further distribute funding down to the owners of local roads that also generate federal revenue. In other words, federal formulas require equity between states, but not within them.
Fortunately, federal reporting makes it possible to compare where driving occurs and what entities own the roads where the driving takes place. The next three sections present data on how much driving occurs on locally owned roads (measured in vehicle miles traveled, or VMT), how that driving compares to states’ spending patterns, and the physical condition of state versus local roadways. Those findings inform a set of policy implications for federal and state officials, each of whom can return a fairer share of tax revenue to the local owners of our national roadway network.
Methodology
This report relies on the Federal Highway Administration’s Highway Statistics Series, which has published annual data back to the 1940s. To expand on VMT reporting and road quality estimates by owner, we accessed specific data within the 2022 Highway Performance Monitoring System (HPMS), which is the underlying data that informs Highway Statistics Series reporting. See this report’s Appendix to read about our methodology in greater detail.
Locally owned roads host 34% of vehicle miles traveled, meaning their users contribute significant tax revenues to federal and state coffers
America’s local governments make the nation’s roadway transportation possible. Counties, cities, townships, and all the other local governments collectively own 3.2 million miles of roads, or 76% of all national mileage. Localities also own almost half (44%) of the country’s federal-aid highway system, which comprises the roadways prequalified to receive federal assistance. Perhaps most importantly, almost every single vehicle trip relies on locally owned roads at some point, from using the tree-lined streets outside our homes to accessing the commercial corridors where people work, shop, and socialize.4
All those trips and distances add up to major use. Looking across all 50 states, locally owned roads carried 34% of national VMT in 2022.5 The shares can get much larger, such as in Arizona (49%) and Michigan (48%), where local governments own major arterials within their urban areas. Some states see lower VMT shares on local roads simply because the state owns most roads, such as in Delaware, North Carolina, Virginia, and West Virginia.
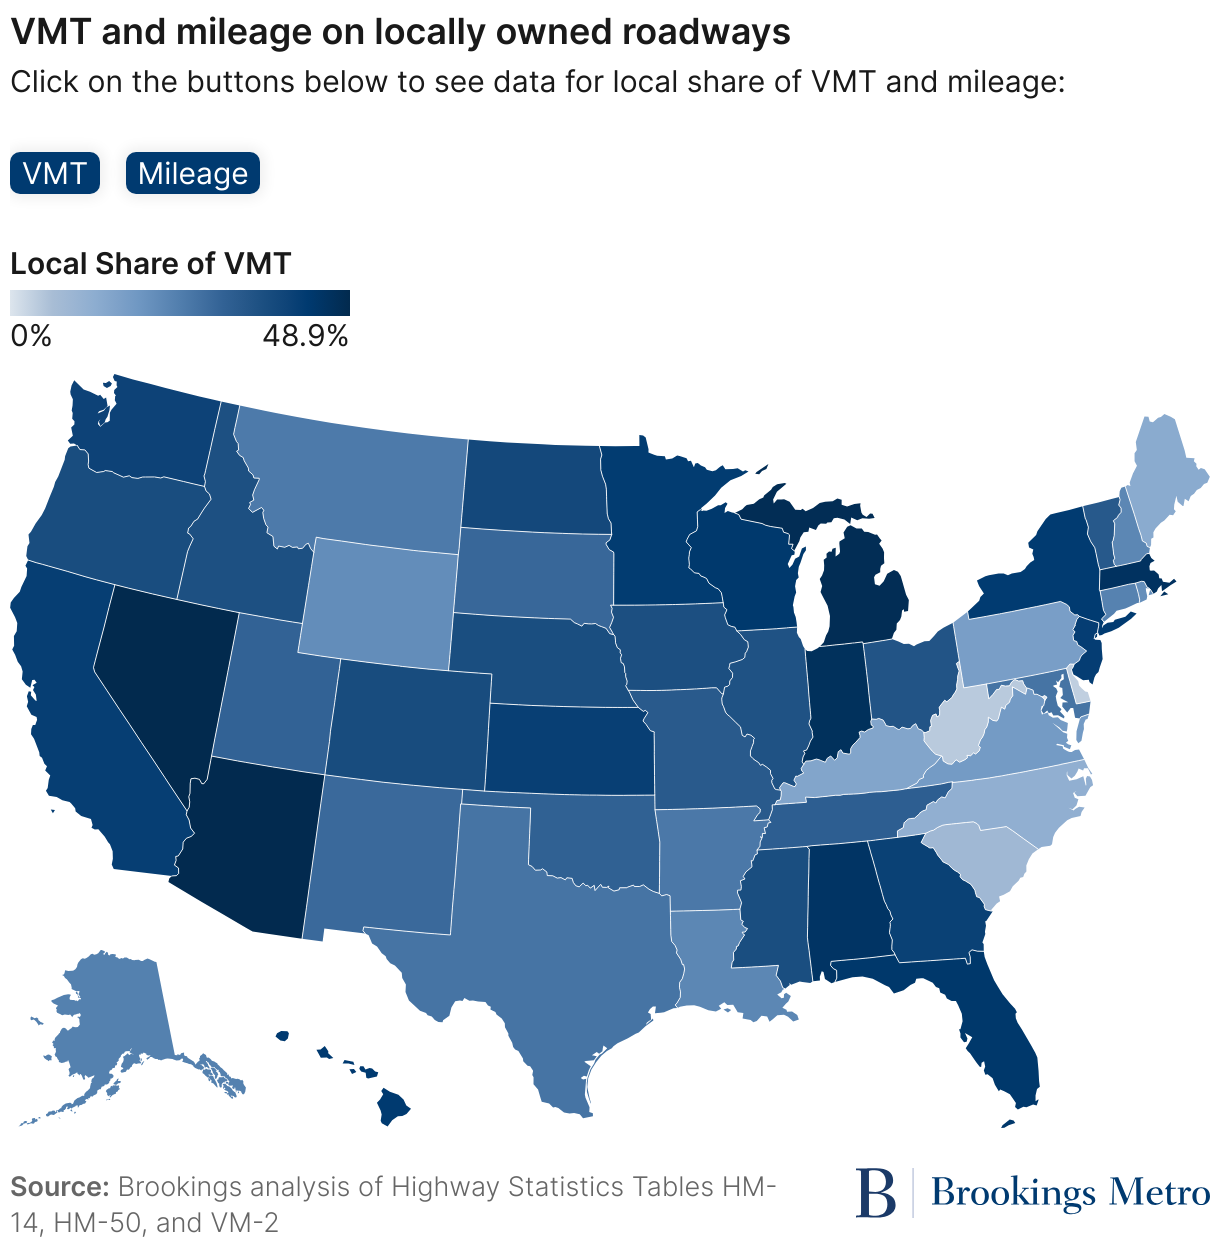
All those trips generate considerable gas tax revenue for the federal government. While public federal statistics make it challenging to estimate the relative share of that revenue by different roadway owners, there is reason to believe tax revenues would hew closely to the VMT share.6vi In this analysis, we use the same 34% statistic as a relative proxy for locally owned roads’ share of total HTF contributions.
While the major focus of this work is federal revenue and spending, every state collects its own gas taxes—most at an even higher rate than the federal government. States also rely on more diverse revenue sources, including general funds and registration fees for all vehicles.
Combined, there is no question that both the federal HTF and every state transportation department receives additional tax revenue beyond what state-owned roads alone generate. Locally owned roads are a major contributor.
Localities may be major revenue contributors to federal and state transportation coffers, but they simply aren’t getting their fair share of those dollars back. Their shortfall is the consequence of two interrelated policies.
The first is the choice by congressional lawmakers to give states priority access to all federal formula funds for roadway projects.7 That means localities cannot directly access the gas tax revenues their roadways contribute to the HTF’s Highway Account. Even when federal law does permit localities to directly access HTF funds—in this case, through the 2021 Infrastructure Investment and Jobs Act’s (IIJA) competitive grant programs—it’s only for a single project or even smaller planning grants. Such unpredictable and one-off funds are no substitute for guaranteed funding via annual formula distributions.
Second, there are few federal requirements for states to deliver (or “suballocate”) a certain amount of federal funds down to the local level.8 Instead, state legislatures and transportation departments have the initial authority to determine how they want to divide state-controlled funding between their own network, direct spending on locally owned roads, or sub-awarding (aka “grants-in-aid”) to localities. For example, even though federal law gives larger metropolitan planning organizations (MPOs) certain project selection authorities, a state can maintain fiscal control by opting to spend all money on the National Highway System.9 Said more plainly, states overly determine what localities get.
The net effect is sizable underinvestment in locally owned roads. Due to a public accounting gap, the U.S. Department of Transportation (USDOT) does not report what states did with federal funds. However, we can see how states spent their mix of federal plus own-source revenues. In 2022, states spent a total of $29.9 billion on local roads and streets, including $21.7 billion via grants-in-aid. That’s only 16% of the total $191.7 billion spent by states that same year—far less than the local VMT share of 34%.10
All but three states have a shortfall between locally generated revenue and the funds invested back into the locally owned network. One is Maine, where local roads receive double the share of VMT they host (13%), or over a quarter of all the state’s federal funds. South Carolina and Virginia also spend a bit more on local roads, led in both states by significant grants-in-aid. While the more granular 2023 VMT data is still preliminary, Colorado is also poised to join this club. The state increased its grants-in-aid to local governments by 263% from 2022 to 2023.

Locally owned roads are in worse condition than state roads, demonstrating the need for greater investment
It’s clear that local authorities aren’t receiving their equal share of user fees back from their federal and state counterparts. What makes the fiscal imbalance even more troubling, though, is that local roads are in far worse physical condition than the state-owned portion of the national network. Since effectively all trips use local roads at some point, a lower-quality network raises the risks of vehicle damage and delay for every road user. (This section compares the smoothness of roadways, not other design standards such as sidewalk quality.)
Overall, state roads are in good shape. Just 11% of state-owned roadway miles are considered in poor condition when using either the International Roughness Index (IRI) or Present Serviceability Rating (PSR).11 The percentages are even lower when looking strictly at rural (2%) and urban (5%) interstate and freeway miles, which makes sense considering those roads carry high-speed traffic and a disproportionate share of heavy trucks. The other main category of state-owned roadways is “other principal arterials,” or main throughfares that tend to have higher speed limits. Relatively few of those roadway miles are in poor condition, although far less rural mileage is in poor condition (3%) compared to urban mileage (15%).
By contrast, over 36% of all locally owned roadway miles are in poor condition.12 The rates are noticeably worse in urban areas, where 43% of the road network is in poor condition. Of course, slower speed limits on many local roads means the conditions can be a bit worse. But even locally owned “other principal arterials” are more often in poor condition in rural (20%) and urban (51%) areas than their state counterparts. This kind of like-to-like comparison underscores the issues raised by such a sizable fiscal imbalance between state and locally owned roads.

Other studies routinely confirm that America’s roads are in poor condition. In 2024, USDOT informed Congress that the nation’s interstate highways were in better condition than the National Highway System writ large. And according to the American Society of Civil Engineers, 39% of the country’s major roadways were in poor or mediocre condition in 2024. The patterns are clear: While much of the country’s highest echelon of roadways are in good condition, too many major American roads owned by local governments are not.
Returning gas taxes to local roadway owners would modernize federal highway policy and respond to contemporary challenges
The National Highway System is a powerful example of how well-designed public policy can deliver economy-shaping investments. From 1956 through the end of the century, Congress and the states perfected a system to capture revenue from the growing pool of drivers to build highways mostly from scratch. The resulting 160,000-mile network is still instrumental in promoting goods trade and shortening trip times across the country, making that network’s maintenance an ongoing national priority. Yet while that original build-out was essentially complete in the early 1990s, the country is still using much of the original policy architecture.
Just like how federal lawmakers recognized the opportunity that fast-moving highways could create for commerce in the mid-20th century, today’s lawmakers should respond to today’s challenges. Returning some federal gas tax dollars to localities and their shared regions is both a fairer approach and a prudent response to the country’s greatest maintenance needs.
Considering their total share of driving, regions and localities have reasonable claim to a sizable share of federal funds. Using 2022 data, their VMT share of 34% would equate to $10.3 billion in federally apportioned funding that year alone. Those numbers are especially large in higher-population states with relatively high local VMT shares, such as California ($1 billion), Texas ($941 million), and Florida ($584 million).

It’s important to put these kinds of numbers in context. Returning $319 million in annual federal funding to Alabama’s cities and counties, for example, would transform their public works departments, accelerate construction on priority corridors, and free up more funding for public safety, education, and other locally managed assets. These local governments have been subsidizing their state for decades through federal transportation taxes; returning fiscal resources to them would help rebalance the condition of the full network.
With the IIJA set to expire in November 2026, now is the ideal time to consider adjusting the federal apportionment formulas. One option is to launch a new regional investment program, assigning revenue based on a more advanced analysis of VMT and tax receipts. Another is to modify a current formula program, such as the Surface Transportation Block Grant, to deliver money directly to regions and their municipalities. Policymakers will also need to consider who would qualify as direct funding recipients, suballocation methods within regions, project qualifications, and other conditions.
This analysis also underscores the need to expand transportation asset management policies (known as “TAMP” within federal policy context). Current federal policies only require states to measure conditions on the National Highway System. This report confirms such a scope overlooks the major locally owned roads in the worst condition. Reformed TAMP policies should require states to monitor all federal-aid highway system miles and offer fiscal support to do so. A broader universe of data will offer a clearer picture of which assets are most in need of investment.
States don’t need to wait for federal action
This analysis makes clear that gas tax revenues and incomplete road condition data are distorting the fiscal picture for state officials. Capturing additional revenue from roads that states don’t own makes it appear that their network produces more own-source revenue than it really does. Not only has this led to worse road conditions for the state’s drivers using locally owned roads, but it also may be incentivizing state officials to overprioritize or overbuild their own network in the process—creating a longer-term maintenance burden for every household and business.
This data should underscore the opportunities a fiscal rebalancing offers. Returning more funding to localities would directly address some of the worst road conditions, while at the same time encouraging state agency officials to better judge the merits of projects on their own network. Legislators, governors, and other state leaders should see fiscal rebalancing as another way to bring greater accountability to their state transportation programs and improve the driving experience in their state.
Fortunately, many states already demonstrate a more pro-local approach. California, Colorado, and Iowa all expended over 30% of their total transportation disbursements in 2023 on grants-in-aid to localities, while Arizona and Minnesota weren’t far behind. That same year, Michigan spent over a third of its disbursements on direct capital investment in local roads. States could also continue to experiment with fund swapping to extend the combined reach of federal and state dollars into regions and localities. Other states can reference those policies to model their own legislative and agency approaches.
Conclusion
Elected officials have long supported the concept of a user-pay principle when determining how to invest precious tax revenues in the country’s transportation network. While many still favor the user-pay system, both federal and state policies have not provided locally owned roads with a fair share of their users’ tax contributions. This rerouting of funding has led to a drop in the physical quality of a large portion of the nation’s roads simply because they are locally owned, leading to constrained municipal budgets and a distorted fiscal picture for federal and state officials.
Federal policymakers should address this fiscal imbalance head-on. Revising federal formula programs to return more money directly to local revenue generators can improve roadway conditions for all system users, spreading benefits to all the people and businesses who rely on the complete network throughout their daily life.
Authors


-
Acknowledgements and disclosures
The authors are grateful for thoughtful comments from stakeholders who provided feedback on specific data and framing. The authors also would like to thank Michael Gaynor for editing, Carie Muscatello for her web and print design, and the rest of the Brookings Metro communications team for their support. All remaining errors and omissions are the sole responsibility of the authors.
Brookings Metro would like to thank the Kresge Foundation for their generous support of this analysis. Brookings Metro is also grateful to the Metropolitan Council, a network of business, civic, and philanthropic leaders who are both financial and intellectual partners of the program.
-
Footnotes
- While gasoline and diesel sales contribute the bulk of HTF revenues, less than 20% of revenues come from taxes on heavy truck and trailer sales, heavy truck use, and tires used by heavier vehicles.
- Congress has regularly infused the HTF with general fund revenues to ensure it stays solvent. While the infusions are not transportation–generated revenues, they are predominantly sourced from counties with higher household and business earnings.
- This analysis does not address the Mass Transit Account within the Highway Trust Fund, which receives less than 15% of total tax revenues.
- The major exceptions here are the states that own most local-serving roads.
- Since Washington, D.C. owns all roads in its jurisdiction, we exclude it from this analysis.
- Conflicting characteristics make it challenging to estimate how HTF tax receipts may vary between local– and state–owned roads. On the one hand, slower driving speeds on local roads mean less fuel efficiency and greater relative tax revenue per mile driven. By contrast, heavier trucks spend more of their time driving on state-owned interstates and other roads (see the VM-1 table). With additional data and analysis, it would be possible to create confidence intervals around total tax contributions by road owner.
- This excludes planning grants (of which some are directly delivered to MPOs), transit formula funds, and certain project selection rules in urbanized areas over 200,000 people (known as Transportation Management Areas, or TMAs).
- Many formula programs do require spending in certain locations within a state, but the project selection authority for roadway projects depends on whether it occurs on the NHS or not. See Section 134 of Chapter 23 of the U.S. Code.
- As a major example, the Surface Transportation Block Grant program requires states to obligate 55% of the funds they receive to projects in metropolitan areas—and then MPOs in a TMA maintain project selection authority over non-NHS roads. However, since states still retain fiscal control, they can simply choose to spend funds on the NHS.
- When looking at the more recent 2023 data, the percentage of state funds directly expended on local roads was still 16%.
- The International Roughness Index (IRI) qualifies roads as good condition when they fall below 95, adequate when they fall between 95 and 170, and poor condition above 170. The Present Serviceability Rating (PSR) qualifies roads as good condition when they are above 4.0, adequate when they fall between 2.0 and 4.0, and poor condition below 2.0. IRI is the preferred metric, but when IRI data is not available and PSR is, PSR is used to categorize the quality of the roadway segment.
- States are only required to report condition data on certain roadway classes, excluding urban and rural local roads and rural minor collectors. Given that requirement and other limitations in HPMS data, we limit ourselves to national analysis and do not draw state-level conclusions.
The Brookings Institution is committed to quality, independence, and impact.
We are supported by a diverse array of funders. In line with our values and policies, each Brookings publication represents the sole views of its author(s).