


Introduction
Americans’ pay has been buffeted by numerous factors since the pandemic began: historic job losses at the beginning of the pandemic, strength in the labor market through the recovery, sectoral shifts in the wake of the pandemic, and ongoing high levels of inflation. Remarkably, there is little consensus on how workers’ pay has fared over this period. Some argue that the last several years have been a time of historic gain for workers’ pay, while others argue that pay has been falling since the start of the pandemic.
Why is there so little consensus about what has happened to pay? In this analysis, we walk through the complications that arise when trying to understand how pay has changed, and we provide a comprehensive evaluation of how these complexities affect conclusions about the state of today’s labor market.
First, there are various metrics of pay. We define pay as compensation for work (cash and, sometimes, benefits), before taxes and government transfers. In this piece, we describe the differences between several commonly used measures of pay: Average Hourly Earnings (AHE), the Employment Cost Index (ECI), Usual Weekly Earnings, and Total Compensation. These metrics have key differences, such as what types of compensation they include and whether they account for factors like the amount people work or changes in the composition of the labor market. Some commonly used measures can be hard to interpret because they leave out important groups, such as those whose pay dropped to zero because they are no longer working.
Second, it is most informative to understand how real pay (i.e., nominal pay adjusted for inflation), has changed to assess how purchasing power has changed. However, as we show, deflating by the Consumer Price Index (CPI) or the Personal Consumption Expenditures (PCE) index point to different conclusions. As we explain below, the CPI better reflects the salient out-of-pocket costs of consumer spending. The PCE index, on the other hand, better reflects the total costs of consumer spending, including more expenses that are not directly incurred by households.
Third, a fundamental question when asking if pay has increased or decreased is: Relative to what past period? The choice of reference period matters significantly, particularly given the volatility in the economy in the past several years. We study how pay has changed relative to a variety of reference periods, before and during the pandemic, as well as relative to longer-term trends.
Fourth, the story is not the same for everyone. We discuss how living standards have changed for all types of workers across the distribution, rather than just for the average or median worker.
If one is most interested in understanding the typical pay among those working (i.e., excluding non-workers), Average Hourly Earnings and Weekly Earnings are the most informative. If one is interested in pay changes within occupations and industries, the ECI is most informative. Finally, if one is interested in aggregate pay across all individuals accounting for changes in employment, the most informative measure is Total Compensation (we use “Total Compensation” to refer to compensation reported in the National Income and Product Accounts).
Generally speaking, we find measures of typical and aggregate pay, adjusted by PCE inflation, have grown since 2019 and have kept pace with or exceeded longer-term trends. Results are more mixed when those measures are deflated by CPI; we still see gains since 2019, but Average Hourly Earnings and Total Compensation are below longer-term trend levels. In other words, nominal pay by these measures has done relatively well in keeping up with overall costs of living, measured by the PCE. In contrast, nominal pay has done less well in keeping up with increases in the costs of goods and services that are much more salient to consumers, measured by the CPI. This finding may speak to the disconnect between the remarkable strength in consumer spending and the low levels of satisfaction consumers describe regarding their economic situations.
In addition, gains in pay have been particularly strong for lower-wage workers. For example, while overall ECI deflated by PCE remained roughly constant since 2019, it is notably higher than 2019 for the lowest-wage industry. There are similar patterns for lower-wage workers using the other pay measures. For higher-wage workers, the ECI suggests that nominal pay has grown about in line with or more slowly than prices, while Average Hourly Earnings and Weekly Earnings show roughly no change or some small positive changes for higher-wage workers. Again, we see that deflating by CPI points to weaker pay growth across all groups.
All four pay measures have increased since the end of 2022, deflated by either inflation measure. Whether nominal pay continues to outpace inflation will be important to watch in future quarters.
Our focus in this piece is on compensation from work, but it is important to note that there were also large changes over this period in government transfers. In particular, the poverty rate that accounts for the effects of such transfers fell from 11.8 percent to 7.8 percent from 2019 to 2021, before rebounding to 12.4 in 2022. These changes were largely driven by expansions in government transfers during the pandemic that expired in 2021. Thus, total household resources have changed over the last several years for reasons beyond pay.
What characterizes different measures of pay?
We consider four key measures of pay:
- Average Hourly Earnings (AHE);
- Employment Cost Index (ECI);
- Usual Weekly Earnings; and
- Total Compensation
In table 1, we highlight key differences in the four pay measures in terms of: 1) the source of the data, 2) what types of compensation are included, 3) whether the measure adjusts for changes in the amount that people work or whether they work, and 4) whether the measure adjusts for changes in the composition of workers. In our analysis, we aggregate all measures to the quarterly level.
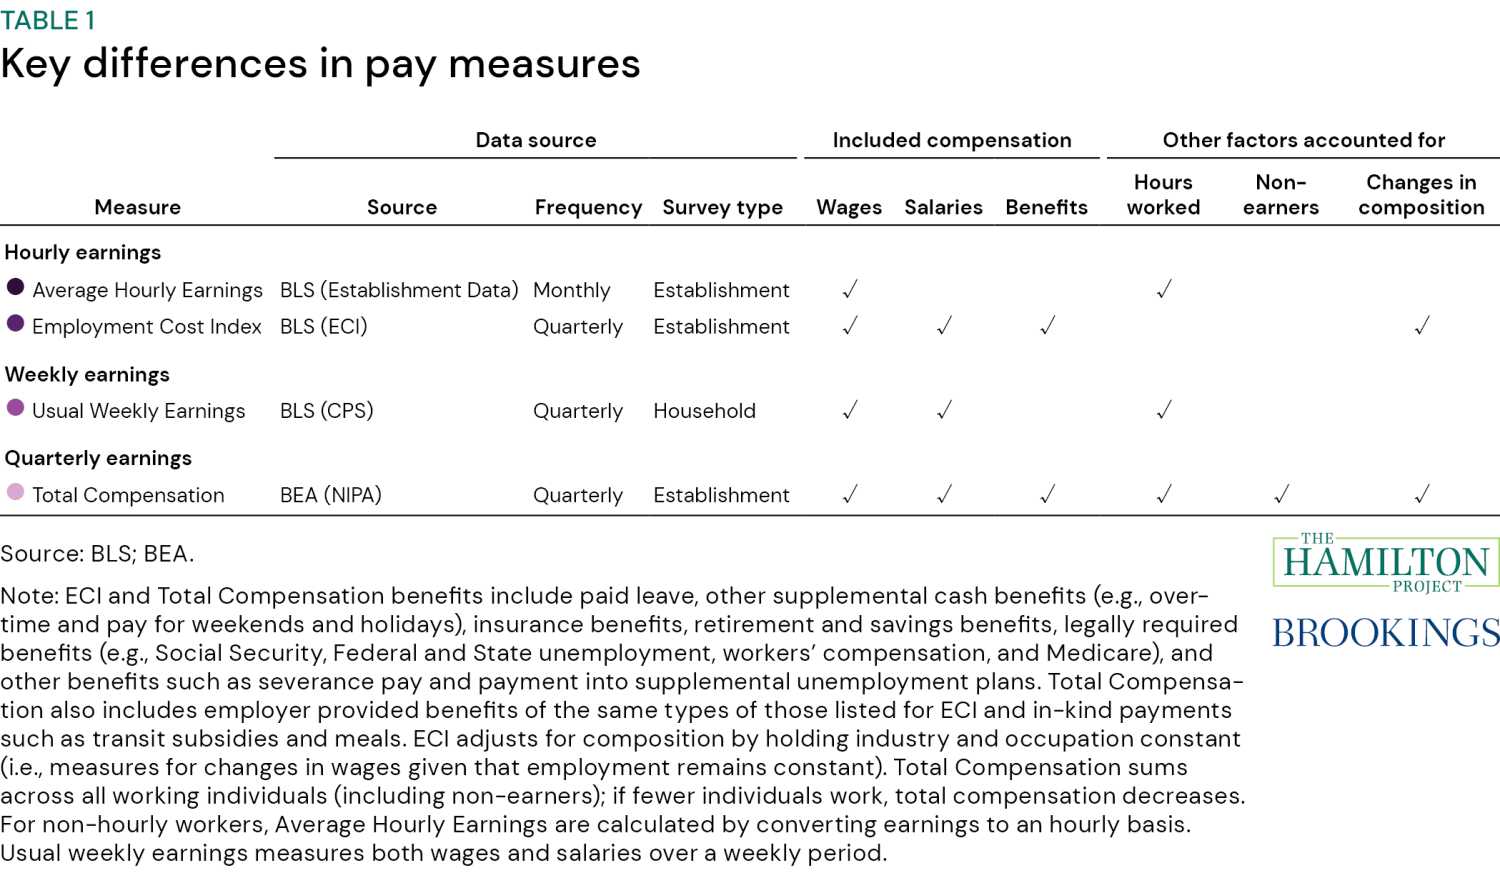
Type of Compensation. The first key difference between measures to note is whether the measures are capturing hourly, weekly, or quarterly pay. The two hourly measures—AHE and ECI—measure hourly wages paid to workers and include both hourly and salaried workers. The weekly measure—Weekly Earnings—directly captures changes in hours worked per week. Weekly Earnings is the only measure of pay that uses employee-reported information, instead of employer-reported information as in the other measures. We focus on median Weekly Earnings for the main analysis and examine other distributional outcomes in a separate section (along with distributional outcomes in AHE and ECI). Total Compensation, on the other hand, represents total pay in each quarter, so it accounts for changes in the number of workers and the amount they work. Additionally, ECI and Total Compensation include some measures of non-cash benefits (e.g., insurance or retirement benefits) whereas the other measures only include cash payments.
Compositional Adjustments. A second important difference between the various measures is whether and how the measures account for changes in the composition of workers. Both AHE and Weekly Earnings reflect earnings for people currently working, so the measures are sensitive to changes in composition (for example, changes in the share of employment within certain occupations and industries). ECI and Total Compensation, on the other hand, both account for certain changes in composition.
The ECI controls for changes in composition across occupations and industries. Specifically, it reflects changes in pay over time, assuming a fixed share of workers in occupations and industries. However, the ECI can still be affected by the composition of workers within occupations and industries; for example, if firms hire lower-productivity people in a particular occupation and industry and pay them lower wages than other workers, the ECI will be dampened. Total Compensation accounts for the composition of workers because this measure sums the total pay of all workers across the U.S. If there is a decrease in employment, this decrease will be reflected in lower Total Compensation. On the other hand, if some workers experience a decrease in pay and some experience an increase, this can look like no change in Total Compensation. One consequence of how Total Compensation is measured is that it effectively places more weight on individuals with higher earnings.
We illustrate differences in these four pay measures in figure 1. We index the measures to be 1 in the fourth quarter of 2019 (i.e., we show the relative change since Q4 2019) so that they are on the same scale. Figure 1a shows nominal values before adjusting for inflation and Figure 1b shows real values deflated using CPI.
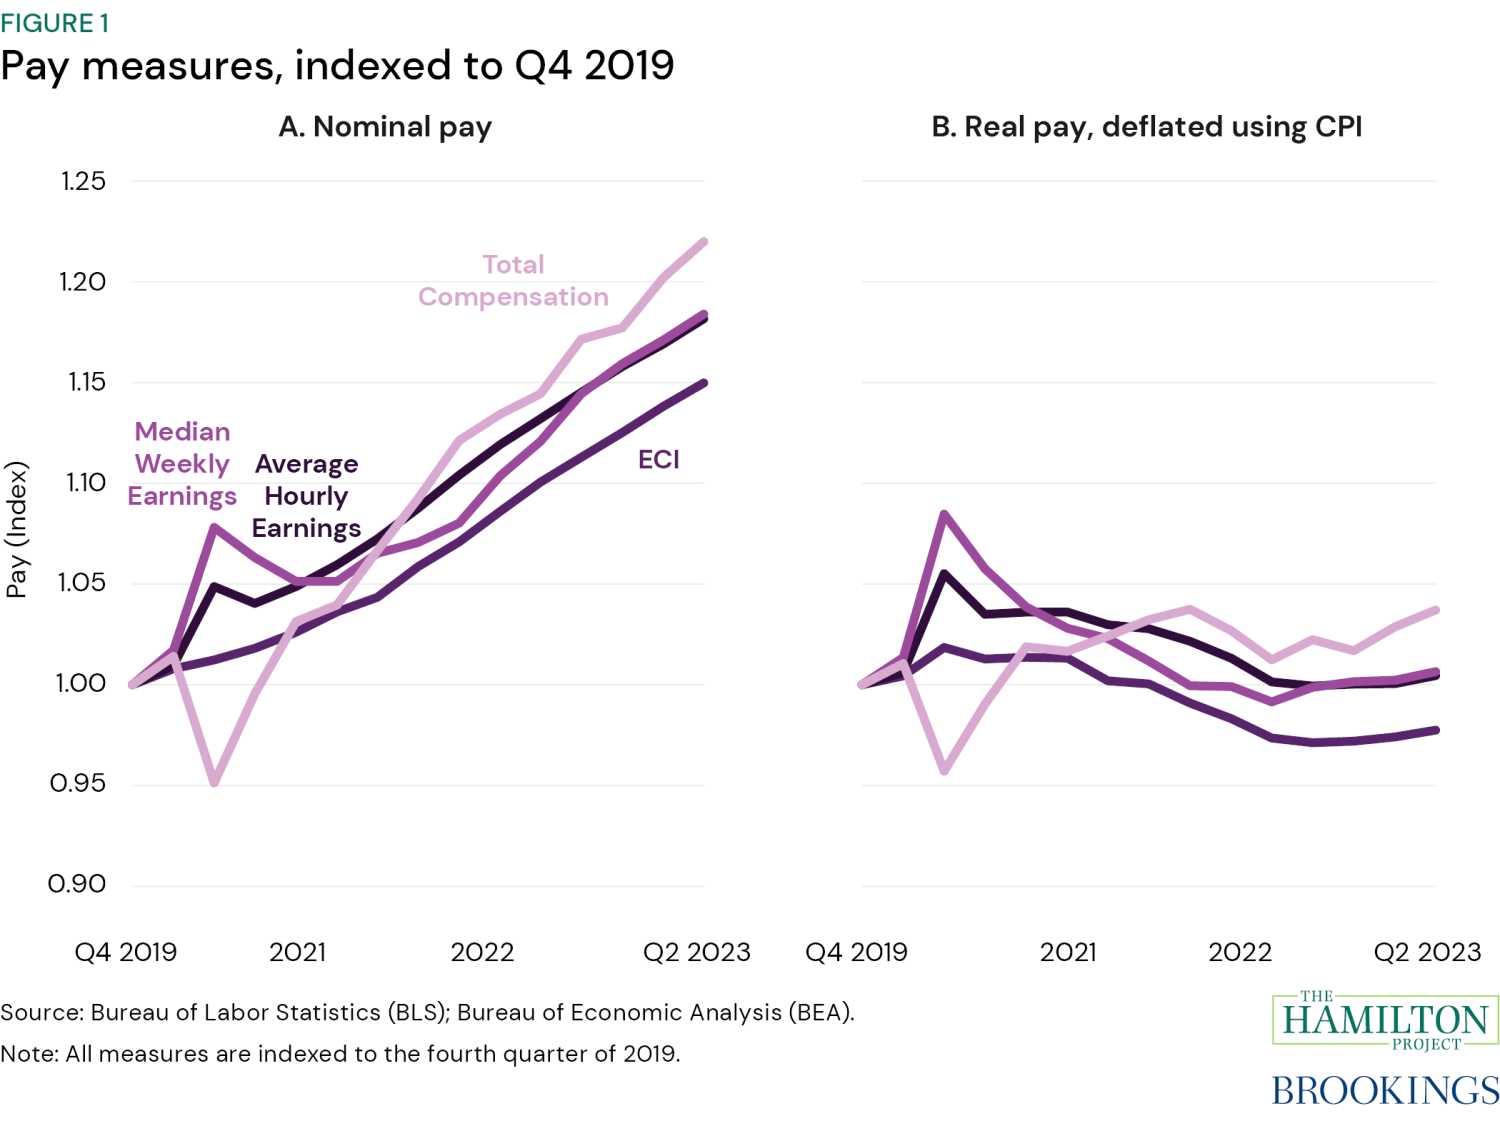
It is clear from figure 1 that adjustments for composition over this period matter. The measures that do not adjust for composition of workers (AHE and median Weekly Earnings) see a large increase in the early period of the pandemic. This is the period when employment fell the most, especially among lower-paid workers (those paid less than the typical worker). For example, from February 2020 to April 2020, the unemployment rate increased by 15.4 percentage points for those with less than a high school education, compared to 6.5 percentage points for those with at least a bachelor’s degree. Thus, the increase in average and median pay for workers in 2020 was, in part, due to the fact that those who remained employed (and therefore in the sample) during this period were higher-educated, and therefore higher-wage, workers.
The measures that do adjust for composition show more moderate increases (ECI) or decreases (Total Compensation) in 2020. Total Compensation, by summing across all individuals, gives the most complete picture of how pay changed for everyone, including those who lost employment. Once employment rebounded, midway through 2022, all the measures evolve in more similar ways, because as more people went back to work, accounting for changes in composition became less important.
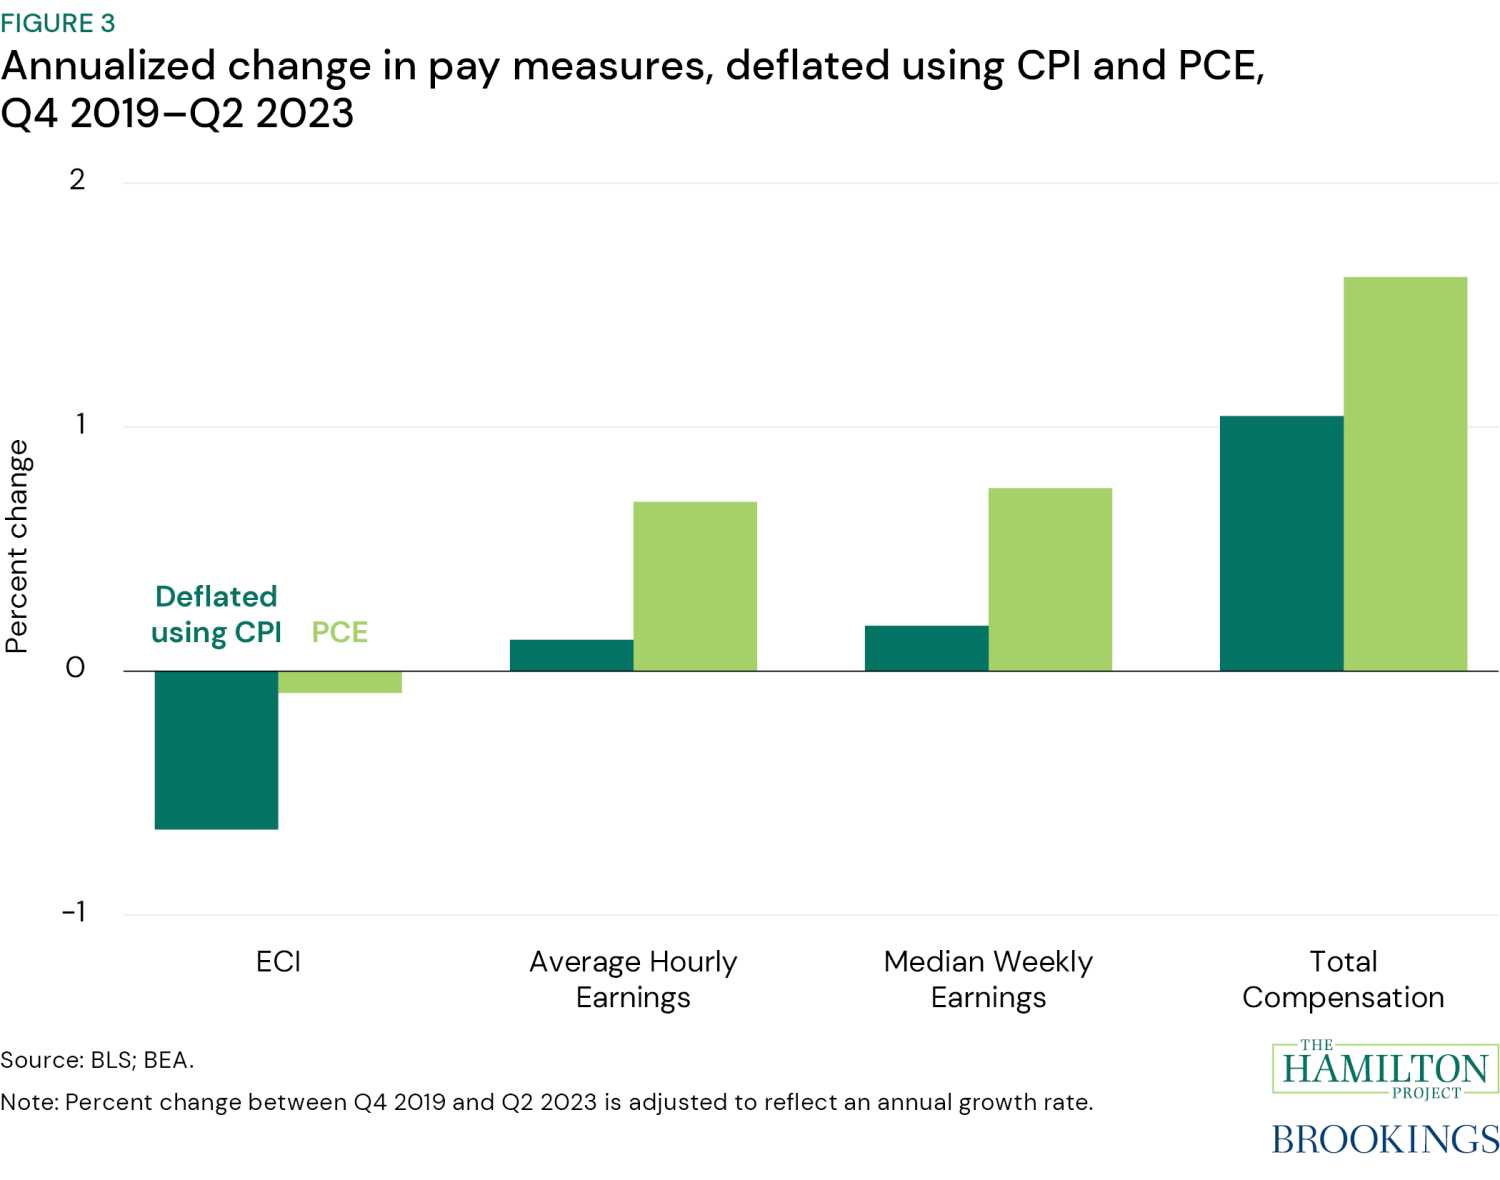
Looking at the whole period since late 2019 (also shown in figure 3 below), the changes in pay range from a modest decrease, with ECI, to a larger increase, with Total Compensation, when adjusting with CPI. For AHE and median Weekly Earnings, the changes lie between these two extremes and show a smaller increase over time.
Part of the disparity between the drop in ECI and the increase in AHE over the period from late 2019 to 2023 reflects industry composition changes that have persisted since the start of the pandemic, and which are held constant in ECI. In particular, the share of total private employment comprised by leisure and hospitality, the lowest-wage major industry, was 0.6 percentage points lower in September 2023 (at 12.5 percent) than in February 2020 (13.1 percent). Indeed, employment in that industry has not even recovered to its early 2020 level. This type of change in industry composition boosts AHE but not ECI.
Finally, as a complement to the four measures in table 1, we examine changes since 2019 in annual median Household Income from the Current Population Survey (not included in figure 1). Household Income includes pay from work as well as cash income from other sources such as Unemployment Insurance. The choice of 2019 as a base year is particularly significant with this measure because 2019 Household Income information was collected from households in spring 2020 and data collection was greatly affected by the pandemic. Given the issues with data collection for 2019, we prefer a longer-run view of changes in median Household Income; we show median Household income from 2000 to 2022 in figure A-5. That figure makes clear that 2019 is an outlier. Indeed, subsequent analysis by the Census Bureau shows that median Household Income as reported for 2019 is overstated by about 3 percent. Because Household Income is only available through 2022, before the increase in pay we observe for all other measures (from 2022 to 2023), we do not rely on Household Income to understand changes in pay since 2019.
What are the ways to adjust for inflation?
Adjusting nominal pay for inflation is necessary in order to assess how real purchasing power has changed (i.e., how pay has actually changed accounting for changes in the cost of living). However, the choice of inflation measure matters. Historically, inflation measured by CPI is generally higher than inflation measured by PCE; year-over-year CPI inflation averaged 0.3 percentage points higher than PCE inflation from 2000 to 2019. Thus, growth in real pay deflated by CPI is generally lower than real pay deflated by the PCE index.
However, as shown in figure 2, the gap between the measures of inflation has been much larger since 2019. In this period, the four-quarter growth rate in prices measured by CPI (dark green) averaged 0.7 percentage points higher than the growth rate of prices measured by the PCE index (light green). As described by the Bureau of Labor Statistics (BLS), differences between CPI and PCE reflect differences in the formula, weights, scope, and a variety of other less important factors.
A full explanation of the differences between CPI and PCE is beyond the scope of this piece, but one issue worth highlighting is that CPI is attempting to measure the cost of out-of-pocket spending, whereas the PCE index is additionally measuring the cost of spending on goods and services that are less directly felt by households. For example, while both CPI and PCE include the cost of things like rent and automobiles, only the PCE index includes the cost of spending on medical care by employer-provided health insurance companies. As a result, for categories that are in both indices, the CPI has higher weights for some goods and services than the PCE index. In particular, housing, which has seen very strong cost growth since 2020, has a weight of 16 percent in the PCE index and 33 percent in the CPI.
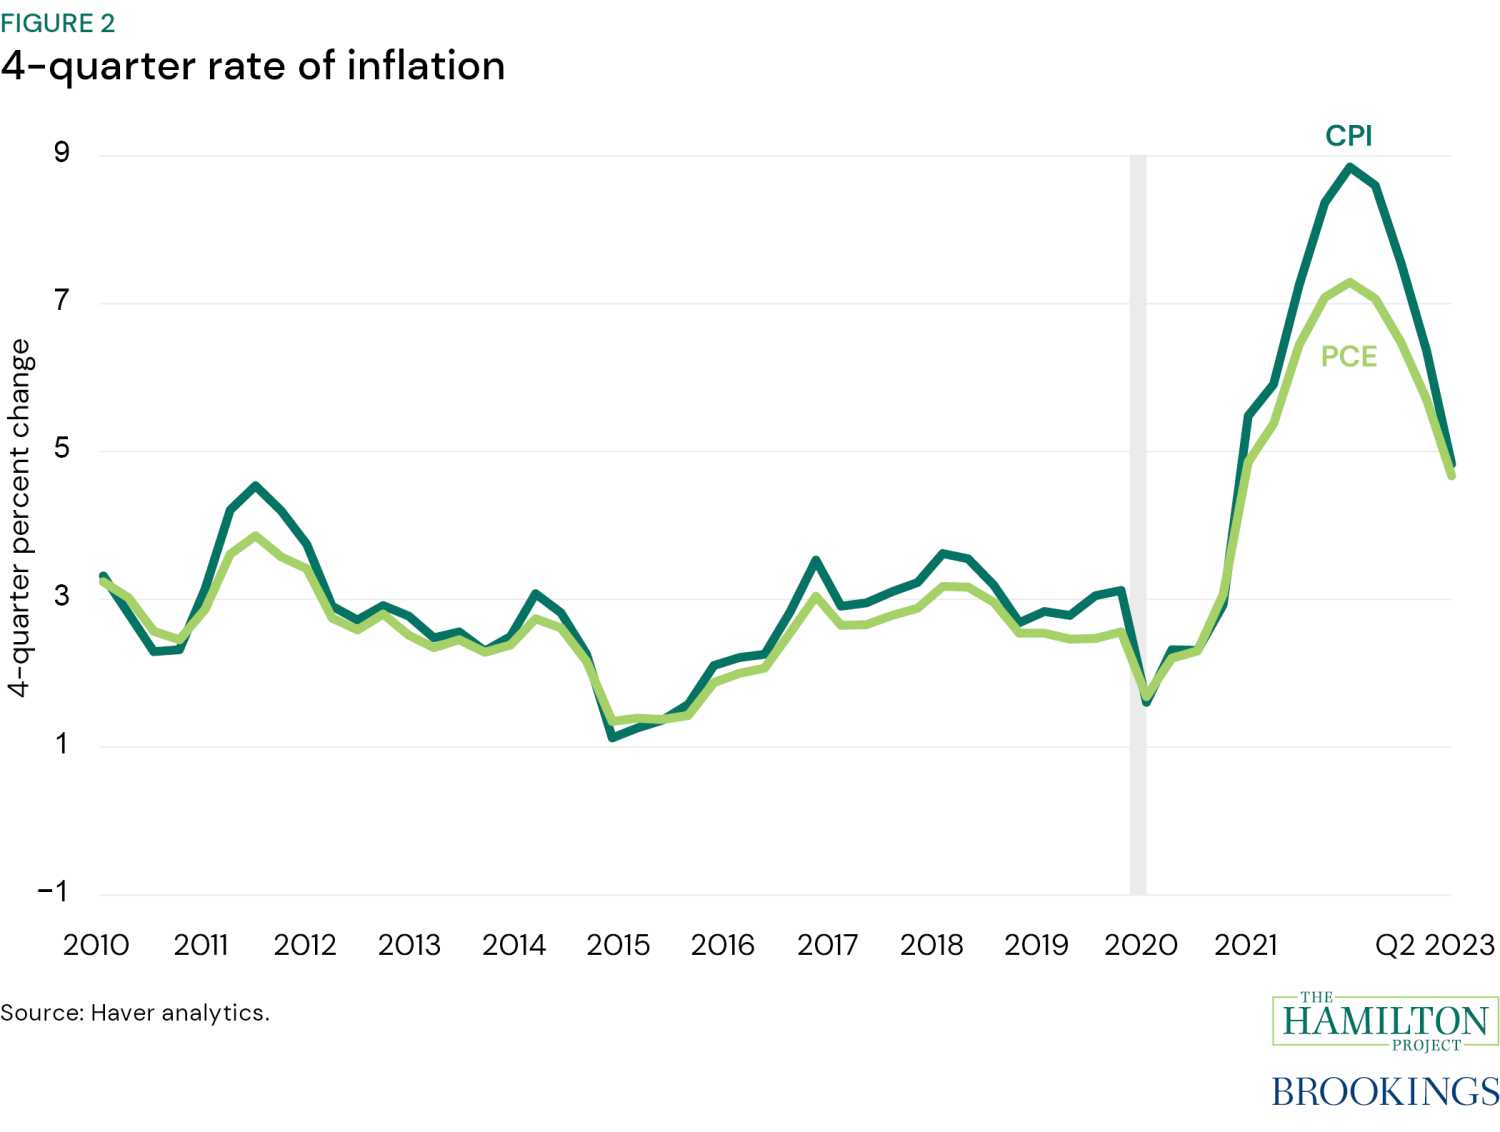
Figure 3 highlights how much the choice of inflation indicator matters. This figure plots the change from Q4 2019–Q2 2023 using the four measures of pay discussed above and after adjusting for inflation using the CPI (dark green) and the PCE price index (light green). The choice of inflation measure can make a big difference; here, deflating using PCE suggests much stronger gains in purchasing power across the measures, as expected.
What period should we choose as our point of comparison?
In the above analysis, we use a single point in time as the reference period—the fourth quarter of 2019. Due to the volatility in the labor market and inflation in the last several years, however, the choice of the reference period has a significant impact on how we understand changes in pay. We illustrate this in two ways. First, we show how recent changes compare to trends from the most recent full business cycle (Q4 2007–Q4 2019), which speaks to how much the changes in the economy since 2020 have disrupted longer-term patterns. Second, we show the sensitivity to various single reference quarter choices—the fourth quarters of 2019 through 2022. This speaks to changes in the labor market during the pandemic and recovery and may suggest what lies ahead in the near term.
Comparing to the most recent full business cycle
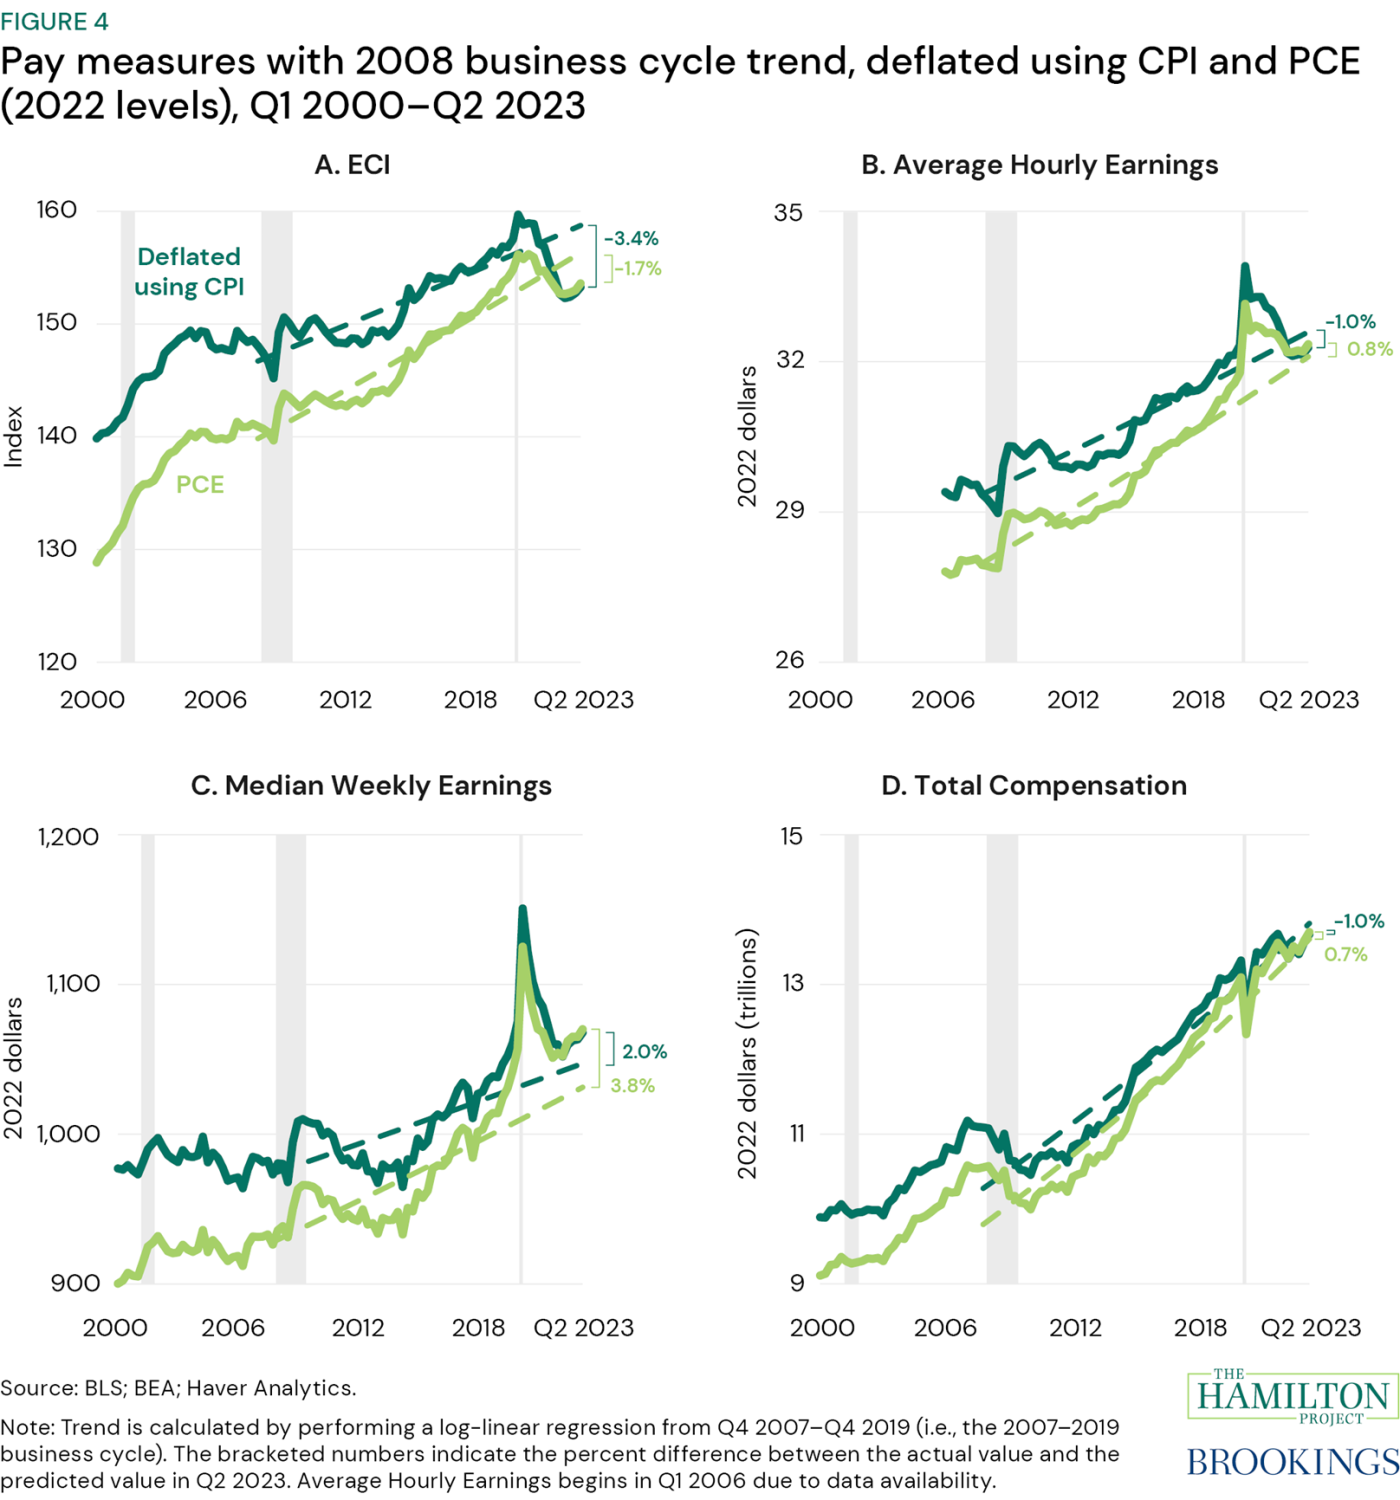
To gauge how much the labor market has recovered over the current business cycle, figure 4 compares current pay to trends over the previous 2007-2019 business cycle. Again, real measures of pay are shown using both CPI (dark green) and PCE (light green) inflation adjustment. (Because we adjust the nominal measures to “2022 dollars,” the real and nominal pay measures are nearly identical in recent quarters; as a result, the solid dark green and light green lines overlap in the latest data plotted.)
The trend lines estimated over the previous full business cycle (2007-19) are plotted as dashed lines, showing predicted levels of pay if this trend had been maintained. The trends are similar, but growth in pay is slightly weaker when adjusted with CPI compared to PCE because of differences in these inflation measures as discussed above. To be sure, the trends are sensitive to the period over which they are estimated. For example, pay growth was quite weak during the first three years of the 2007-19 cycle and then quite strong later in the cycle. Notably, those longer-term trends suggest that, for all measures, pay was above trend in 2019, right before the pandemic.
Again, when looking at recent changes in pay compared to longer-run trends, different measures suggest different conclusions. The bracketed numbers in figure 4 indicate the percent difference between the actual value of each pay measure in Q2 2023 and the predicted value based on trends over the last full business cycle. Using the PCE adjustment, all measures except for ECI are above trend in the first half of 2023. As noted above, ECI offers the clearest look at how much compensation for the same kind of jobs has changed over time. Thus, in recent quarters, pay is at trend or above trend when measured as Total Compensation or pay for the typical job being worked (AHE and median Weekly Earnings), but below trend for pay holding the composition of jobs constant (ECI). Using the CPI adjustment, the findings are more mixed—median Weekly Earnings is above trend, ECI and AHE are below trend, and Total Compensation is just below trend in the most recent quarter.
Importantly, there is a positive trend across all measures and inflation adjustments in the last several quarters. This is around the time inflation began to slow, and changes in nominal pay have been outpacing inflation across all measures. Going forward, it will be important to pay attention to whether the trend of pay outpacing inflation continues.
Comparing to a particular point-in-time
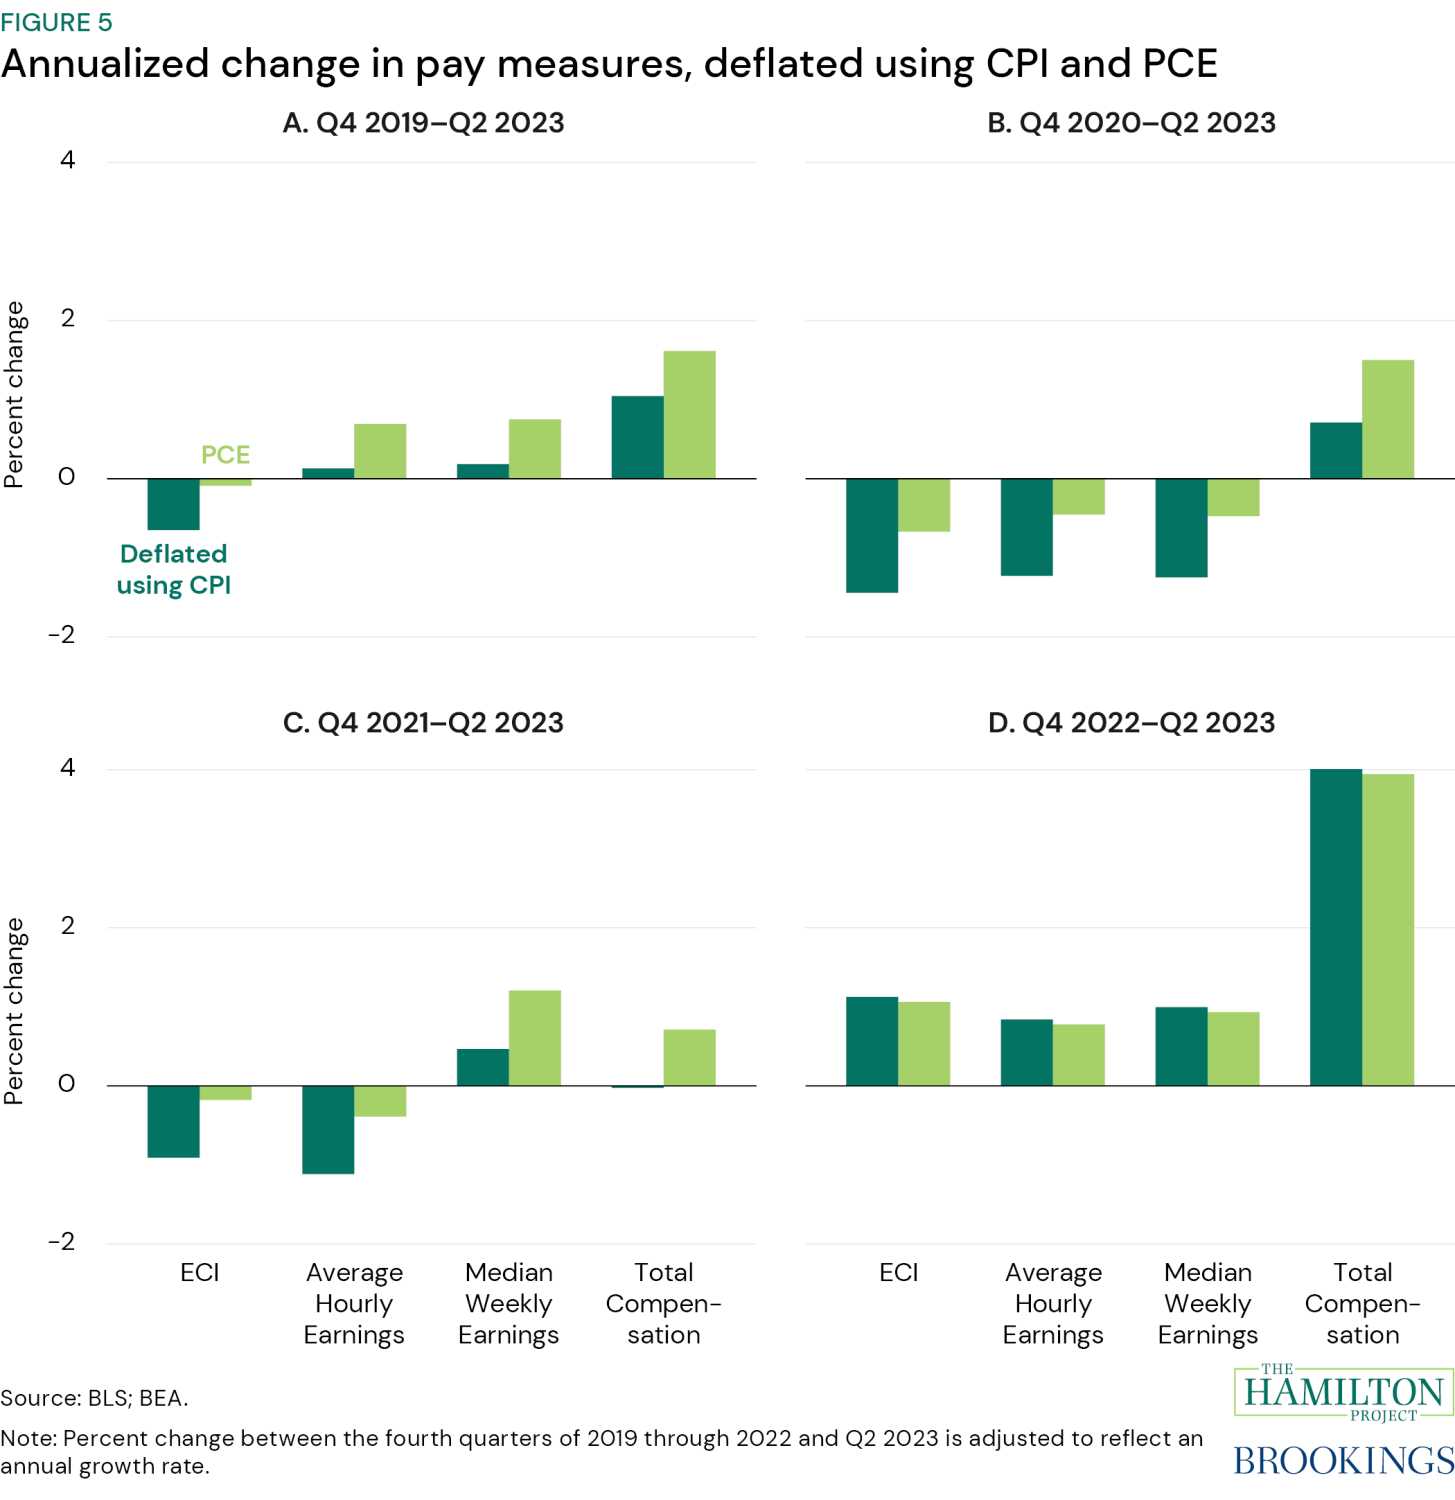
Another way that changes in pay are commonly discussed is to measure growth rates in pay relative to a particular point in the past (as we have done relative to Q4 2019 above). In figure 5, we illustrate how variable the conclusions are when using different fourth quarter reference periods from 2019 (as above) through 2022, reporting growth rates at annualized rates so that they are comparable.
Using a base year of 2020 (figure 5b) or 2021 (figure 5c) generally leads to a more negative picture of changes in pay than that with a base year of 2019 (figure 5a). However, in part this is because AHE and median Weekly Earnings were unusually high during the pandemic due to compositional changes. The results for ECI and Total Compensation are more consistent across the fourth quarters of 2019, 2020 and 2021. Additionally, inflation did not begin to significantly reduce real pay until 2021.
The most recent period—from Q4 2022 to Q2 2023—was one of relative stability in terms of employment and a period of slowing inflation. As we noted using figure 4, it is striking that in this recent period, there is an increase across all measures of pay (figure 5d), and this increase is larger than the increase from the pre-pandemic period to today (figure 5a). The recent pay increases range from about 0.8 percent using AHE to 4.0 percent using Total Compensation (at an annualized rate).
We have also examined changes in median Weekly Earnings inclusive of zeros for non-workers (not shown in the figures). We find that, like Total Compensation, median Weekly Earnings including non-earners increased from the fourth quarters of 2019 through 2022 to Q2 2023. From Q4 2019–Q2 2023, the increase in median Weekly Earnings including non-earners was 0.9 to 1.5 percent (depending on the inflation-measure used) compared to a 1.0 to 1.5 percent in Total Compensation. However, the increase in median Weekly Earnings including non-earners from the fourth quarters of 2020 through 2022 to Q2 2023 was significantly higher than the increase in Total Compensation over the same periods.
How did pay change across the distribution?
We are not only interested in changes in the average, median, or total pay, but in the changes for different kinds of jobs, at different parts of the income distribution, and across different sectors. We explore this next using the measures of pay that allow for distributional analysis through 2023.
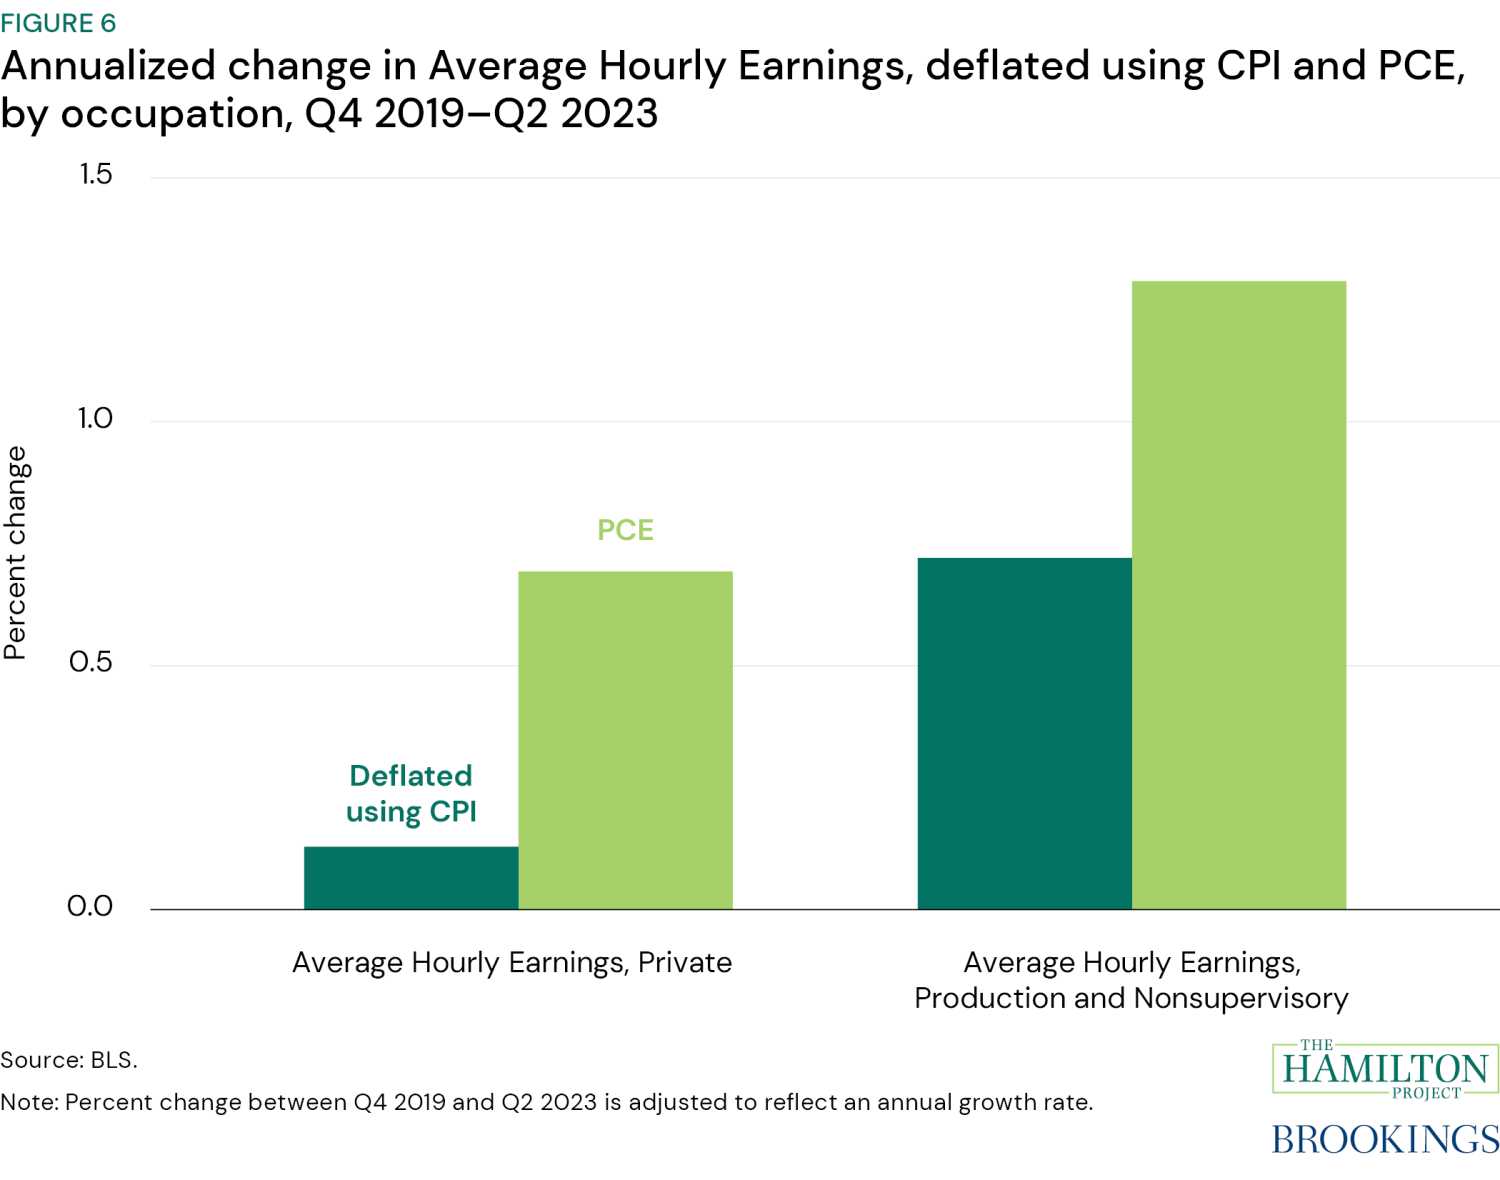
To start, in figure 6, we look at the annualized change in AHE for those in production and nonsupervisory occupations compared to all private employees (our baseline measure of AHE) from Q4 2019–Q2 2023. Workers in production and nonsupervisory occupations, on average, have lower pay than those in private industry. For production and non-supervisory occupations, the increase in pay is consistently higher than the increase in pay across all private employees. (See figure A-6 for AHE by occupation from Q1 2000–Q2 2023; figure A-1 for the annualized change in AHE by occupation for the fourth quarters of 2019 through 2022 to Q2 2023.)
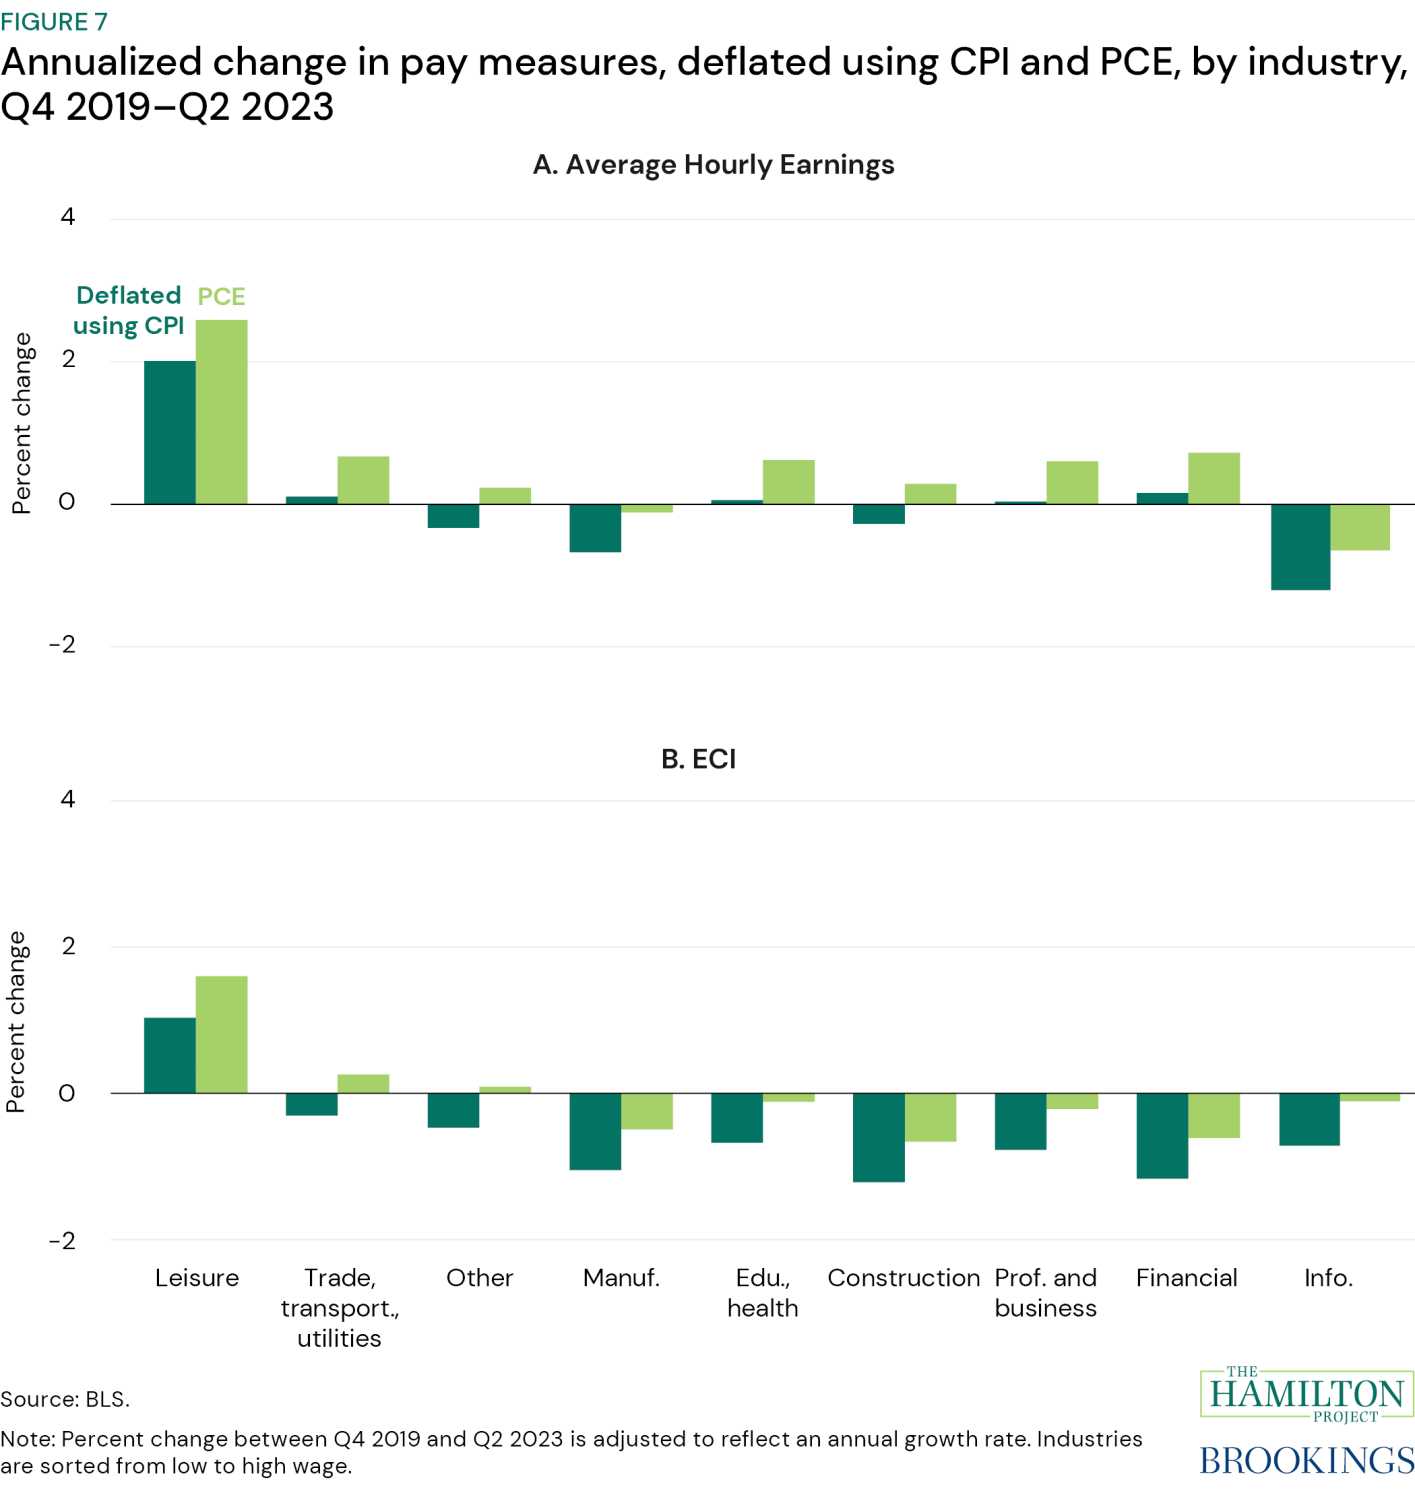
Next, we explore changes in AHE and ECI across sectors. In figure 7a and 7b, we plot the change in pay from Q4 2019–Q2 2023 by industry and sort by lowest (left) to highest (right) wage industries (based on the most recent AHE data).
There is considerable heterogeneity across industries. Leisure and hospitality—the sector paid the lowest on average—is the only one with a consistent increase over time across both AHE and ECI and both inflation adjustments. On the other hand, industries with the highest paid workers (i.e., on the right-hand side of figure 7a and 7b) on average more consistently experienced little change or a decrease in pay. (See figure A-6 for AHE by industry from Q1 2006–Q2 2023; figure A-2 for the annualized change in AHE by industry from the fourth quarters of 2019 through 2022 to Q2 2023; figure A-7 for ECI by industry from Q1 2006–Q2 2023; figure A-3 for the annualized change in ECI by industry from the fourth quarters of 2019 through 2022 to Q2 2023.)
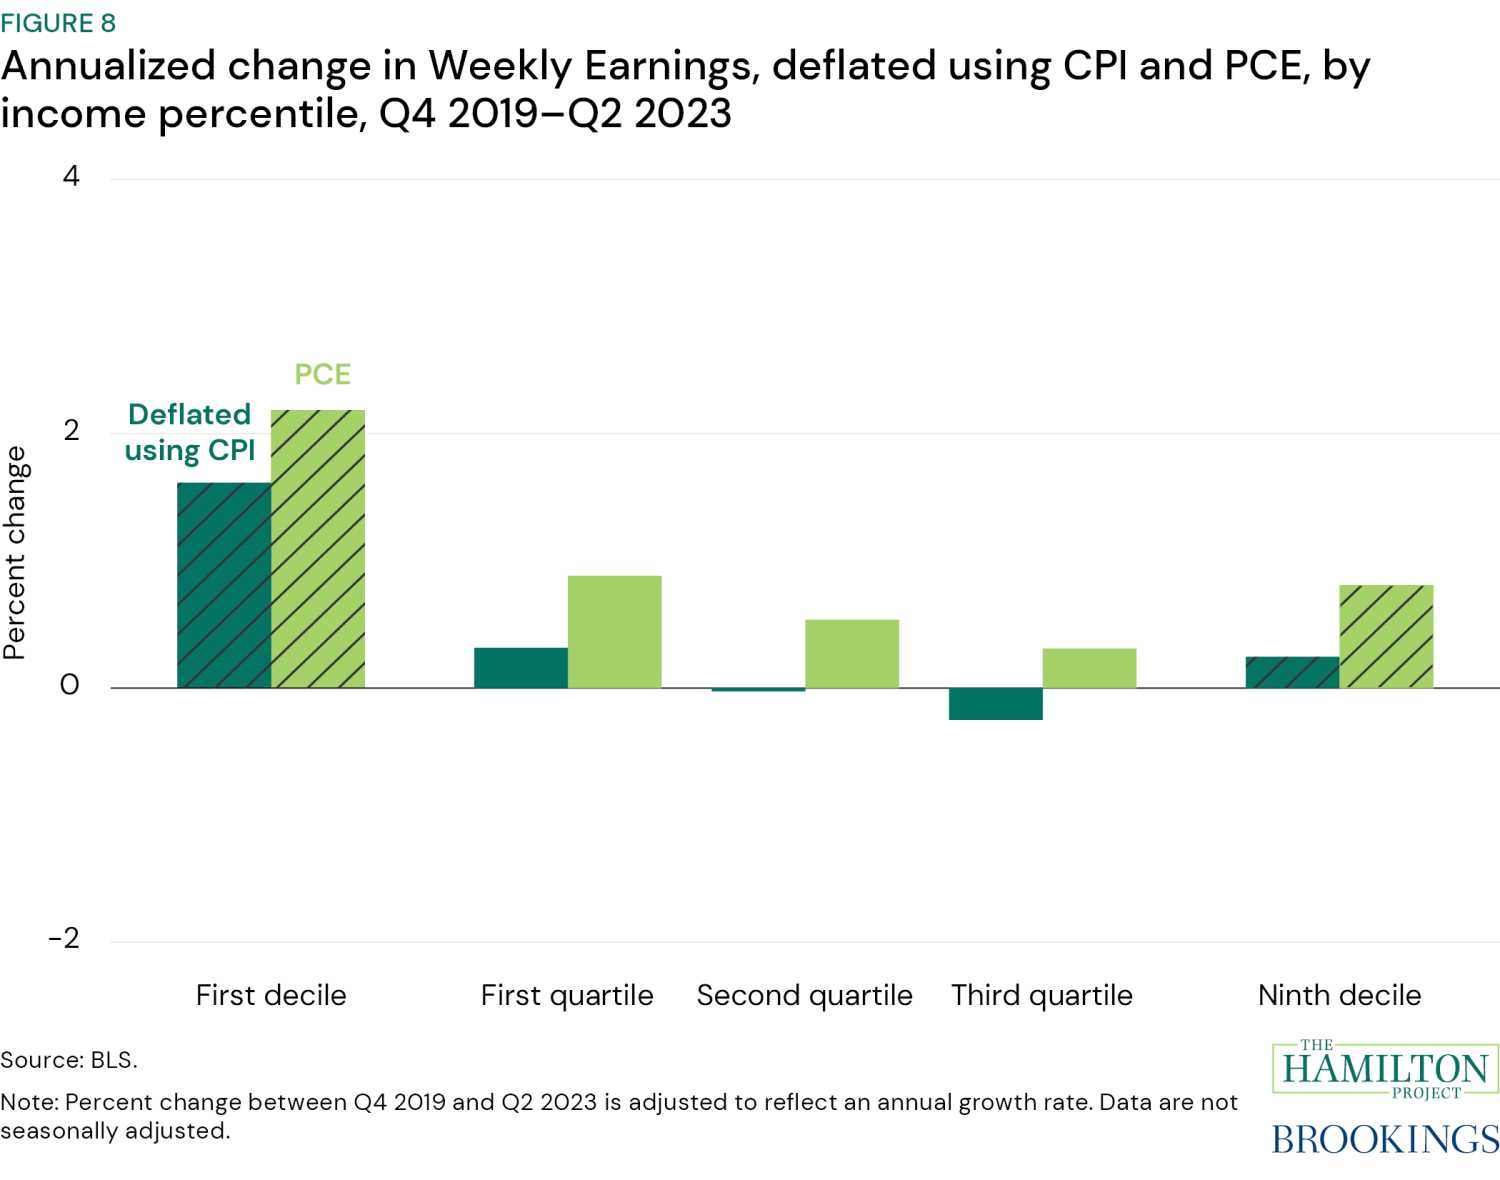
Finally, we examine the measures of Weekly Earnings across the distribution. Figure 8 shows the change from Q4 2019–Q2 2023 in Weekly Earnings for the upper limits of the first decile, the first through third quartile, and the ninth decile. Consistent with the findings in figure 7, we find increases since the end of 2019 in Weekly Earnings at the bottom of the distribution: Workers in the first decile (i.e., in the bottom 10 percent of the income distribution) saw a roughly 2 percent increase in Weekly Earnings (2.2 percent using PCE-adjusted values and 1.6 percent using CPI-adjusted values). Workers in the first quartile saw a 0.9 percent increase using PCE-adjusted values and 0.3 percent using CPI-adjusted values. Workers in the top two quartiles experienced a smaller increase (or slight decrease in some quartiles using CPI-adjusted values), and those in the ninth decile experienced an increase in Weekly Earnings similar to those in the first quartile. (See figure A-9 for Weekly Earnings by income percentile from Q1 2000–Q2 2023; figure A-4 for the annualized change in Weekly Earnings by income percentile from the fourth quarters of 2019 through 2022 to Q2 2023.)
It is worth noting that despite these increases, people at the bottom of the income distribution still have relatively low pay. For example, if workers at the top of the first decile of Weekly Earnings work 49 weeks, their annual income would be roughly $24,000, which is just below the poverty threshold for a family of three ($24,860). Figures 7 and 8 are consistent with research showing that the COVID-19 recovery was characterized by a reduction in wage inequality, unlike other recent recessions. Research also suggests that this growth at the bottom of the distribution is due to extraordinary tightness in the low-wage labor market, where a high level of job openings allowed workers to switch to higher-paying jobs. However, as we show in figure A-9, it appears that this trend is reversing with the first decile experiencing effectively no growth in pay from Q4 2022–Q2 2023 and the ninth decile experiencing large growth in this same time period. Again, this will be an important trend to keep an eye on.
Conclusion
This paper takes a comprehensive approach to studying how workers’ pay in the U.S. has changed over the last several years. We take this approach as a caution against cherry-picking any one method of evaluating changes over time or any one measure of pay or inflation. This approach also illuminates what is particularly informative across each of these sets of options. We show that one’s perception of the state of pay today depends on the choice of pay measure, the trend or point-in-time used as a point of comparison, the inflation measure used to adjust, and what groups of workers are considered. Additionally, we point out that households have experienced large changes in income due to changes in government transfers over this time period, which is not captured in these measures of pay.
Overall, we see some reasons for optimism. All four pay measures that we examine have increased since the end of 2022, and three of the four have increased since 2019. Comparing to longer-run trends, those same three pay measures, adjusted for inflation with PCE, are recently showing gains that are above the levels predicted by historical trends. ECI shows the weakest growth, but even by that measure, lower-wage workers have seen real growth in pay. Indeed, the measures generally show that workers in lower wage occupations and industries and those with lower earnings saw larger gains since 2019. Finally, workers have been shifting into higher paid occupations since the pandemic.
However, not all of the news about real pay is as positive. First, pay gains are weaker when pay is adjusted using CPI, which reflects the prices most salient to consumers. Second, while the most disadvantaged workers clearly experienced gains in pay since 2019, other workers did not. Finally, the trend of increasing pay for the most disadvantaged workers may be reversing in recent quarters. All of this will be important to continue to understand and may help to explain why the average American consumer feels pessimistic during a time when, on many dimensions, the economy is doing well.
Authors
Related Content

-
Acknowledgements and disclosures
The authors are grateful to Lauren Bauer, Brad Hershbein, and Betsey Stevenson for their insightful comments. The authors also thank Elizabeth Cox and Olivia Howard for their research support.
The Brookings Institution is financed through the support of a diverse array of foundations, corporations, governments, individuals, as well as an endowment. A list of donors can be found in our annual reports published online here. The findings, interpretations, and conclusions in this report are solely those of its author(s) and are not influenced by any donation.
The Brookings Institution is committed to quality, independence, and impact.
We are supported by a diverse array of funders. In line with our values and policies, each Brookings publication represents the sole views of its author(s).