The past decade has brought increasing concern, in countries all over the world, of declines in mental health and well-being. Across countries, chronic depression and suicide rates peak in midlife. In the United States, deaths of despair are most likely to occur in these years, and the patterns are robustly associated with unhappiness and stress. Well-being is also a factor in differential mortality rates among the old, particularly those over age 70. Better understanding the relationship between well-being and aging is not just an academic exercise. Well-being has a robust association with trends that can ruin lives and shorten life spans. These trends are not unique to the U.S. but are particularly stark here.
In a new NBER working paper, we analyze several different datasets for the U.S. and provide extensive evidence on the middle age patterns, new evidence of how they differ across the married and unmarried—which is not the case in most other wealthy countries, and review new work on well-being and mortality among the elderly.
In the U.S., as in many other countries, there is widespread evidence of midlife lows in well-being data, including happiness and life satisfaction. There is also evidence of a hump-shaped relationship in unhappiness data such as depression and despair. This is consistent with the patterns in deaths of despair in the U.S.—those from suicide and drug and alcohol poisoning—which disproportionately occur among uneducated whites in their prime age. Approximately 1 million Americans died of deaths due to suicide, opioid and other drug overdoses, and alcohol-related diseases from 2005 to 2018, a trend that is driving up the overall mortality rate and contributed to reduced life expectancy between 2014 and 2017.
Beyond being empirically interesting, the relationship between aging and well-being has implications for substantial parts of the world’s population.
There is also a notable rise in reported pain in the U.S., with more reported daily pain than in 30 other wealthy countries, many of them with much lower per capita income than the U.S. In Gallup’s U.S. Daily Tracker poll, we find that the proportion of people saying they experienced physical pain yesterday rose from 23.5 percent in 2008 to 27.2 percent in 2017. Whites in their prime age years report more daily pain than do minorities. There is no objective reason that this should be so, as far as we can tell, and it is likely that part of this trend is the same psychological pain that underlies deaths of despair. Meanwhile, in the U.K., the proportion of individuals reporting that they were depressed rose sixfold from 1997-2018, and there is also evidence that deaths of despair are increasing in several European countries.
These trends, and their strong association with the middle-age years, are cause for concern, in our view. The decline in well-being in midlife, meanwhile, is particularly perilous for the less educated in some wealthy countries, such as in the U.K. and the U.S., due to the declining demand for low-skilled work and manifests itself in the above-mentioned drug addiction and suicide, among other trends. While the U-shape holds across many countries and cohorts around the world and over time, what we don’t know is whether these particularly steep declines are unique to the cohorts experiencing this labor market transition and will follow them as they age, or whether it will persist in this age group for decades to come. Better understanding this increase in despair and distress adds urgency to including well-being questions in official surveys in the countries that do not include them regularly (such as the U.S.).
Related Books
In this paper, as in much previous work, we find consistent happiness U-curves. We find that the U-shape holds across several datasets for the U.S. and regardless of whether we include controls for confounding factors (such as education, marriage, and health, or not—i.e., whether we control for these factors and look at the pure effects of aging on well-being, or simply look at the patterns in the raw data).
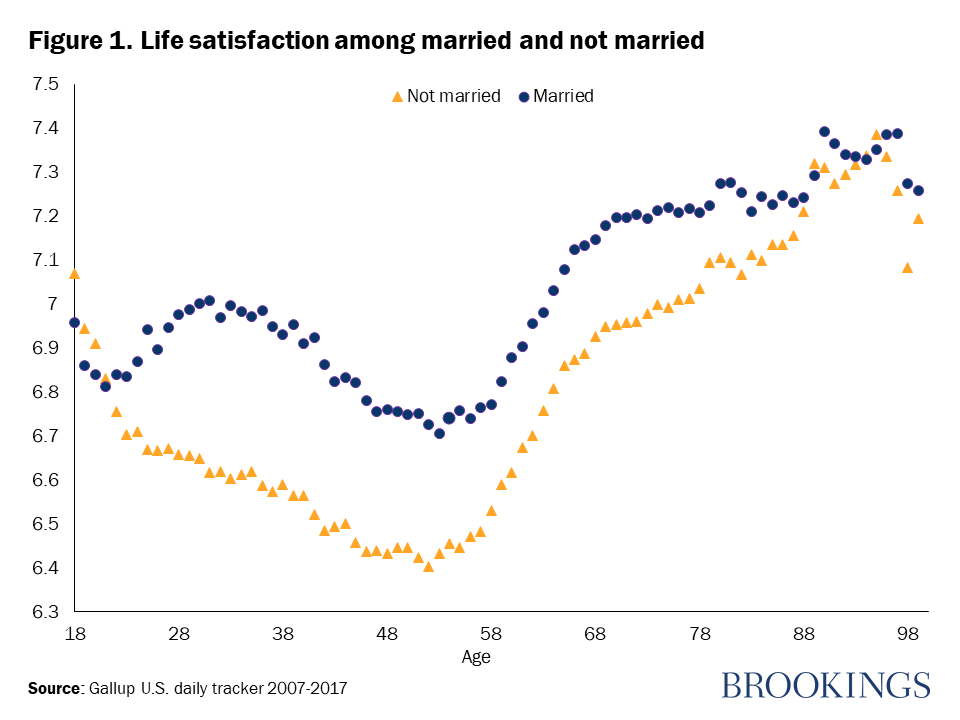
Life satisfaction in the U.S. follows a U-shape during working age, from 18 through retirement, with a mid-life low in the mid-40s, as in most countries (Figure 1). This is especially clear when controls are included and for those who are unmarried even without controls. The U.S. is different, not least as it has higher marriage rates, lower mean age at first marriage, and higher divorce rates than other advanced countries. The young married in the U.S. also experience a decline in well-being from around age 30 to midlife but that is preceded by a slight uptick to around age 30. Well-being rises for both the married and the unmarried, with and without controls from there to normal retirement age around age 65.
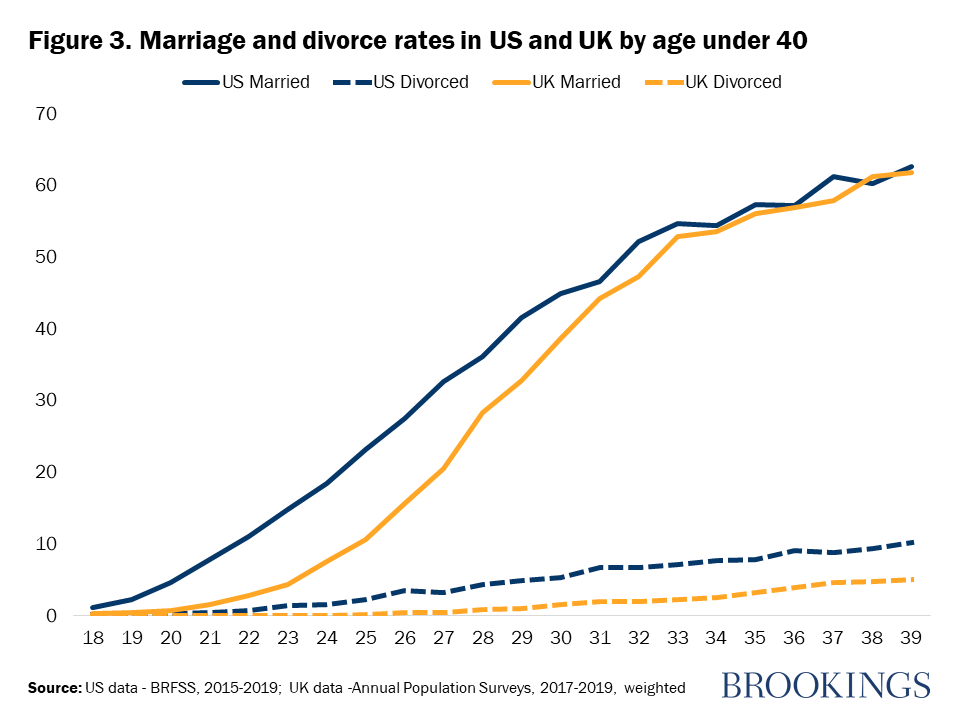
The differences that we find across the married and the unmarried in the U.S., with larger gaps between them and a steeper drop in mid-life for the unmarried than in countries of comparable income levels is a little-known finding. While we cannot fully explain this, we think it is due to the strong marriage norms in the U.S., which result in people getting married earlier—but also in divorcing more later (Figure 2). Part of this reflects the large inequalities in income and education in the U.S., as wealthier and more educated people are more likely to stay married, while less wealthy and educated people are more likely to divorce or to not marry (Figure 3).

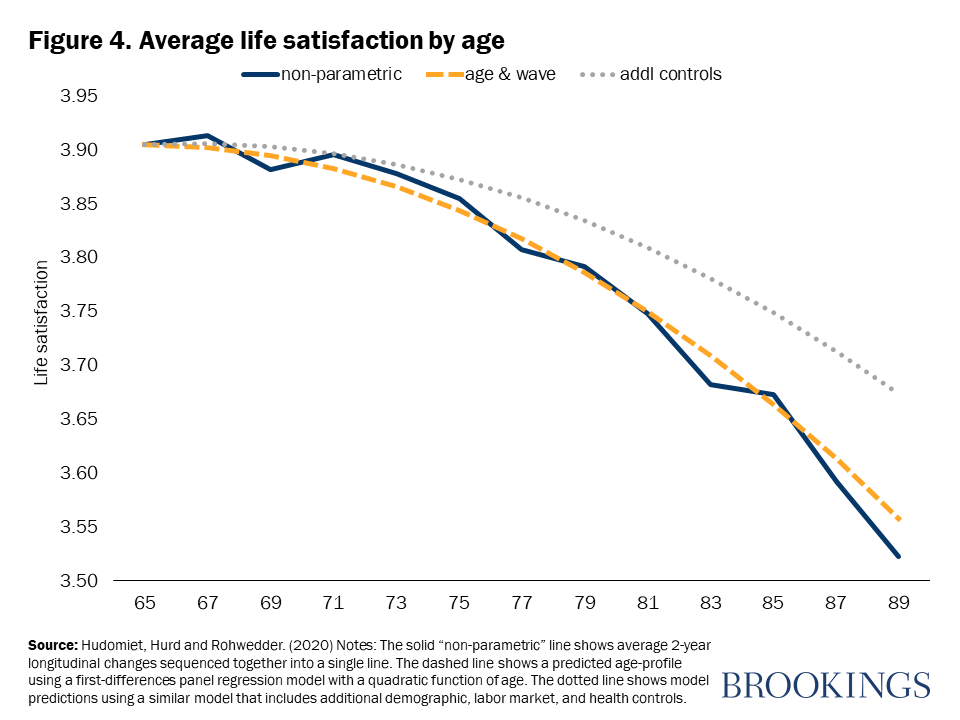
The evidence in our paper on the well-being of the old (over 70) confirms our priors about the role of selection bias, with happy people more likely to live longer. Once adjustments are made for differential mortality rates, with those with lower well-being likely to die early, life satisfaction begins to decline in the 70s, particularly after age 80, in large part driven by widowhood and health shocks (Figure 4). The direction of causality is not clear, given that poor health or other life shocks lower well-being across the life cycle. Yet the new evidence shows that higher levels of well-being ex ante predict longevity. Once again, the inclusion of well-being data in our official surveys will help us understand these patterns and what could be done to enhance both well-being and longevity.
Beyond being empirically interesting, the relationship between aging and well-being has implications for substantial parts of the world’s population. These dips in well-being are associated with higher levels of depression, including chronic depression, difficulty sleeping, and even suicide. In the U.S., deaths of despair are most likely to occur in the middle-aged years, and the patterns are robustly associated with unhappiness and stress. Across countries, chronic depression and suicide rates peak in midlife. The midlife dip in well-being is robust to within-person analysis, also exists with the prescribing of antidepressants, and extends beyond humans. Well-being is also a factor in differential mortality rates among the old. The relationship between aging and well-being applies to most of the world’s population and links to behaviors and outcomes that merit the attention of scholars and policymakers alike.
Related Content


Authors

The Brookings Institution is committed to quality, independence, and impact.
We are supported by a diverse array of funders. In line with our values and policies, each Brookings publication represents the sole views of its author(s).


Commentary
Happiness and aging in the US: Why it is different from other places and why it matters
December 7, 2020