
This post updates with year-end 2023 data the External Wealth of Nations database [Excel download], which assembles data on external claims and liabilities of economies around the world. The database is described in more detail in a series of papers (Lane and Milesi-Ferretti 2001, 2007, 2018), and in a companion post. The data are annual for the period 1970-2023 and cover 212 countries and territories, plus the euro area and the Eastern Caribbean Currency Union (ECCU). The data update to 2023 is currently available for over 160 economies (plus the euro area and the ECCU), including the 75 largest. The data are updated at regular intervals. The 2023 update will be completed for the entire sample at the end of 2024.
The update of the External Wealth of Nations (EWN) database with end-2023 data underscores that the most notable macroeconomic development affecting global creditor and debtor positions was the recovery in global stock prices (up by 20%), after their sharp decline during 2022. This boosted the creditor positions of countries with large holdings of foreign equity (for instance, countries with large sovereign wealth funds, such as Norway and the United Arab Emirates) and the liability positions of countries for which nonresident holdings of domestic equities are large (including the U.S.).
The EWN database, now maintained by the Hutchins Center on Fiscal & Monetary Policy at the Brookings Institution, provides estimates of each country’s external financial assets and liabilities, divided into different categories: foreign direct investment, portfolio investment (in stocks and bonds), other investment, financial derivatives, and foreign exchange reserves. These data also yield estimates of each country’s net international investment position (NIIP), the difference between its total external financial assets and its total external liabilities.
The database has been extended to include 2023 data for over 160 countries, representing over 99% of global GDP. Statistics for the remaining countries will be updated at the end of 2024 as more data become available.
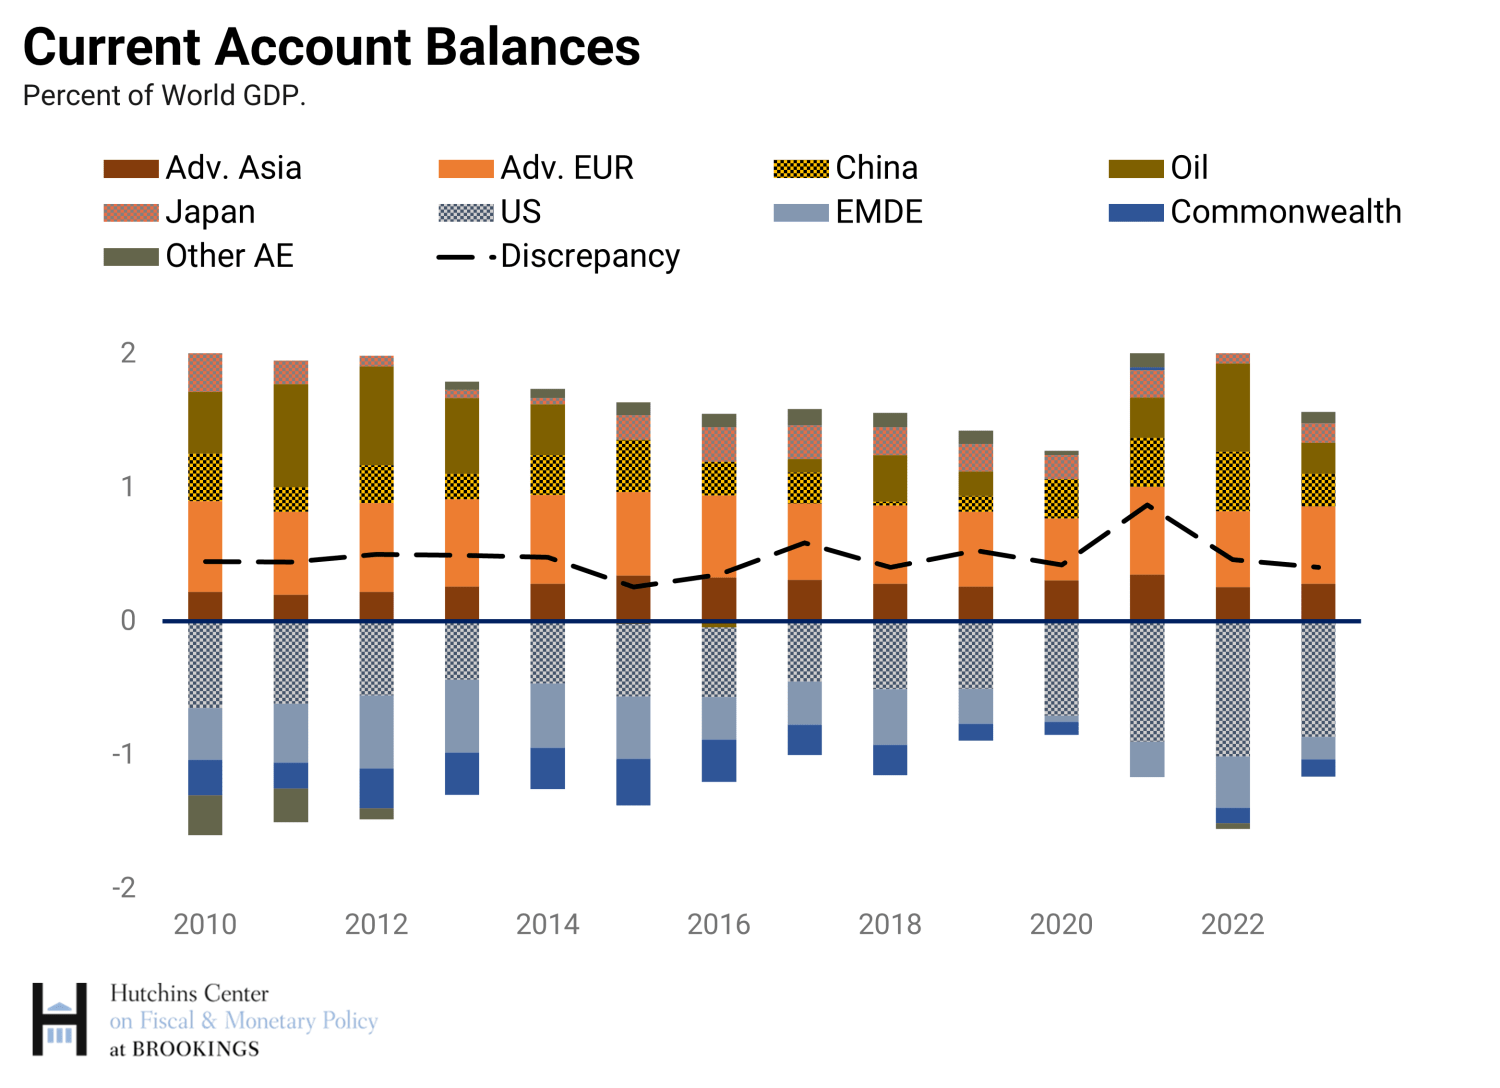
Among other factors driving external positions, current account imbalances, which measure net borrowing and lending and hence contribute to global creditor and debtor positions, declined in 2023 relative to 2022 (see figure below), primarily because of falling energy prices. And relatively high inflation contributed again to lower creditor and debtor positions in relation to GDP by increasing the denominator of the ratio, tempering the impact of higher equity valuations.
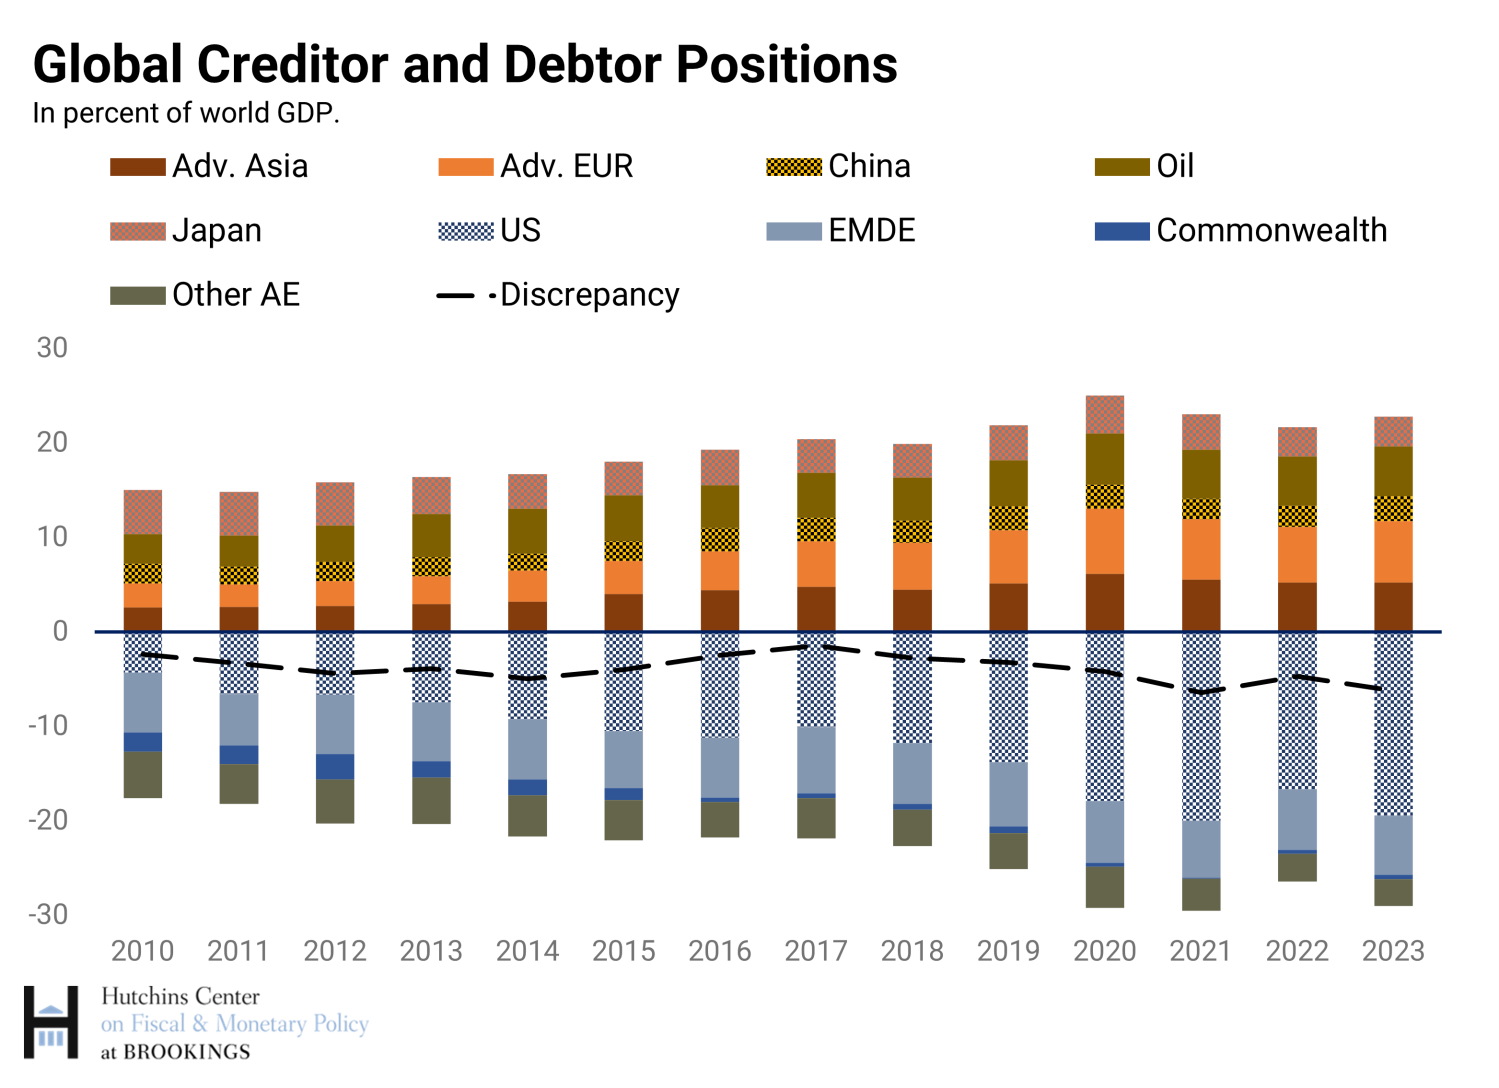
As a result of these developments, the U.S. net liability position at end-2023 exceeded $20 trillion (excluding gold holdings), or 75% of U.S. GDP. There was a corresponding increase in net external assets of the main creditor countries and region—in particular, advanced Europe, advanced Asia, oil exporters, and China (below figure). The statistical discrepancy between estimates of global external assets and liabilities grew again. The discrepancy is correlated with stock prices, given that estimates of global portfolio equity assets fall short of those of portfolio equity liabilities (see my “Missing Assets” piece here), and is also affected by differences across countries in the methodology adopted for estimating the market value of foreign direct investment, or FDI (see my “Many Creditors, One Large Debtor” piece here).
The figure below provides an alternative presentation of major global creditor positions for four groups of creditors:
- China, Hong Kong, and Macau;
- Advanced Asia (Japan, Korea, Singapore, and Taiwan);
- Advanced Europe (Austria, Belgium, Denmark, Germany, Netherlands, Norway, Sweden, and Switzerland);
- Gulf states (Kuwait, Qatar, Saudi Arabia, and United Arab Emirates).
On the debtor side, it presents data for:
- The United States;
- Emerging and developing economies (excluding China and major oil exporters);
- Euro Area debtors (France, Greece, Ireland, Portugal, and Spain).
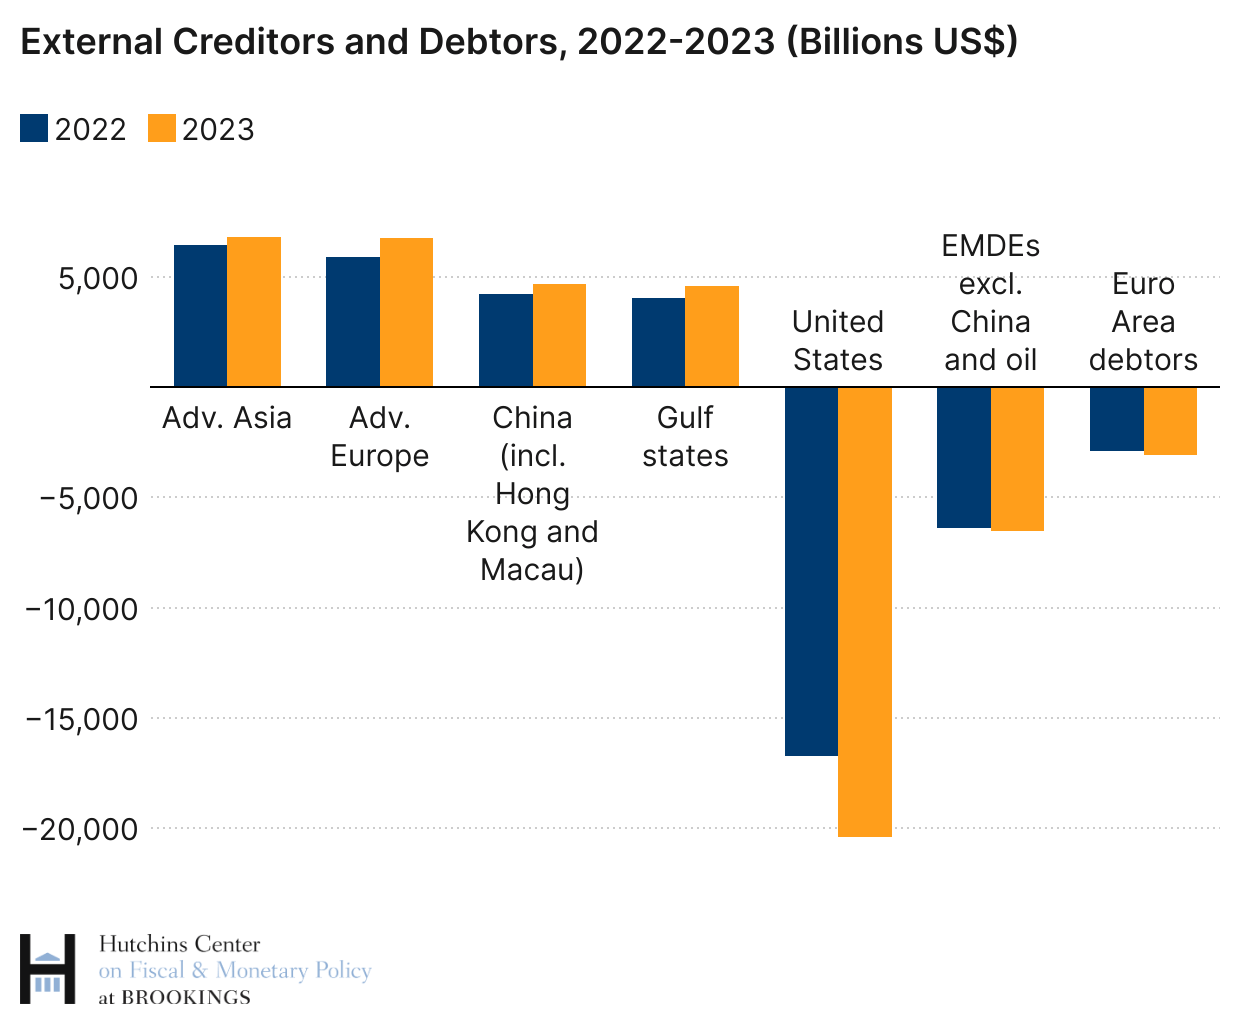
Both advanced Asia and advanced Europe had creditor positions of around $6.8 trillion at the end of 2023, while greater China and Gulf states had creditor positions exceeding $4.5 trillion (with substantial uncertainty surrounding the figure for Gulf states, given the paucity of statistics on their external assets and liabilities).
On the debtor side, the position of the United States is by far the largest compared to the other country groupings, both in absolute terms and as a ratio of domestic GDP. As discussed in the “Many Creditors, One Large Debtor” paper as well as in this blog (“How inflation, falling stock prices, and energy prices affected external balances in 2022”), valuation changes have been instrumental in driving U.S. liabilities higher, as rapidly rising U.S. equity prices have increased U.S. portfolio equity liabilities (nonresident holdings of U.S. shares) and also the Bureau of Economic Analysis estimates of the value of FDI in the United States. But in parallel to the rising value of net equity liabilities, U.S. borrowing to finance current account deficits has occurred mostly through large nonresident purchases of U.S. bonds ($1.1 trillion in 2023). This has implied a worsening net position in debt instruments as well, even though moderated by higher long-term interest rates after COVID which have reduced the value of outstanding U.S. bonds.
The EWN database contains information on smaller economies as well. The median net international investment position for the largest 20 emerging market economies at the end of 2023 (excluding China and the major oil exporters mentioned above) was around -33% of GDP. But there are economies with much larger exposures in relation to GDP. Among them are some countries in the Middle East and North Africa: Egypt, Jordan, Lebanon, and Tunisia, the first three of which are particularly affected by the turmoil in the region, and all heavily reliant on tourism as a source of foreign revenues. The statistics shown in this table paint a sobering picture, with a particularly dramatic situation in Lebanon, but net external liabilities exceeding 100% of GDP in Jordan and Tunisia as well.
Author
Related Content


-
Acknowledgements and disclosures
The Brookings Institution is financed through the support of a diverse array of foundations, corporations, governments, individuals, as well as an endowment. A list of donors can be found in our annual reports published online here. The findings, interpretations, and conclusions in this report are solely those of its author(s) and are not influenced by any donation.
The Brookings Institution is committed to quality, independence, and impact.
We are supported by a diverse array of funders. In line with our values and policies, each Brookings publication represents the sole views of its author(s).