
Executive Summary
State investments in center-based school readiness programs for preschoolers (pre-K), whether targeted for poor children or universally implemented, have expanded more rapidly than evaluations of their effects. Given the current interest and continuing expansion of state funded pre-K, it is especially important to be clear about the nature of the available evidence for the effectiveness of such programs. Despite widespread claims about proven benefits from pre-K, there is actually strikingly little credible research about the effectiveness of public pre-K programs scaled for statewide implementation.
Like many states that became interested in scaling up a state funded pre-K program in the early 2000’s, voluntary pre-K (TNVPK) was introduced in Tennessee in 1996 as a way to provide academic enhancement to economically disadvantaged children. It expanded in 2005 to an $85 million-plus statewide investment serving 18,000 Tennessee income-eligible children in 935 classrooms across all 95 counties.
Launched in 2009, the TNVPK Effectiveness Study, a coordinated effort between Vanderbilt’s Peabody Research Institute and the Tennessee Department of Education, is a five-year evaluation study funded by the US Department of Education, Institute for Education Sciences. It includes the first randomized control trial of a scaled up state funded pre-K program and the first well-controlled comparison group study of the effects of program participation as children progress through elementary school..
Policymakers and proponents often cite some of the famous early studies of pre-K programs that have shown long term benefits extending into adulthood for the participating children. But those were studies of especially complex programs that are unlike scaled-up public pre-K in many ways. The Vanderbilt study is the first rigorous controlled longitudinal study to be conducted on a large-scale state-funded pre-K program.
This report presents findings from the full evaluation report, available online, summarizing the longitudinal effects of TNVPK on pre‐kindergarten through third grade achievement and behavioral outcomes for a sample of 1076 children, of which 773 attended TNVPK classrooms and 303 did not. Both groups have been followed since the beginning of the pre‐k year. Children in VPK classrooms made initial strong gains and were perceived by their teachers at kindergarten entry as being better prepared. The achievement of the control children caught up to that of the pre-K children by the end of kindergarten. In second and third grades achievement trends crossed over, with academic achievement for the pre-K children becoming worse than for the control children.
The results from this substudy are reviewed in the context of the difficulties of determining the sustained effectiveness of statewide pre-K programs when those programs have been defined so differently state to state and when the evidentiary base from other current studies is so weak.
Results from the TNVPK evaluation
In 2009, Vanderbilt University’s Peabody Research Institute, in coordination with the Tennessee Department of Education’s Division of Curriculum and Instruction, initiated a rigorous, independent evaluation of the state’s Voluntary Prekindergarten program (TNVPK). TNVPK is a full‐day prekindergarten program for four‐year‐old children expected to enter kindergarten the following school year and whose family income qualified for free or reduced price lunch.i
The TNVPK classrooms participating in the evaluation study were among those where more eligible children were expected to apply for the program than there were seats available. Under such circumstances, only some applicants can be admitted and, of necessity, some must be turned away. The participating programs agreed to make this decision on the basis of chance. The classrooms are spread across the state in both urban and rural districts.
This procedure was used for two cohorts of children, TNVPK applicants for the 2009‐10 and 2010‐11 school years, and resulted in more than 3000 randomly assigned children. Both the children who participated in TNVPK and those who did not are being tracked through the state education database, and information on various aspects of their academic performance and status is being collected each year. State achievement test data will be available for the first time on this larger sample in late fall of 2015.
In addition, parental consent was obtained for a portion of this randomized sample, referred to as the “Intensive Substudy.” A total of 1076 children in this intensive substudy were directly assessed by the research team with a battery of early learning achievement measures and rated by their teachers on important “non-cognitive” skills in each year of the study through the end of 3rd grade. As four year olds, the 303 children in the control group were primarily cared for in their homes; only 25.6% of them participated in a formal preschool program, none in a TNVPK classroom.
Because of differences in consent rates by parents in the treatment and control conditions for participation of their children in the intensive substudy, the results presented here and in our most recent report are analyzed by comparing children who did vs. did not attend a TNVPK classroom for at least 20 days, thereby assigning control group status to children who won the lottery for admission to TNVPK but did not participate in the program or only did so for a few days. The availability of pre-test data for all the intensive substudy children on the same cognitive measures used to assess later outcomes allows us to successfully address the major threat to the interpretation of the results from this particular analytic approach, the possibility that the children in the two groups differed in cognitive skills or socioeconomic status at the beginning of the pre-K year: Small differences were detected on only two variables, about what would have been expected by chance given the number of variables involved. These were controlled for statistically.
At the end of pre‐K, the TNVPK children had significantly higher achievement scores on all six subtests administered (representing literacy, language and mathematics, all from the Woodcock Johnson III battery, a widely used achievement test with strong psychometric properties). The largest effects were on the two literacy outcomes. To allow results from programs to be compared, they are most often presented as “effect sizes,” a measure that quantifies the difference between two groups. The effect size comparing TNVPK children to controls on a composite achievement measure was .32; a moderate and significant effect.
At the beginning of kindergarten, the teachers rated the TNVPK children as being significantly better prepared for kindergarten work, as having significantly better behaviors related to learning in the classroom and as having significantly more positive peer relations than the control children. They did not view the children as having more behavior problems and both groups of children were rated as being highly positive about school.
Our design allows us to investigate the extent to which these initial effects are sustained past the end of the pre-K year. More than 90% of the sample remained in the study across the four years. Detailed information is provided in the full report.ii
Standard score results from pre-K through 3rd grade on a composite measure that averaged the six achievement subtests are presented from baseline forward in the graph below.
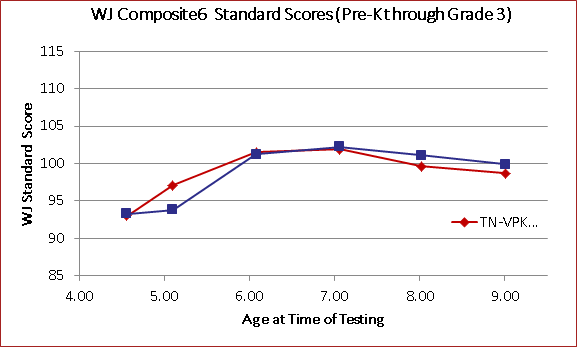
As is evident, pre-K and control children started the pre-K year at virtually identical levels. The TNVPK children were substantially ahead of the control group children at the end of the pre-K year (age 5 in the graph). By the end of kindergarten (age 6 in the graph), the control children had caught up to the TNVPK children, and there were no longer significant differences between them on any achievement measures. The same result was obtained at the end of first grade using two composite achievement measures (the second created with the addition of two more WJIII subtests appropriate for the later grades). In second grade, however, the groups began to diverge with the TNVPK children scoring lower than the control children on most of the measures. The differences were significant on both achievement composite measures and on the math subtests. Differences favoring the control persisted through the end of third grade.
In terms of behavioral effects, in the spring the first grade teachers reversed the fall kindergarten teacher ratings. First grade teachers rated the TNVPK children as less well prepared for school, having poorer work skills in the classrooms, and feeling more negative about school. It is notable that these ratings preceded the downward achievement trend we found for VPK children in second and third grades. The second and third grade teachers rated the behaviors and feelings of children in the two groups as the same; there was a small positive finding for peer relations favoring the TNVPK children by third grade teachers, which did not meet traditional levels of statistical significance.
Responding to criticisms of the TNVPK study
These results are not consistent with the widely held expectations for the academic benefits of statewide public pre-K programs. The virtual ink on our recently released report was barely dry before pre-K advocates were vigorously building a firebreak around these results from Tennessee, contending that they are not representative of the effects of state pre-K programs generally and stem entirely from the unusually poor quality of the Tennessee program.
In response to critics, we note first that the kindergarten catch up phenomenon in the TNVPK program was also seen in the Head Start Impact study, although that study did not find negative effects in later gradesiii, and this “fade out” of achievement effects is a well-known pattern.
Second, it is important to remember that the initial positive TNVPK effects at the end of the pre-K year and at kindergarten entry were comparable to those found in studies of other programs reported since the 1980s, as shown in a comprehensive meta-analysis.iv In particular, the effect sizes were well within the range of those reported using a weaker design in a recent analysis of the end of pre-K effects for five state pre-K programs.v and, indeed, on average were larger than the effects found for some of those states. The positive effects on TNVPK participants at the end of the pre-K year and their similarity in size to the reported effects of other programs that have been lauded by pre-K advocates are inconsistent with the claim by those advocates that the TNVPK program was of unusually poor quality.
Third, we can find no evidence that the TNVPK program is different in any significant way from other programs being ramped up quickly in various states. TNVPK was set up to align with the 10 benchmarks provided by the National Institute for Early Education Research (NIEER); it meets 9, all except the one requiring the teacher’s assistant to have a particular credential, the CDA.vi It meets many more of these benchmarks than the programs in states like Florida, Texas and Massachusetts and more than Louisiana and New Mexico.
Moreover, a different component of the overall study obtained classroom ratings on typical measures used to index classroom quality in many other studies of pre-K programs (e.g., Early Childhood Environmental Rating Scale; Early Childhood Language and Literacy Observation) for 160 representative TNVPK classrooms across the state. TNVPK classroom average scores are very similar to those recently reported for the statewide program in New Mexicovii and almost identical to ones from the highly touted metropolitan pre-K program in the Boston Public Schools. viii
While we believe TNVPK has ample room for improvement, there is simply no convincing evidence that it is a program of distinctly lower overall quality than other statewide programs.
Historical support for pre-K effectiveness
These results clearly challenge the widespread belief that statewide pre-K can deliver sustained improvements in the academic achievement of economically disadvantaged children and help close the achievement gap for those children. If we are to understand what state pre-K may realistically be able to accomplish, and how to get the greatest benefit from it, we need to think critically about where those beliefs came from and how applicable they are to contemporary state pre-K programs.
The most influential sources are the highly cited early experimental studies of 50 or more years ago. The Perry Preschool, for instance, consisted of 2½ hours every morning in instruction and a 1½-hour weekly visit with each family in the afternoons – for two years, starting when the children were 3 years old. The Abecedarian program is even harder to replicate. Children entered the program as infants and remained until they went to kindergarten. The program ran 50 weeks a year for 8-10 hours a day. There was a pediatrician and nurse practitioner on site.
Even the Child and Parent Center (CPC) program in Chicago, often cited as a more recent example of long-term benefits, is unlike today’s pre-K.ix Children were enrolled as 4 year olds and remained through kindergarten after which there was follow up through 3rd grade. Parents were provided workshops and were required to volunteer in the classrooms. In addition, the classrooms were supplemented with free health care.
Perry, Abecedarian and CPC all showed long-term benefits for societally valued outcomes such as completing high school on time, earning higher wages and in some instances committing fewer crimes. There are no such long term follow ups available, of course, from the more recently instituted scaled up state programs. For the TNVPK sample we have funding from NICHD to examine some potential mechanisms for these longer-term outcomes, interviewing students, teachers and their parents in the 4th through 7th grades. We simply don’t know at this point if such outcomes will emerge as “sleeper effects.”
It is important to note, though, that early childhood advocates and policy makers use the term “pre-K” as though it has a defined and clear meaning, and they use data from the early programs of 50 or more years ago to support claims of effectiveness for pre-K as if it is all the same. School districts and states may not be aware that many different kinds of programs are covered by the blanket term. All over the country, states are implementing different practices, some of which are quite distinct, all of which are called pre-K, and none of which are similar to the Perry, Abecedarian, or CPC programs.
Further, whatever the nature of the pre-K program, scaling up to statewide implementation involves practical and administrative challenges well beyond any addressed in these earlier programs, or any program implemented locally with administrative leadership within a single district. Tennessee has 135 separate school systems implementing some version of a pre-K program, and other statewide programs must implement across a similar numerical and geographical scope. Given these distinctive challenges, the critical evidence for judging the effectiveness and potential of statewide pre-K programs must come specifically from studies of statewide programs, not simply generalized from those implemented in single sites or school systems.
Current research on statewide pre-K programs
Prior to our TNVPK study, research on statewide implementation has all been with weaker designs that do not meet federal standards for drawing valid inferences about education program effectiveness.x Many of the earliest attempts were simply pre-post comparisons of children going through the program, and such evidence is still cited favorably by many programs. The age-cutoff regression discontinuity design (RDD) was introduced in 2005xi and has been applied widely ever since. RDD is one of the strongest non-experimental designs in general, but the age-cutoff version applied in pre-K studies, which involves comparing children who just made or missed the age eligibility for entry into pre-K and kindergarten, is a degraded version open to various sources of bias, many tending to overestimate effects.xii Nonetheless, as in the Tennessee study, these designs almost universally find nontrivial positive effects on achievement measures at the beginning of the kindergarten year.
Of critical interest, of course, is whether these positive effects are sustained through the early grades. On this matter the available evidence is especially weak. Looking only at evaluations of statewide pre-K programs, virtually all of the available research on sustained effects has used nonequivalent comparison designs that attempt to match retrospectively children who attended pre-K with children who did not attend. The key question for such matched designs, of course, is whether the children are matched adequately on all the variables that affect the outcomes independently from pre‐k participation. In practice, researchers have had difficulty making adequate matches as a result of limitations in the available data. With few exceptions, the variables on which these studies have matched children have included no more than basic demographic characteristics—mainly free and reduced price lunch status, age, gender, and race. Particularly problematic is the absence of pretest data for all children at baseline on the same or similar measures that are used to demonstrate later differences in outcomes that are associated with program participation. Thus the existing matching studies cannot demonstrate the equivalence of the intervention and comparison groups on the one thing that is most likely to bias the results.
In contrast to these matched studies, the Tennessee study created equivalence at baseline of the groups of pre-K participating and nonparticipating children in the intensive substudy that produced the results described here. All the children in both groups were from families who made an effort to get them enrolled in the state pre-K program. Further, the success of the parents in enrolling their children was determined largely by chance in the intensive substudy design. The intensive substudy sample required parental consent and both groups of families consented.
The critical question, however, is whether there were other differences between the TNVPK participants and nonparticipants that might influence their outcomes. We compared the groups on 22 baseline variables. These included all the basic demographic characteristics typically used in matched studies plus such family background features as mothers’ education, parents’ employment, and an index of the home literacy environment. Most important, it included pretest scores on all the achievement measures used as outcome variables, a critical point of comparison unavailable to any of the matching studies. Only two of any of these 22 variables showed statistically significant differences at baseline, again close to what would be expected by chance.
To further ensure that the groups were comparable statistical controls were used for both key baseline variables and some variation in the timing of pretest and posttest measurement. When those statistical controls were applied to the baseline variables, the groups were then virtually identical on every variable. No study is perfect, and this one is no exception, but any notion that the prior matched and RDD studies provide more methodologically credible evidence about pre-K effects than the Tennessee study simply ignores well-established protocols for judging the ability to draw causal conclusions about program impacts from different types of research designs.xiii
In short, despite claims that sustained achievement effects from state pre-K programs have been amply demonstrated, the evidence for that is quite thin and, prior to the Tennessee study, there had been no evidence from a well-controlled study.
Going forward
Developing a stronger and more current evidentiary base on scaling up pre-K is important because the shift to caring for 4 year olds in public schools is a relatively recent one based largely on faith that this is beneficial for the participating children. As these programs come under the administrative control of the public school system and are implemented in far-flung areas of a state, it is necessary to determine what the consequences are and what safeguards might need to be put into place. A clear, well-articulated vision for how the care of 4- and 5-year olds differs from that for older children is needed to protect these classrooms from becoming junior kindergartens. And a specific, perhaps new, definition is needed for “high quality.”
To many states, the term high quality has meant that they try to meet the 10 NIEER benchmarks, but those, as well as other structural characteristics of pre-K classrooms, have not been shown to be related to children’s growthxiv. There is a wide range of recent research evidence about experiences that foster cognitive and social-emotional development of 4-year-olds that could be pulled together into empirically based guidelines for pre-K. Until researchers and program administrators understand the need for this work, it is doubtful it will be done.
Even if a vision is developed, states will still have difficulty conveying and enacting that vision on a day-to-day basis in hundreds of classrooms. Central implementation and administration of the program entirely from a state department of education is not likely to be effective. Implementation standards must be set in policies that are then administered regionally to assure professional development, trained coaches, and fidelity of practice. Pre-k programs are “voluntary;” if states are going to offer them, it is important that structures be established to make them effective.
A clear vision for pre-K also means that states and school systems must have a coherent view for how pre-K aligns with the K-3 system. The TNVPK study was not just about pre-K; it was a pre-K through 3rd grade study. There is some as yet poorly understood interaction between the pre-K experience and the experience the children have in subsequent grades that fails to carry forward the momentum they gained in pre-K. State programs that are not careful to protect the instructional environment for 4-year-olds may find the children burning out in the early grades from too much repetition of the same content and instructional format. Rather than building enthusiasm for learning, confidence in their abilities and a foundational understanding of literacy and math, the programs may only be teaching children how to behave in school, an enthusiasm that fades with repeated exposure.
Conclusion
In sum, it would be shortsighted of pre-K advocates to dismiss the TNVPK study merely as an indictment of the quality of the Tennessee program. Rather the findings from this most methodologically rigorous study to date raise important questions about what is happening all over the country. The benefits of pre-K intervention are being pushed without taking time to define what pre-K really means and, worse, to determine whether what has been implemented has produced the promised outcomes. It is time to take a step back and to figure out what really can and should be scaled up and then how to make that vision happen with consistency and the desired results.
Even if we get the quality right, however, and implement a new vision of scaled up pre-K with consistency, and even if this results in children gaining more from pre-K than they have so far, we still need to question the presumption that pre-K alone will fix the problems poor children encounter in schools. The income-related achievement gap Reardonxv and others have identified does not exist solely because children do not have a pre-K experience or even a “high quality” pre-K experience. There are other important factors at play including increasing income segregation in the public schools and the low quality of schools serving the poor.
i. The evaluation was funded by a grant from the U. S. Department of Education’s Institute of Education Sciences (R305E090009).
ii. http://peabody.vanderbilt.edu/research/pri/VPKthrough3rd_final_withcover.pdf
iii. Puma, M., Bell, S., Cook, R., Heid, C., Broene, P., Jenkins, D., Mashburn, A. & Downer, J. (2012). Third grade follow-up to the Head Start Impact Study final report, OPRE Report # 2012-45, Washington, DC: Office of Planning, Research and Evaluation, Administration for Children and Families, U.S. Department of Health and Human Service
iv. Duncan, G. & Magnuson, K. (2013). Investing in preschool programs. The Journal of Economic Perspectives, 27, 109-131. dx.doi.Org/10.1257/jep.27.2.109.
v. Wong, V. C., Cook, T. D., Barnett, W. S., & Jung, K. (2008). An effectiveness-based evaluation of five state pre-Kindergarten programs. Journal of Policy Analysis and Management, 27, 122–154. doi:10.1002/pam.20310
vi. Barnett, S., Carolan, M., Squires, J., Brown, K., & Horowitz, M. (2014). The state of preschool 2014: State preschool yearbook. National Institute for Early Education Research (NIEER), Graduate School of Education, Rutgers, the State University of New Jersey.
vii. Husted, J., Barnett, W.S., Jung, K., & Goetz, L. (n.d.). The New Mexico PreK evaluation: Results from the initial four years of a new state preschool initiative. (Final Report). Rutgers, NJ: National Institute for Early Education Research.
viii. Weiland, C., Ulvestad, K., Sachs, J., & Yoshikawa, H. (2013). Associations between classroom quality and children’s vocabulary and executive function skills in an urban public prekindergarten program. Early Childhood Research Quarterly, 28, 199-209. http://dx.doi.org/10.1016/j.ecresq.2012.12.002.
ix. Reynolds, A., Temple, J, Robertson, D., White, R., & Ou, S-R (2011). Age 26 cost-benefit analysis of the Child-Parent Center early education program. Child Development, 82, 379-404. DOI: 10.1111/j.1467-8624.2010.01563.x
x. http://ies.ed.gov/ncee/wwc/pdf/reference_resources/wwc_procedures_v3_0_standards_handbook.pdf
xi. Gormley, W. T., Gayer, T., Phillips, D., & Dawson, B. (2005). The effects of universal pre-K on cognitive development. Developmental Psychology, 41, 872–884. doi:10.1037/0012-1649.41.6.872
xii. Lipsey, M., Weiland, C., Yoshikawa, H., Wilson, S., & Hofer, K. (2015). Prekindergarten age-cutoff regression-discontinuity design: Methodological issues and implications for application. Educational Evaluation and Policy Analysis, 37, 296-313. DOI: 10.3102/0162373714547266
xiii. http://ies.ed.gov/ncee/wwc/pdf/reference_resources/wwc_procedures_v3_0_standards_handbook.pdf
xiv. Mashburn, A., Pianta, R., Hamre, B., Downer, J., Barbarin, O., Bryant, D., …Howes, C. (2008). Measures of classroom quality in prekindergarten and children’s development of academic, language, and social skills. Child Development, 79, 732-749.
xv. Reardon, S. (2011). The widening academic achievement gap between the rich and the poor: New evidence and possible explanations. In G. Duncan & R. Murnane, (Eds). Whither opportunity: Rising inequality, schools, and children’s life chances. New York: Russell Sage Foundation.
The Brookings Institution is committed to quality, independence, and impact.
We are supported by a diverse array of funders. In line with our values and policies, each Brookings publication represents the sole views of its author(s).