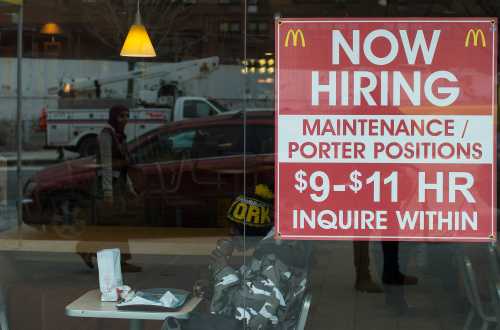
Following the 2016 presidential election, much of the analysis has focused on the role of white working-class voters in rural areas or small towns, with varying degrees of attention to their economic woes and racial isolation. The white population is indeed more varied than indicated by top-line comparisons of socioeconomic status by race, which typically show that whites have higher education levels and earnings than blacks and Latinos.
Broad-brush descriptions by race are often a useful shortcut to understanding societal patterns, but they can be limiting. There is variance within any group of people, and moreover, there is variance by place, both within and across races. To unpack this complexity, we reviewed employment data by race in the nation’s largest local jurisdictions—cities and counties with populations over 500,000. These 130 places account for about half of the nation’s population and include big cities (New York City, Chicago, Los Angeles), smaller cities (Nashville, TN; Louisville, KY), dense urbanized counties (Alameda, CA; Fulton, GA), and places with a small-town or rural feel (Stanislaus County, CA; Lancaster County, PA). In other words, although they all pass the 500,000-population threshold, they encompass a diversity of places and are not limited to large urban areas. Jump to interactive data↴
As we have written previously, 72 percent of working-age adults have a job nationally, but that figure varies widely by jurisdiction, from 51 percent in Detroit up to 83 percent in Johnson County, Kan., outside of Kansas City. Places with the lowest employment rates overall include those struggling with deindustrialization, the after-effects of housing bust and depressed consumer spending; and more generally with economic shifts favoring technology, innovation, and professional services. They include jurisdictions that are majority black (Detroit and Baltimore), Latino (Hidalgo County, Texas, the Bronx in New York City, and Kern and Fresno counties in California’s central valley), and white (Lee, Polk, and Brevard counties, all in Florida).
Table 1. Jurisdictions with the highest and lowest employment rates overall, 2015
| Jurisdiction | Employed share of working-age population, total | Total population |
|---|---|---|
| Johnson County, KS | 83% | 580,200 |
| Hennepin County, MN | 82% | 1,222,886 |
| Seattle, WA | 81% | 684,577 |
| Montgomery County, MD | 80% | 1,039,816 |
| Anne Arundel County, MD | 80% | 564,752 |
| Douglas County, NE | 80% | 550,366 |
| Fairfax County, VA | 79% | 1,180,256 |
| San Francisco, CA | 79% | 864,772 |
| Denton County, TX | 79% | 780,362 |
| Nashville, TN | 79% | 678,096 |
| Kent County, MI | 78% | 636,037 |
| St. Louis County, MO | 78% | 1,004,025 |
| Montgomery County, PA | 78% | 819,060 |
| Travis County, TX | 78% | 1,177,894 |
| Denver, CO | 78% | 711,111 |
| Pima County, AZ | 68% | 1,009,377 |
| Brevard County, FL | 68% | 568,140 |
| Polk County, FL | 67% | 650,324 |
| Lee County, FL | 67% | 701,529 |
| San Bernardino County, CA | 67% | 2,129281 |
| Riverside County, CA | 66% | 2,361,573 |
| Fresno County, CA | 66% | 973,514 |
| Kern County, CA | 65% | 880,536 |
| Baltimore, MD | 65% | 622,111 |
| San Joaquin County, CA | 65% | 726,209 |
| Philadelphia, PA | 64% | 1,567,071 |
| The Bronx, New York City | 64% | 1,455,667 |
| Stanislaus County, CA | 63% | 538,021 |
| Hidalgo County, TX | 62% | 842,623 |
| Detroit, MI | 51% | 657,307 |
As the interactive shows, there is considerable variation by race, and not surprisingly, racial employment patterns generally track overall employment patterns. A deeper look, however, shows that the interplay between race, geography, and the economy produces some notable variations in racial employment rates by place, with the most dramatic differences among blacks and whites.
Table 2. Jurisdictions with the highest and lowest employment rates among whites, 2015
| Jurisdiction | Employed share of working-age population, whites | Employed share of working-age population, total | Share of working-age population that is white | Total population |
|---|---|---|---|---|
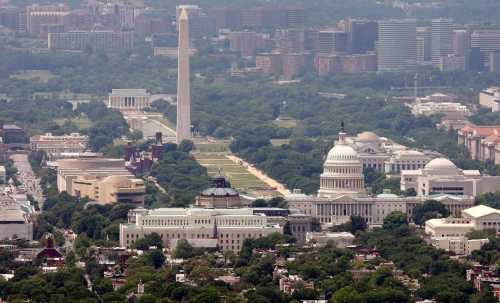
| Washington, DC | 88% | 76% | 40% | 672,228 |
| Manhattan, New York City | 85% | 77% | 48% | 1,644,184 |
| Seattle, WA | 85% | 81% | 67% | 684,577 |
| San Francisco, CA | 84% | 79% | 43% | 864,772 |
| Hennepin County, MN | 83% | 82% | 71% | 1,222,886 |
| Johnson County, KS | 83% | 83% | 81% | 580,200 |
| Chicago, IL | 83% | 70% | 34% | 2,656,349 |
| Douglas County, NE | 82% | 80% | 73% | 550,366 |
| Denver, CO | 82% | 78% | 57% | 711,111 |
| Boston, MA | 82% | 76% | 47% | 669,595 |
| Ramsey County, MN | 82% | 77% | 65% | 538,736 |
| DeKalb County, GA | 82% | 74% | 28% | 704,031 |
| Nashville, TN | 82% | 79% | 58% | 678,096 |
| Fresno County, CA | 68% | 66% | 31% | 973,514 |
| Polk County, FL | 68% | 67% | 60% | 650,324 |
| Hidalgo County, TX | 68% | 62% | 5% | 842,623 |
| Brevard County, FL | 68% | 68% | 75% | 568,140 |
| El Paso, TX | 68% | 69% | 13% | 673,887 |
| San Bernardino County, CA | 67% | 67% | 30% | 2,129,281 |
| Lee County, FL | 67% | 67% | 66% | 701,529 |
| Kern County, CA | 65% | 65% | 37% | 880,536 |
| Riverside County, CA | 65% | 66% | 35% | 2,361,573 |
| Stanislaus County, CA | 62% | 63% | 44% | 538,021 |
| Detroit, MI | 61% | 51% | 10% | 657,307 |
Employment rates among whites tend to be highest in cities, consistent with white population growth in those areas. These cities include Washington, Seattle, and the borough of Manhattan. Non-coastal cities also appear, such as Chicago, Hennepin County, Minn. (encompassing Minneapolis), and Denver. While whites make up the plurality or majority of the populations in most of these places, they are also home to sizable black, Latino, and Asian populations.
The places with the lowest rates of white employment cluster in the Sunbelt region, stretching from California’s central valley through Texas to Florida, as well as Detroit in the Midwest. The majority are counties rather than cities, and on the whole, they are not among the nation’s most densely developed places or parts of the largest metropolitan areas (excluding Detroit and San Bernardino and Riverside counties in California). Although three of these places are majority white (all in Florida), in other places the white population is disproportionately small, and overall these places have relatively large Latino populations, excepting Detroit, which is majority black.
Table 3. Jurisdictions with the highest and lowest employment rates among blacks, 2015
| Jurisdiction | Employed share of working-age population, blacks | Employed share of working-age population, total | Share of working-age population that is black | Total population |
|---|---|---|---|---|
| Essex County, MA | 87% | 77% | 3% | 753,126 |
| Johnson County, KS | 86% | 83% | 5% | 580,200 |
| Bristol County, MA | 84% | 74% | 3% | 583,402 |
| Snohomish County, WA | 84% | 76% | 3% | 772,208 |
| Ventura County, CA | 83% | 74% | 2% | 850,494 |
| Denton County, TX | 82% | 79% | 10% | 780,362 |
| Fairfax County, VA | 81% | 79% | 9% | 1,180,256 |
| Bergen County, NJ | 81% | 75% | 5% | 938,203 |
| Baltimore County, MD | 80% | 78% | 28% | 830,630 |
| Collin County, TX | 80% | 78% | 10% | 913,891 |
| Montgomery County, PA | 80% | 78% | 9% | 819,060 |
| Kane County, IL | 59% | 77% | 5% | 530,107 |
| Passaic County, NJ | 59% | 70% | 11% | 510,795 |
| Summit County, OH | 59% | 74% | 14% | 542,794 |
| Baltimore, MD | 58% | 65% | 60% | 622,111 |
| San Joaquin County, CA | 57% | 65% | 7% | 726,209 |
| Philadelphia, PA | 57% | 64% | 40% | 1,567,071 |
| Chicago, IL | 56% | 70% | 29% | 2,656,349 |
| Kern County, CA | 53% | 65% | 5% | 880,536 |
| Fresno County, CA | 53% | 66% | 5% | 973,514 |
| San Francisco, CA | 53% | 79% | 4% | 864,772 |
| Detroit, MI | 50% | 51% | 79% | 657,307 |
Places with the highest rates of black employment are all suburban counties, and most have small black populations below the national average of 12 percent. With one exception (Ventura County, Calif.), all are majority white. About half are in the mid-Atlantic and New England regions, with the rest scattered throughout the country in Texas, California, and Kansas. A few abut central cities with some of the lowest employment rates for blacks. For instance, both Baltimore County and Montgomery County, Pa., have black employment rates of 80 percent, compared to rates below 60 percent in neighboring Baltimore and Philadelphia, respectively. These two cities are among the most racially segregated in the country and have high levels of concentrated poverty (neighborhoods where at least two of every five people are poor). As our colleague William Frey has shown, the Baltimore and Philadelphia regions are experiencing some of the largest increases in the suburban black population, as are the Washington and Dallas regions, both of which also have high black employment rates in suburban jurisdictions. Frey notes that black suburbanization appears to be similar to white suburbanization, in that those moving to the suburbs of both races are younger, have higher levels of education, and tend to be married couples with children.
In addition to the stark city-suburb disparities within the black population, the data also show sharp black-white disparities within the same city. Chicago and San Francisco post some of the lowest black employment rates (56 percent and 53 percent, respectively), as well as the highest white employment rates (83 percent and 84 percent). Washington and Manhattan also show large black-white employment gaps. The two places have the highest and second highest rates of white employment (88 and 85 percent, respectively), compared to 64 and 62 percent for blacks, a difference of over twenty percentage points.
Table 4. Jurisdictions with the highest and lowest employment rates among Latinos, 2015
| Jurisdiction | Employed share of working-age population, Latinos | Employed share of working-age population, total | Share of working-age population that is Latino | Total population |
|---|---|---|---|---|
| Fairfax County, VA | 84% | 79% | 17% | 1,180,256 |
| Johnson County, KS | 83% | 83% | 7% | 580,200 |
| Jefferson County, AL | 83% | 72% | 4% | 660,136 |
| Nashville, TN | 82% | 79% | 9% | 678,096 |
| Baltimore County, MD | 82% | 78% | 5% | 830,630 |
| Portland, OR | 82% | 77% | 8% | 626,857 |
| DuPage County, IL | 82% | 78% | 14% | 933,366 |
| Snohomish County, WA | 81% | 76% | 9% | 772,208 |
| Ocean County, NJ | 81% | 75% | 10% | 588,338 |
| Hennepin County, MN | 81% | 82% | 6% | 1,222,886 |
| Salt Lake County, UT | 81% | 78% | 17% | 1,107,424 |
| Stanislaus County, CA | 64% | 63% | 44% | 538,021 |
| Pierce County, WA | 63% | 69% | 9% | 845,642 |
| The Bronx, New York City | 63% | 64% | 56% | 1,455,667 |
| Monroe County, NY | 63% | 75% | 8% | 750,191 |
| Cuyahoga County, OH | 63% | 71% | 6% | 1,255,884 |
| Camden County, NJ | 63% | 74% | 15% | 510,308 |
| Bristol County, MA | 62% | 74% | 6% | 583,402 |
| Hidalgo County, TX | 62% | 62% | 93% | 842,623 |
| Philadelphia, PA | 58% | 64% | 13% | 1,567,071 |
| Detroit, MI | 53% | 51% | 8% | 657,307 |
Similar to blacks, the employment rates of Latinos are also typically highest in counties and in places where they make up a disproportionately small share of the population (except for Fairfax County, Va., and Salt Lake County, Utah, where Latinos account for 17 percent of the population, equal to the national average). They are scattered geographically throughout the country, and all either represent urban cores or abut major metropolitan centers. Jurisdictions with the lowest Latino employment rates are also scattered, but include more cities like Cleveland (in Cuyahoga County), the Bronx in New York City, Philadelphia, and Detroit, as well as counties with a historic agricultural base and higher-than-average Latino population such as Stanislaus County in California’s Central Valley (44 percent Latino) and Hidalgo County in southern Texas (93 percent Latino).
Table 5. Jurisdictions with the highest and lowest employment rates among Asians, 2015
| Jurisdiction | Employed share of working-age population, Asians | Employed share of working-age population, total | Share of working-age population that is Asian | Total population |
|---|---|---|---|---|
| Ocean County, NJ | 93% | 75% | 3% | 588,338 |
| Anne Arundel County, MD | 86% | 80% | 5% | 564,752 |
| Washington, DC | 82% | 76% | 5% | 672,228 |
| Jefferson County, AL | 80% | 72% | 2% | 660,136 |
| Montgomery County, MD | 80% | 80% | 16% | 1,039,816 |
| Hennepin County, MN | 79% | 82% | 8% | 1,222,886 |
| New Castle County, DE | 79% | 76% | 6% | 556,354 |
| Lake County, IL | 78% | 77% | 7% | 704,329 |
| Honolulu County, HI | 78% | 77% | 50% | 998,556 |
| Will County, IL | 78% | 77% | 5% | 686,988 |
| Kane County, IL | 78% | 77% | 4% | 530,107 |
| San Mateo County, CA | 78% | 78% | 31% | 764,505 |
| Pima County, AZ | 65% | 68% | 3% | 1,009,377 |
| Lee County, FL | 65% | 67% | 2% | 701,529 |
| Allegheny County, PA | 64% | 75% | 4% | 1,228,320 |
| The Bronx, New York City | 63% | 64% | 4% | 1,455,667 |
| Riverside County, CA | 62% | 66% | 7% | 2,361,573 |
| Ramsey County, MN | 62% | 77% | 14% | 538,736 |
| Fresno County, CA | 60% | 66% | 11% | 973,514 |
| San Joaquin County, CA | 60% | 65% | 16% | 726,209 |
| Providence County, RI | 57% | 73% | 5% | 633,650 |
| Detroit, MI | 53% | 51% | 1% | 657,307 |
| Erie County, NY | 53% | 75% | 4% | 922,993 |
Jurisdictions with the highest Asian employment rates cluster in the Midwest (Hennepin County, Min. and several counties around Chicago) and the mid-Atlantic (Washington and Montgomery County, Md.), as well as places in Alabama, California, and Hawaii. Asians do not account for large shares of these counties, with the exception of Montgomery County, where they make up 16 percent of the population, and Honolulu, Hawaii, where they make up half of the population. The places with the lowest employment rates for Asians cover a range of places from Riverside, Fresno, and San Joaquin Counties in California, where they represent over twice their population share nationally; to Allegheny and Erie Counties and Detroit in the Rust Belt; The Bronx; Ramsey County in the Twin Cities area; Providence County, R.I.; and Lee County in Florida.
These data spotlight related challenges: Weak-market places need to build on their assets such as educational institutions, industry clusters, and civic leadership to boost their overall productivity and growth. And all places need to develop and invest in strategies to ensure that no community is systematically left behind. Both highlight that positive top-line employment numbers at the national or regional levels do not tell the whole story, as well as the urgent need to do the complex, long-term work of devising and delivering more inclusive economic growth strategies.
Related Content
Authors


The Brookings Institution is committed to quality, independence, and impact.
We are supported by a diverse array of funders. In line with our values and policies, each Brookings publication represents the sole views of its author(s).


Commentary
Employment by race and place: snapshots of America
February 27, 2017