Communities are increasingly challenged to provide good jobs for their residents. Without good jobs, communities experience persistent adverse impacts: residents with less work experience have lower long-term earnings, and lower job growth and earnings reduce local tax revenues, which strains local government’s ability to fund essential services such as health care and education. A lack of good jobs also obstructs upward mobility for the next generation due to more unstable family conditions, elevated crime rates, and subpar schools.
To disrupt this cycle of community decline, there’s growing interest in place-based policies that seek to boost job growth in distressed areas. Research supports targeting job growth at distressed places, which benefits not only those communities by increasing employment rates, but also the country as a whole by increasing and sustaining national employment rates.
Bipartisan support for investing in distressed communities has increased in recent years, with both the Trump and Biden administrations enacting policies and programs that tried to target investments toward disadvantaged areas. The Opportunity Zones program enacted under the Trump administration provides favorable capital gains treatment for investment in state-designated distressed areas. However, most research on the program does not suggest a large effect on jobs.
The Biden administration has instituted several small-scale pilot programs to spur job growth in distressed places, such as the Build Back Better Regional Challenge, the Tech Hubs program, the Regional Innovation Engines program, the Recompete Pilot Program, and the Reconnecting Communities Pilot program. Some larger Biden administration programs with more general purposes may have also helped distressed places. These include legislation to provide state and local fiscal aid (the Coronavirus State and Local Fiscal Recovery Fund), infrastructure investment (the Infrastructure Investment and Jobs Act), and “industrial policy” programs to promote investments in semiconductors and clean energy (the CHIPS and Science Act and Inflation Reduction Act). These more general purpose programs are more generously funded, and include some provisions that favor distressed places.
In our new report, we examine job growth data to see if these recent federal policies are creating jobs where they are most needed—in distressed communities. We find that job growth in distressed counties has in fact accelerated since 2019. At the same time, recent job growth trends have lagged in more prosperous counties. These overall job growth trends appear to have occurred in part due to trends in the growth of the manufacturing and high-tech industries, which policymakers have targeted.
It is important to note that these recent trends are modest. For example, job growth since 2019—while up in the most distressed counties—remains only slightly higher in these counties compared to growth rates from 2001 to 2019. The bottom line is that recent job growth in distressed counties, even if it persisted for a decade or more, would do little to decrease the gap in employment opportunities between these counties and the national average. Unless these trends accelerate, the opportunity gap facing residents of distressed communities will mostly remain the same.
Additionally, some of these recent trends may be due to causes other than federal policies. For example, the slowdown in high-tech growth in the least distressed counties appears to have begun in the 2007-2019 period. This pattern suggests causes other than recent federal policies, such as longer-term problems in some high-tech cities with higher housing and other local costs.
The long-term growth of distressed counties hinges on achieving above-average growth rates across multiple industries
To reach our conclusions, we first divided all U.S. counties into five quintiles according to their baseline level of economic distress. Counties are considered to be distressed if a low percentage of residents aged 25 to 54 are employed.
We focus on this “prime-age employment rate” for two reasons. First, the prime-age employment rate roughly controls for the age mix of a local population—for example, if a community has many college-age or retirement-age residents. Second, our society generally expects prime-age persons to work, so this is a good measure of whether a community is meeting that expectation. The baseline level of economic distress is determined from county prime-age employment rates at the start of each analysis period.
The contrast in prime-age employment rates between struggling and thriving areas is stark. In our lowest quintile, the most distressed counties have an average prime-age employment rate of 70.3%, according to the 2015-19 American Community Survey. Conversely, in the top quintile, the least distressed counties have an average prime-age employment rate of 84.5%.
Next, we used county-level data from Lightcast to look at employment trends. We examined the average annual job growth rate for three periods: prior to the Great Recession (2001 to 2007), the Great Recession and recovery (2007 to 2019), and the pandemic recession to present (2019 to 2022-23).1 In choosing these periods, we attempt to look at average employment growth from business cycle peak-to-peak because it is a better measure of long-term growth trends. However, we acknowledge that the 2022-23 data is not a peak (although it is also not close to the trough of a recession). Data availability dictates this endpoint.
In our analysis, we control for a county’s job growth due to its industrial mix—essentially, the job growth predicted if each industry in a county grew at that industry’s national growth rate.2 We label county job growth after this industrial mix control as “competitive job growth.”
Controlling for industry-mix-predicted growth has two advantages. First, it provides a clearer understanding of government policy’s possible effect on local job growth. How a county’s industries fare nationally is not easily changed by local policy or place-based policy. But policies regarding taxes, public services, infrastructure, and incentives may be able to affect whether a county’s industries can grow faster than their national counterparts.
Second, once we adjust for industrial mix, a place’s ability to sustain competitive job growth is likely the primary factor influencing long-term growth. Over time, the industrial mix’s influence on local job growth tends to fade, as industrial location is more malleable in the long term. But if a place is able to sustain competitive job growth—the ability for its industries to grow faster than their national counterparts and gain market share—then that place will do better in the long term. This greater competitive job growth may be due to federal, state, or local policies, or any economic forces that make a place more attractive for job growth.
Competitive job growth in the most distressed counties has improved
When we look at overall competitive job growth, we find that in the most recent period (2019 to 2022-23), the most distressed counties show more favorable outcomes than they did up to the peak prior to the Great Recession (2001 to 2007) or from the peak just prior to the Great Recession to the pre-pandemic peak (2007 to 2019). Meanwhile, we find that the least distressed counties have seen their competitive job growth decline in the present period (2019 to 2022-23), after experiencing high levels of competitive job growth prior to the Great Recession (2001 to 2007), which then moderated during the Great Recession and recovery (2007 to 2019).3

These changes over time are not trivial, but they remain modest. For example, if the most distressed county job growth trend of 2001 to 2007 had persisted for 10 years, the cumulative job growth deficit would have been 2.4% below the average county. If instead, the most distressed counties followed the growth trends of 2019 to 2022-23 for 10 years, the cumulative job growth advantage would have been only 0.8% above the average county.
How much of a difference would these possible cumulative job growth trends have made to these distressed counties’ employment rates? Based on prior research on how job growth in distressed counties affects employment rates, a cumulative growth deficit of 2.4% would lower the prime-age employment rate by 0.8 percentage points, whereas a cumulative job growth advantage of 0.8% would increase the prime-age employment rate by 0.3 percentage points.4 As mentioned, these distressed counties have a baseline prime-age employment rate of 70.3%, which is almost 9 percentage points below the national average of 79%. Therefore, the most recent trends favoring distressed counties would do little to close the gap between these counties and the national average. However, unlike past trends, these recent trends are not increasing employment rate gaps.
In the most recent period, distressed counties have seen positive job growth in manufacturing and high-tech industries
Next, we turn to competitive job growth in the four industry groups receiving high levels of federal policy attention: manufacturing, high-tech, clean energy, and semiconductors.
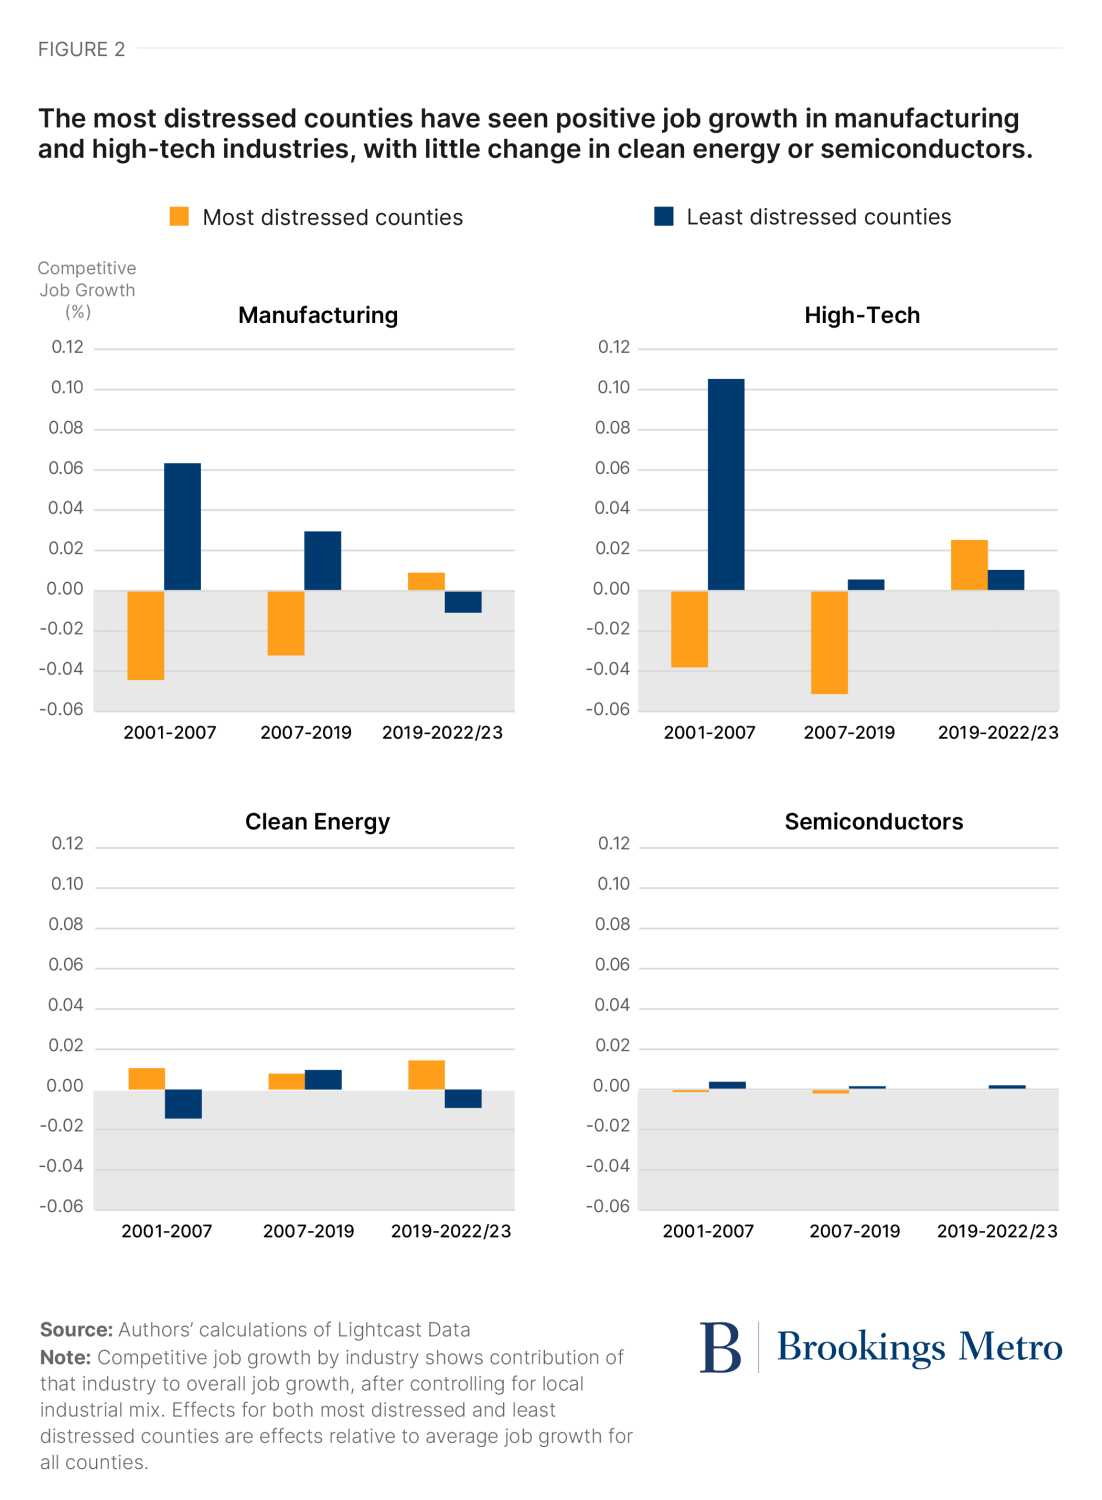
We find that the most distressed counties did significantly better in job growth due to manufacturing in the most recent period (2019 to 2022-23) compared to either of the prior periods. Conversely, the least distressed counties in this group did significantly worse in competitive job growth due to manufacturing during the most recent period compared to either of the two prior periods. This finding is similar to other studies that have examined increased factory construction driven by Biden administration investments in “strategic sectors” such as advanced manufacturing. These investments have predominantly benefited U.S. counties with struggling economies. Other factors, such as a surge in reshoring following pandemic-related supply chain issues, may have also played a role.
High-tech industries show a similar trend, with the most distressed counties having higher levels of competitive job growth in the most recent period (2019 to 2022-2023) compared to the prior two periods. Again, this finding is in alignment with other studies showing that high-tech industries are diversifying geographically. However, while the most distressed counties show improvement in overall and tech-related job growth, it’s premature to attribute these trends solely to public policy without specific evidence.
As mentioned previously, the least distressed counties have seen a slowdown in competitive growth in high-tech industries. Much of the job growth in these counties was the result of investments prior to the Great Recession (2001 to 2007). The decline in high-tech growth in the least distressed counties during the Great Recession and recovery (2007 to 2019) might be attributed to rising housing and local costs, possibly outweighing agglomeration benefits for businesses to operate in high-tech centers such as Silicon Valley and Seattle.
The results for clean energy and semiconductors are somewhat less robust. For counties with different baselines of economic distress, the competitive job growth of these industries shows little change across the various periods.
Job growth trends in distressed counties are promising, but more substantial interventions are needed to fully close the employment rate gap
Recent trends indicate more favorable job growth for the most distressed counties compared to the least distressed ones, influenced partly by shifts in manufacturing and high-tech industries. These positive shifts, though promising, are merely a sign that further decline has halted rather than narrowing the overall employment rate gap.
To meaningfully bridge this gap, more substantial job growth or policy interventions are required. Additionally, the sustainability of these recent positive trends remains uncertain; they could either be strengthened with effective industrial policies or fade if reliant on temporary fiscal assistance. As economic conditions evolve, ongoing analysis will be crucial to understanding these trends’ persistence and implications.
Authors


-
Footnotes
- The 2022-23 data are the last two quarters of 2022 Quarterly Census of Employment and Wages (QCEW) data and the first two quarters of the 2023 QCEW data. This was the most recent data available when we conducted our study.
- It should be noted that around 60% of Lightcast data employment counts by industry must be estimated using an algorithm that unsupresses the QCEW data, on which Lightcast industry employment counts are primarily based.
- As discussed in the full report, the differences between the most distressed counties’ job growth in the most recent period versus either of the two prior periods are statistically significantly greater than zero. For the least distressed counties, average growth in the most recent period is statistically significantly less than this quintile’s growth in the two prior periods. Finally, for the fourth quintile, in the next to least distressed county group, the growth in the most recent period is less than that in the prior period. All the other differentials over time are not statistically significantly different.
- See the full paper for the derivation of this calculation.
The Brookings Institution is committed to quality, independence, and impact.
We are supported by a diverse array of funders. In line with our values and policies, each Brookings publication represents the sole views of its author(s).