

This report was updated on March 26, 2025, to reflect the accurate figures for the amount of revenue Black businesses added to the U.S. economy in 2022 and their total salaries that year. Those figures are $212 billion and $61 billion, respectively, rather than $212 million and $61 million.
After the COVID-19 pandemic’s initial shocks to business owners, entrepreneurship bounced back, with the number of new business applications booming since 2020. According to the Census Bureau, national business applications remained fairly stagnant from 2017 to 2019, but between April 2020 and July 2020, applications more than doubled, from 235,695 to 546,415. Applications remained high through 2022, with 423,977 applications submitted in December of that year.
Black-owned employer businesses (firms with at least one employee) made up a large share of this growth. From 2017 to 2022, the number of employer businesses owned by Black Americans increased by 56.9%. Of the roughly 132,000 new employer businesses started in the U.S. between those years, at least 70,000—over half—were Black-owned.
This growth not only creates a more inclusive business environment, but also a more competitive and dynamic national economy. In 2022, the most recent year of data available, Black-owned business added $212 billion in revenue to the economy, employed an average of eight people per firm, and paid over $61 billion in total salaries. The entrepreneurialism of other minority racial groups also boosted the economy in recent years: The number of minority-owned employer businesses increased by over 334,000 from 2017 to 2022, adding $738 billion to the economy and creating 1.9 million more jobs in 2022 compared to 2017.
As part of our annual series expanding on the Path to 15|55 initiative, this report analyzes these trends pushing the nation toward a thriving and diverse economy. Using data from the Census Bureau’s American Community Survey and Nonemployer Statistics, we highlight the sectors and metro areas driving this growth. We also examine overall racial disparities in employer business ownership and compare the share of firms owned by different race and ethnicity groups to their respective share of the population—highlighting the growth needed to achieve equality.
Findings include:
- While the share of employer businesses that are Black-owned increased from 2.2% in 2017 to 3.3% in 2022, this representation is still far below Black Americans’ 14.4% share of the U.S. population.
- Since 2017, Black-female-owned businesses increased by 71.6%.
- The number of Black-owned employer firms in transportation and warehousing as well as real estate, rental, and leasing doubled.
- Health care and social services continue to be the industry with the highest number of Black-owned employer businesses. The share of Black ownership in this industry increased from 6% to 7.5% from 2017 to 2022.
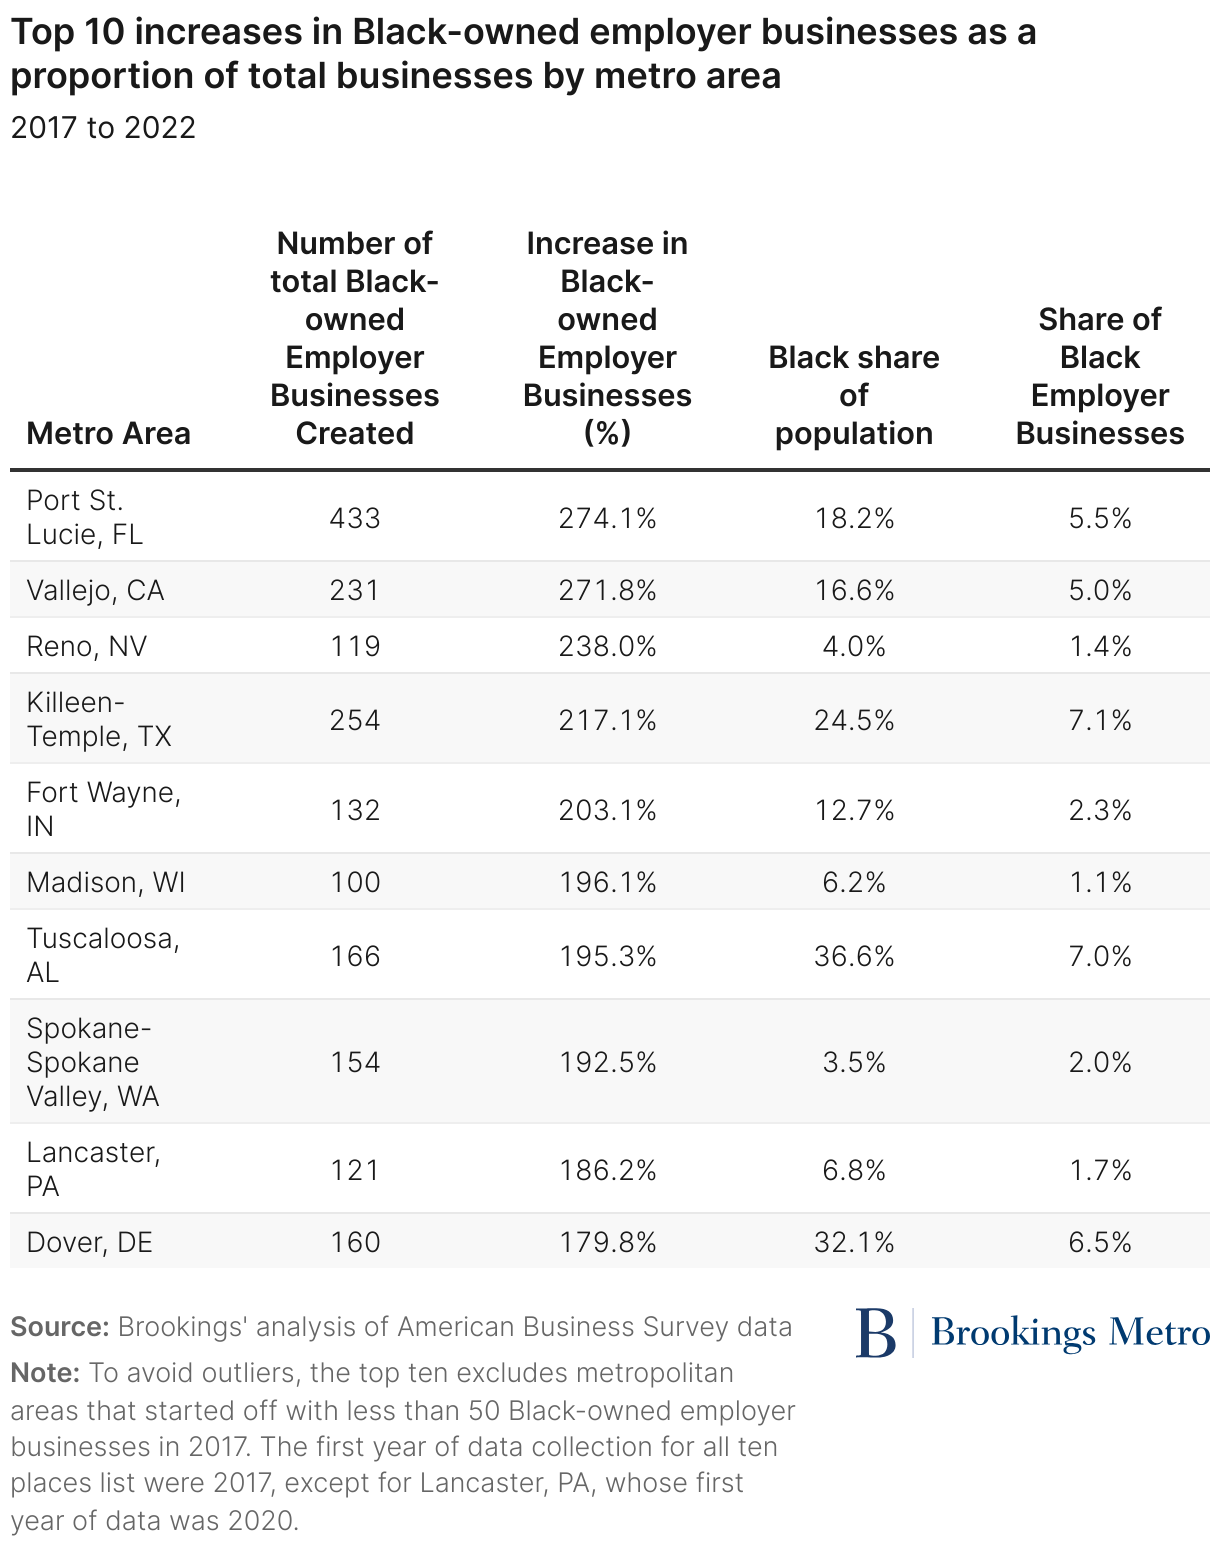
- Black-owned employer businesses are flourishing in the South and East, and many metro areas saw the number of Black-owned businesses more than double from 2017 to 2022, including Reno, Nev.; Minneapolis-Saint Paul-Bloomington, Minn.-Wis.; and Austin-Round Rock-San Marcos, Texas.
Black business ownership jumped, yet it’s still far from parity with the US population
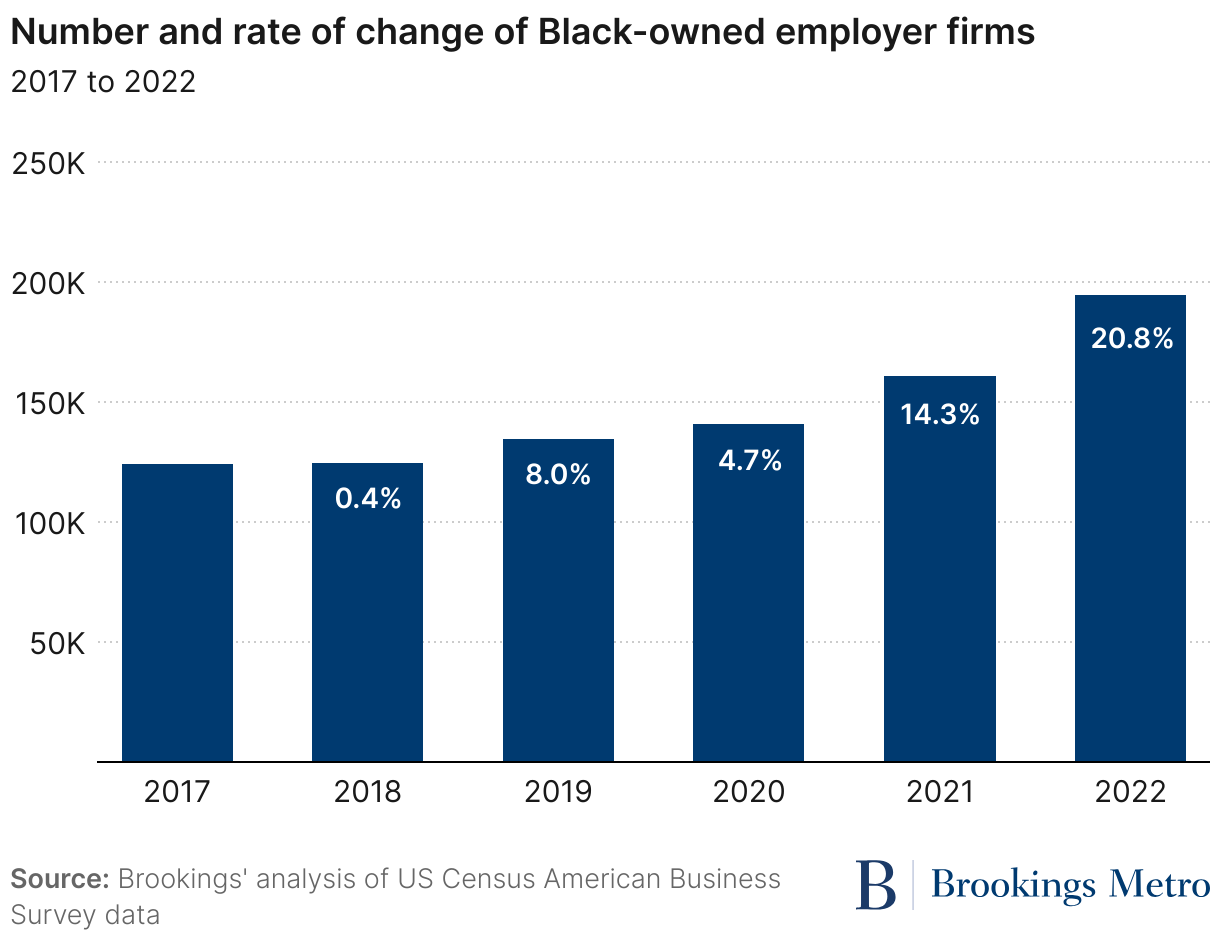
From 2017 to 2022, the number employer businesses owned by Black entrepreneurs increased by 56.9%, or 70,581 firms (see Figure 1), with an average annual growth rate of 9.7%. From 2021 to 2022 alone, the number of Black-owned employer businesses increased by 20.8%, to a total of 194,585 firms nationally. Yet despite this growth, the share of employer businesses Black people own is 3.3%—substantially lower than Black Americans’ 14.4% share of the population.
Compared to other race and ethnicity groups, Black Americans have the third-lowest representational share of employer business ownership (see Table 1). Native Hawaiian or Other Pacific Islanders have the lowest, representing 0.2% of employer business owners and 0.5% of the population; they are followed by American Indian and Alaska Natives, who represent 0.8% of employer business owners and 2% of the population.
Hispanic or Latino entrepreneurs also owned a lower share of employer businesses than their population share, representing 7.9% of owners compared to 18.7% of the population. Asian American and white entrepreneurs owned the largest shares of employer businesses: 11.1% and 81.1%, respectively, both of which are larger than their population share (7% and 74%, respectively).

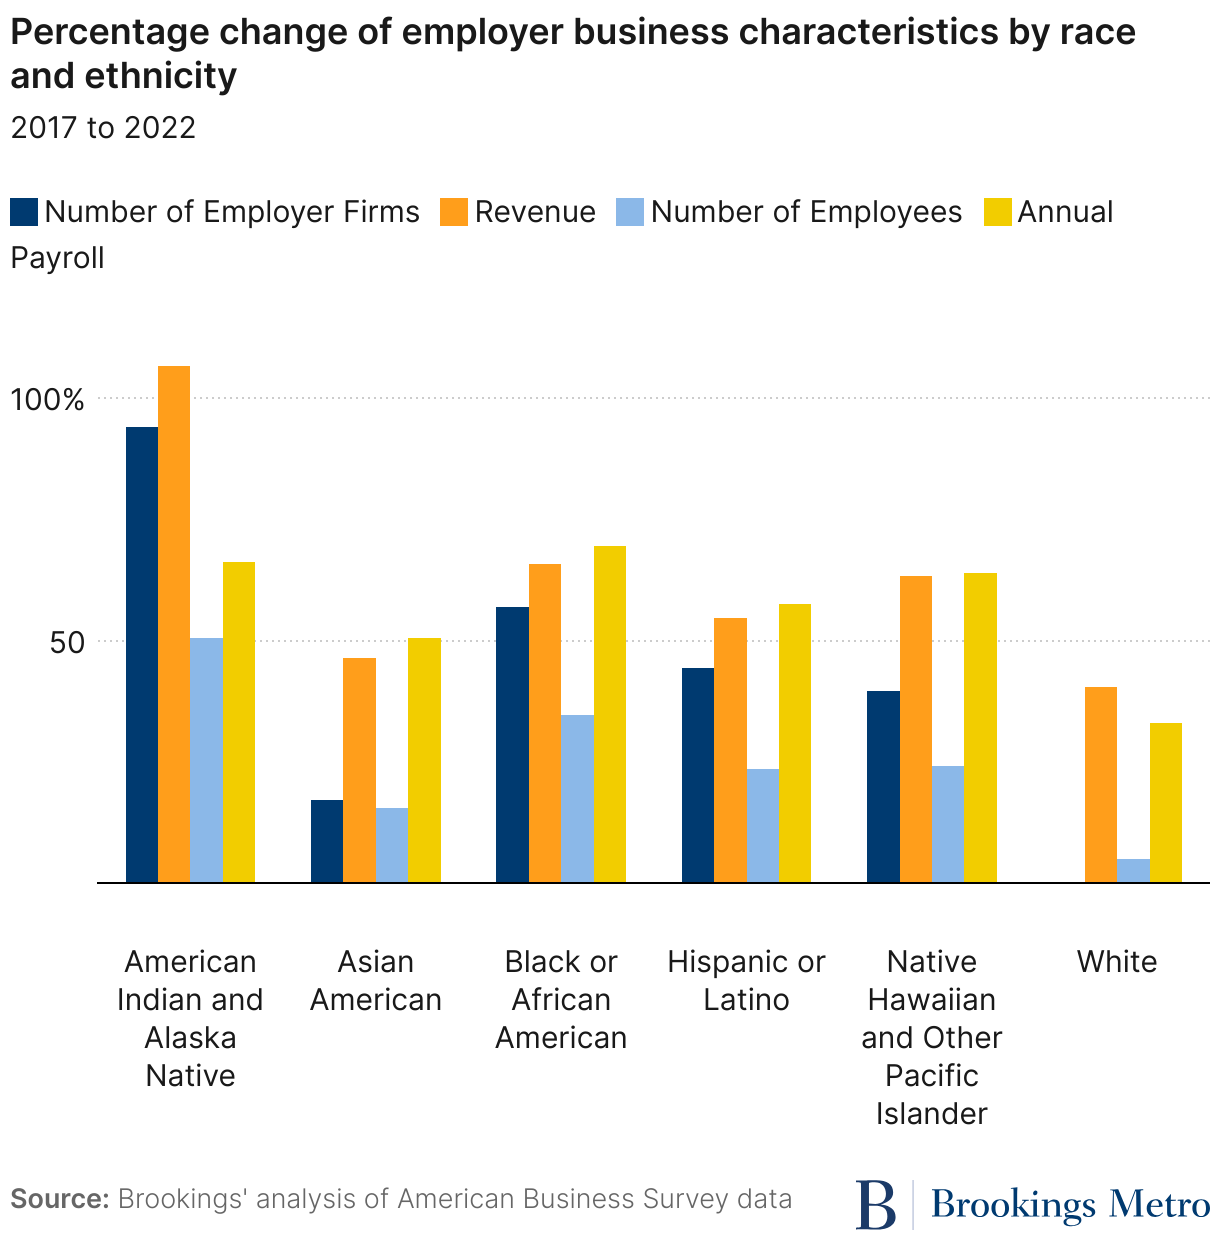
All minority race and ethnicity groups saw increases in the number of employer business they owned over the 2017 to 2022 period. Asian American-owned employer businesses grew by 17.1%, Native Hawaiian and Pacific Islander-owned businesses grew by 39.5%, and Hispanic or Latino-owned businesses grew by 44.4%. In contrast, the number of white-owned employer businesses decreased by less than 1%, but still grew in total revenue, number of employees, and overall payroll.
These strong business growth rates across race and ethnicity show that minority business owners’ success does not come at the expense of white business owners. If economic growth was a zero-sum game across racial groups, the number of white-owned businesses would be expected to decline at 10 times the rate (7%), with comparable declines in revenue, employees, and payroll. Instead, growth among Black-owned businesses and other race and ethnicity groups helped drive a national economic recovery following the pandemic.
In addition to the rising number of businesses, minority employers also increased their total revenue, employees, and payroll. In 2022, Black-owned employer businesses brought in 65.7% more in revenue, hired 34.6% more employees, and paid 69.5% more in payroll than five years prior. These growth rates are higher than any other racial or ethnic group except for American Indian and Alaska Native business owners, who increased their total revenue by over 100% and employees and payroll by over 50%. This high growth rate may be the result of large investments in Native communities under the Biden administration as well as an increased need for entrepreneurship on reservations and in Native communities with limited employment opportunities. It may also reflect other factors, such as an increase in Native self-identification and changes to Census Bureau data practices, and thus should be interpreted with some caution.
The gap in Black business ownership by sex persists
From 2017 to 2022, Black-female-owned employer businesses increased by 71.6%—a higher rate than Black-owned and female-owned businesses overall.
As Figure 3 shows, the total revenue of Black-female-owned employer businesses increased by 82.1%, while Black-male-owned employer businesses saw a 63.9% increase in total revenue. In contrast, Black-male-owned employer businesses saw greater increases in the number of employees (43.7%) and annual payroll (75.4%) than their female counterparts, who increased their employee count by 31.8% and payroll by 67.9%.
Of the roughly 70,000 new Black-owned employer businesses created from 2017 to 2022, fewer than half (roughly 32,000) were female-owned, despite female people comprising 51.8% of the U.S. Black population. Thus, despite large proportional growth in Black-female-owned businesses indicating success for those entrepreneurs, there are continued disparities between male and female people in owning an employer business. These high proportional growth rates are partly due to the fact that there were fewer Black-female-owned businesses to start with compared to Black-male-owned businesses.

Some industries saw a sharp jump in Black-owned businesses
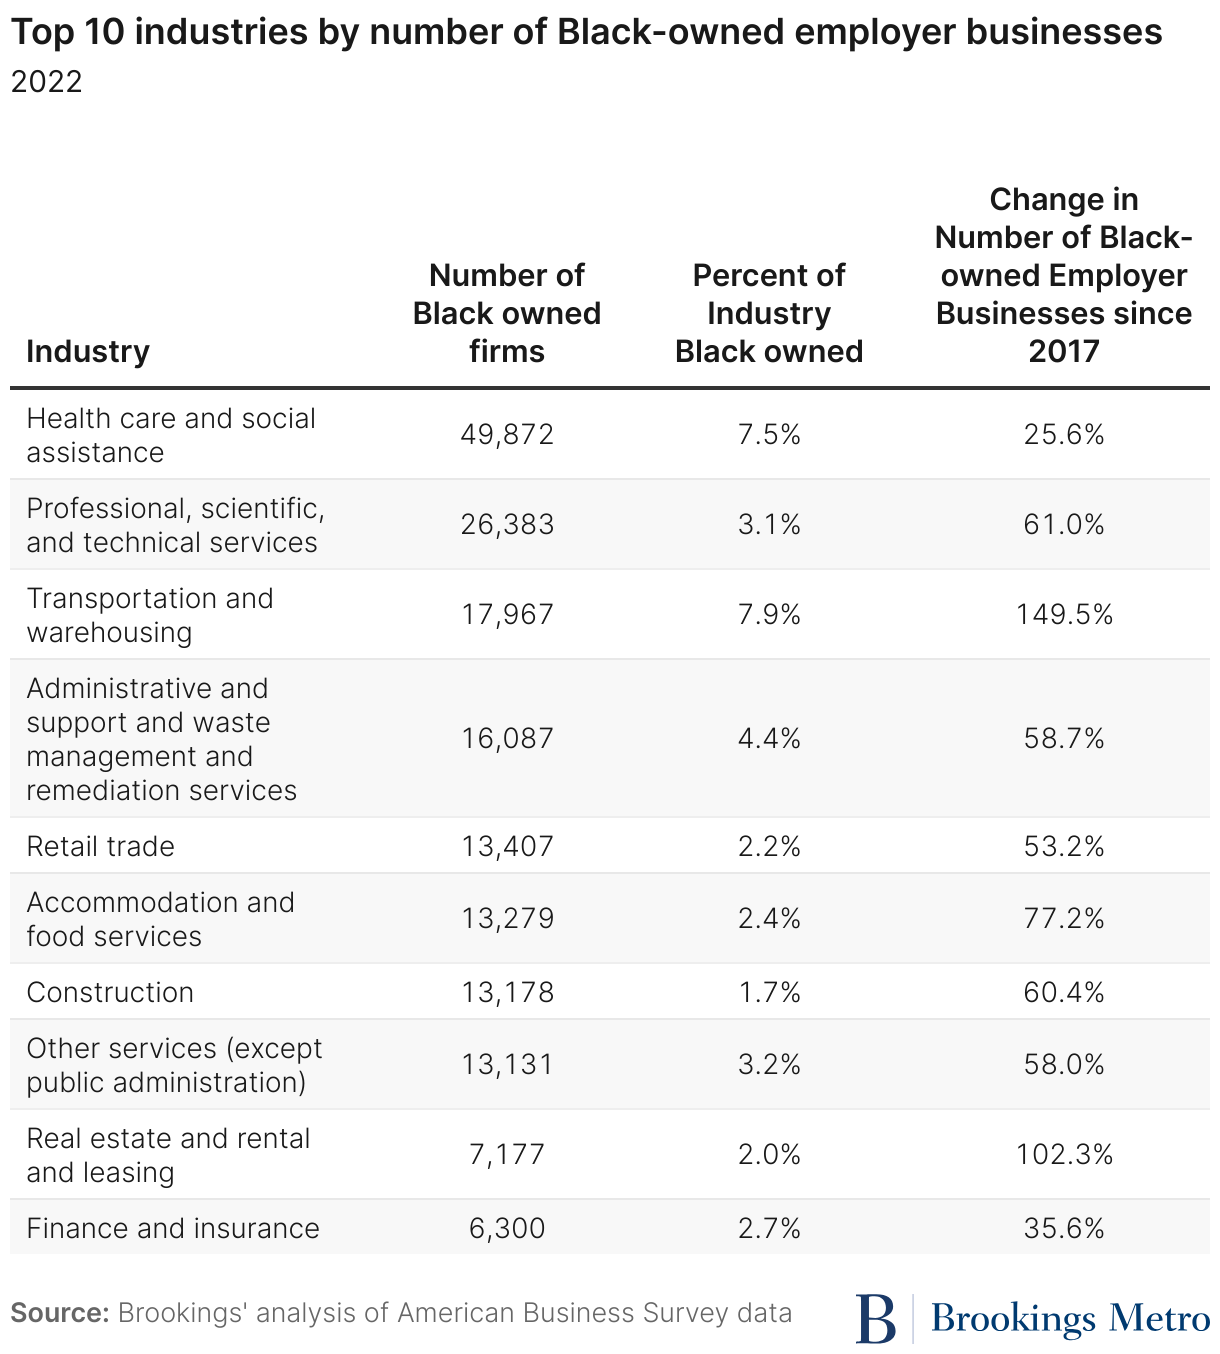
Nationally, health care and social assistance is the industry with the most Black-owned employer firms, a spot it has held since at least 2017. However, Table 2 shows that in the other top 10 industries for Black entrepreneurs, there was notable growth.
For example, the number of Black-owned businesses in the transportation and warehousing industry increased by nearly 150% from 2017 to 2022, with the industry’s share of Black employers growing from 3.8% to 7.9%. In the real estate, rental, and leasing industry, Black-owned employer businesses doubled in the same period, making it the industry with the ninth-highest number of Black-owned employer firms in 2022.
Cities across the nation saw large increases in Black-owned businesses
Alongside the national trend of growth, cities across the United States also saw large increases in the number of Black-owned employer businesses, with some areas eclipsing the national average.
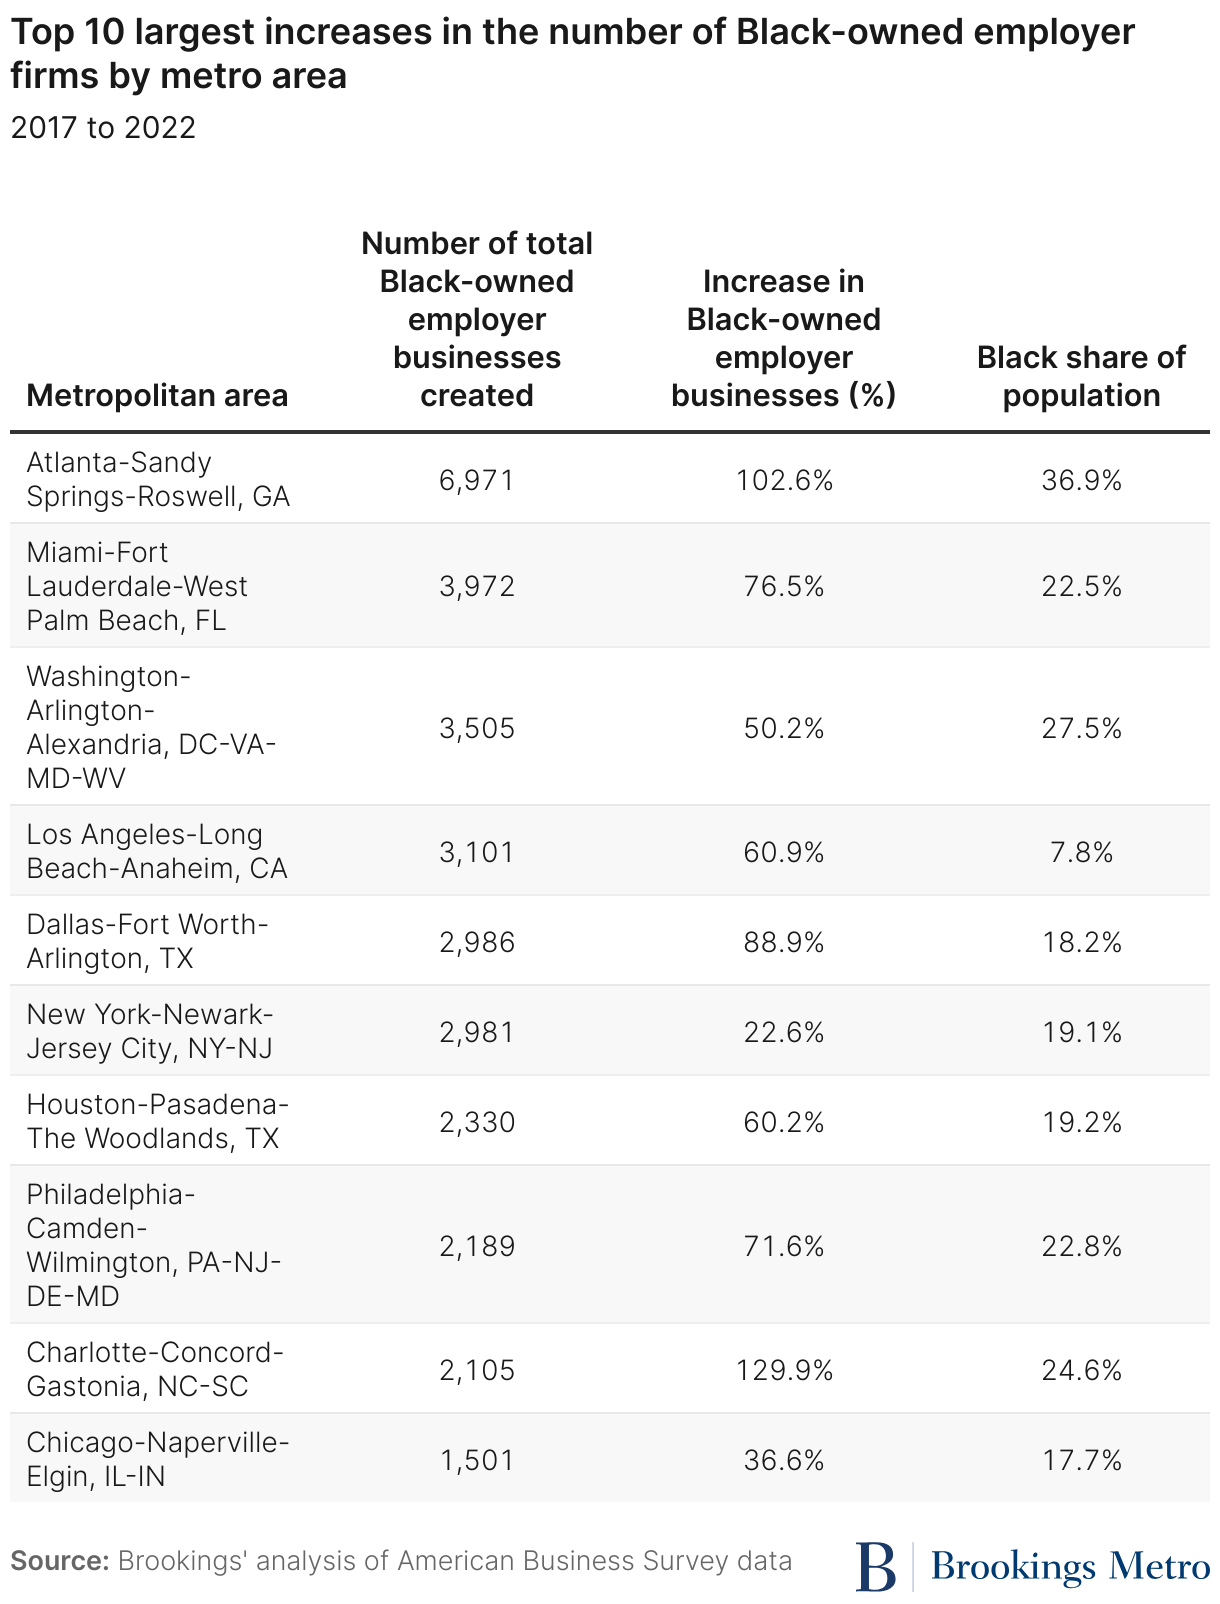
Of the 288 metro areas where data was available, two-thirds saw growth in the number of Black-owned employer businesses. Most of those with the greatest increases were larger cities in the South and on the East Coast. In contrast, 37 (12.9%) of metro areas saw a decline in Black-owned businesses between 2017 and 2022, while 57 remained consistent.

The greatest numerical increase was in Atlanta, where an increase of nearly 7,000 businesses doubled the share of Black-owned employer businesses in the city. An even greater proportional increase occurred in Charlotte, N.C., which gained 2,105 Black-owned employer firms in the five-year span. Baltimore saw a decline in the number of Black-owned employer businesses from 2017 to 2020, but a major uptick from 2020 to 2022; overall, the city gained 1,168 Black-owned employer business over the five-year period—a 42.2% increase, placing it 14th nationwide in terms of growth.
Of the 94 metro areas that saw negative or no growth in Black-owned employer businesses, St. Louis saw the greatest decrease, with a loss of 2,549 Black-owned firms. However, despite this exceptional loss of businesses in St. Louis, the metro area still ranked 12th for the most Black-owned employer businesses overall in 2022. The second-largest decrease was in Gainesville, Fla., which lost 110 Black-owned employer firms.
Other notable decreases occurred in Rocky Mount, N.C., and Macon-Bibb County, Ga. Both are smaller cities with populations that are over 40% Black, far above the national average of 14.4%. Despite being in the same state as two of the largest-gaining cities (Charlotte, N.C. and Atlanta), these places were in the top 15 metro areas in terms of decline, losing 54 and 36 Black-owned employer businesses, respectively.
The metro areas with the highest proportional increases in the number of Black-owned employer businesses had smaller actual gains and varied more by region, with cities from all four corners of the country. These places also varied widely by demographics. The third-largest proportional increase was in Reno, Nev., where just 4% of the population identifies as Black. The 10th-largest proportional increase was in Dover, Del., where nearly one-third of the population identifies as Black.
The role of non-employer businesses in future Black business growth
Although there was significant growth in Black-owned employer businesses from 2017 to 2022, to reach parity with population demographics, Black entrepreneurs would need to own 14.4% of total employer businesses—a substantial increase from the current 3.3%.
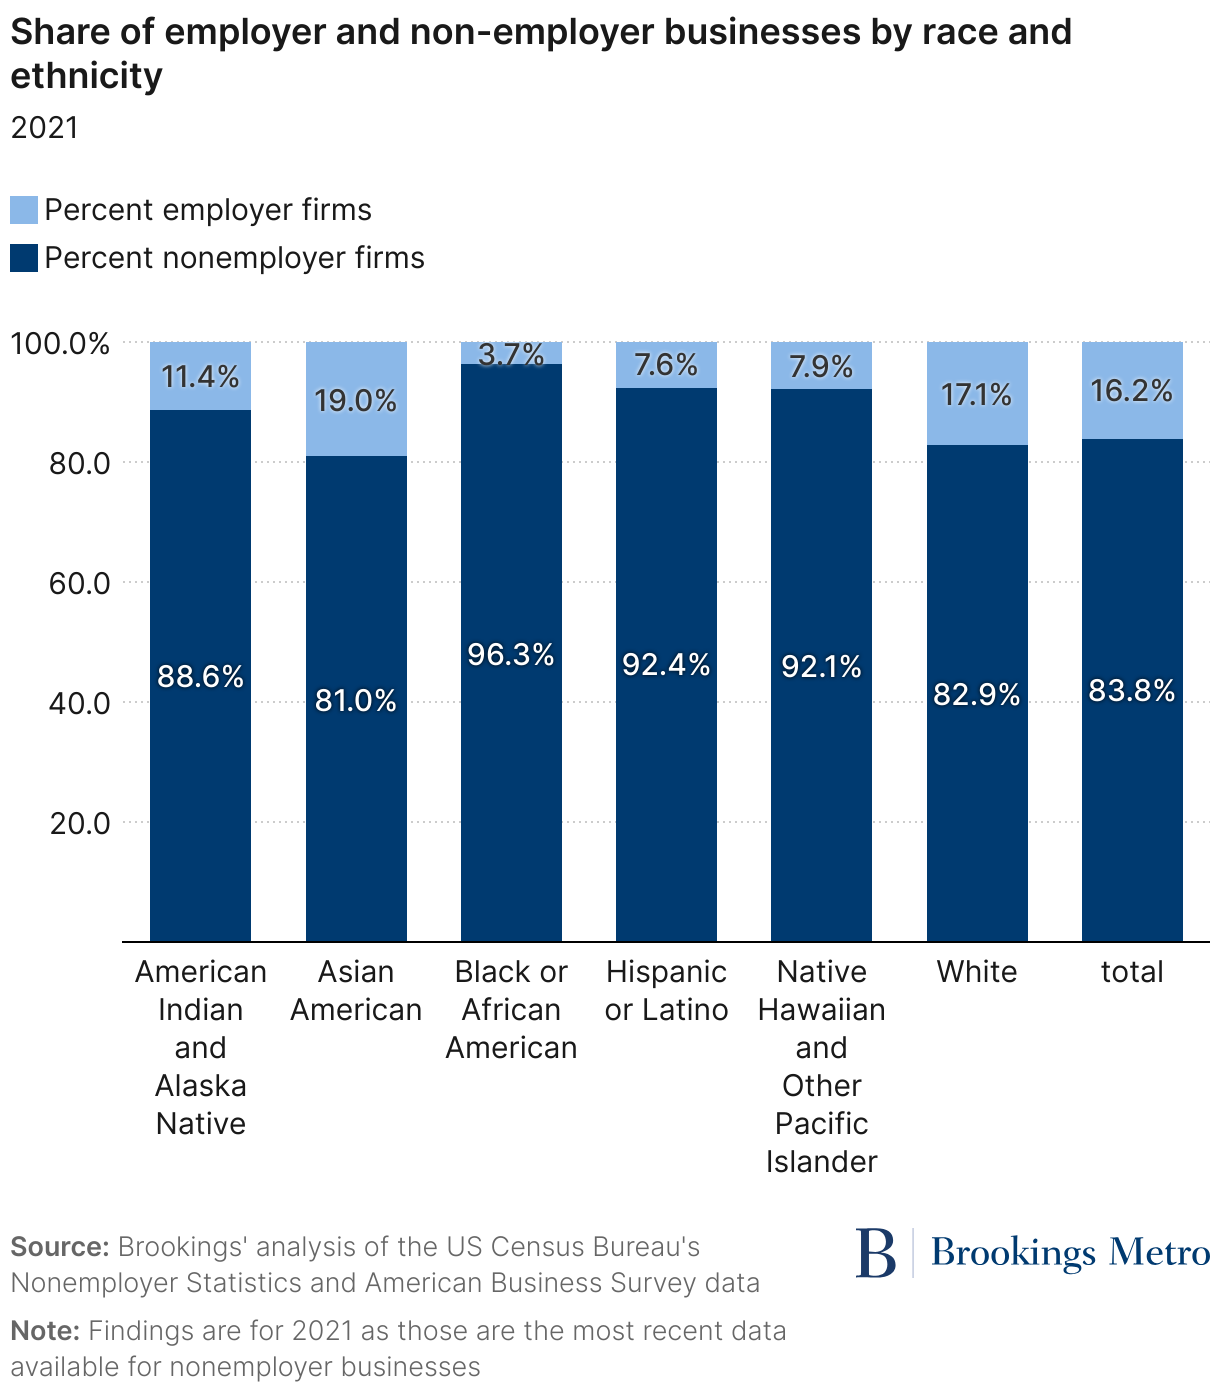
There are many paths to more equal representation in employer businesses, including through mergers and acquisitions of small firms to combine strengths or through the expansion of individual non-employer businesses. Non-employer firms made up roughly 96% of all Black-owned businesses in 2021, the most recent year of data. As Figure 4 shows, that proportion is above the national average, as non-employer businesses made up 83.8% of businesses overall that year. In fact, American Indian and Alaska Native, Black, Hispanic or Latino, and Native Hawaiian or Other Pacific Islander entrepreneurs are all overrepresented in ownership of non-employer firms.
Strengthening national and local economies depends on growing the diversity of business owners
Across the U.S., growth in business ownership and employer status was bolstered by a supportive environment for minority business owners. Black-owned employer businesses saw five years of continual growth, increasing from 2.2% of all employer businesses in 2017 to 3.3% in 2022. Despite COVID-19 shuttering businesses and disrupting local economies, Black-owned businesses—as well as those owned by Hispanic or Latino and Asian Americans—drove a rise in ownership and economic gains.
These business owners support their communities by creating jobs and driving local economic development. And while it’s difficult to say what national business creation trends may have looked like without this growth, it’s no stretch to say that the explosion in the racial diversity of business owners helped American enterprise.
We’ve written before on the loss for America and local economies when business owners from diverse backgrounds are left on the sidelines. When these entrepreneurs face unfair barriers that, for example, reduce their access to credit, whole communities suffer. Continuing to support Black-owned businesses isn’t just about creating a more inclusive economy that works for more Americans—it’s about strengthening the economy for all Americans.
Authors


-
Acknowledgements and disclosures
This publication was made possible by support from CapEQ. The views expressed in this article are those of its authors and do not represent the views of CapEQ, their officers, or their employees.
The Brookings Institution is committed to quality, independence, and impact.
We are supported by a diverse array of funders. In line with our values and policies, each Brookings publication represents the sole views of its author(s).