

Recent debate in Washington has focused on U.S. bilateral trade deficits, as they underpin the Trump administration’s proposed “reciprocal tariffs.” Alongside concerns over “unfair” trade practices, the large and growing U.S. net external liabilities—$26 trillion (90% of GDP) at the end of 2024—are cited as a justification for imposing tariffs.
This post explores whether the countries with bilateral trade surpluses vis-à-vis the U.S. are the ones that have been accumulating financial claims on the U.S. While economists rightly question the usefulness of bilateral trade balances—especially those limited to goods—we examine whether there is any correlation between trade and financial flows at the bilateral level. We use the current account balance (which includes goods, services, investment income, and transfers) and compare it to net financial flows over the past decade using Bureau of Economic Analysis data.
As the below chart makes clear, the countries (and regions) that have run large current account surpluses vis-à-vis the U.S. (China in primis, but also Mexico and countries such as Vietnam and Thailand, included in “Other Asia and Pacific” in the chart) have not been the largest investors in the U.S. In contrast, European advanced economies, despite modest bilateral current account surpluses, have invested heavily in the U.S. One exception to this is Japan, whose bilateral surplus is matched, in part by net investment in the U.S.
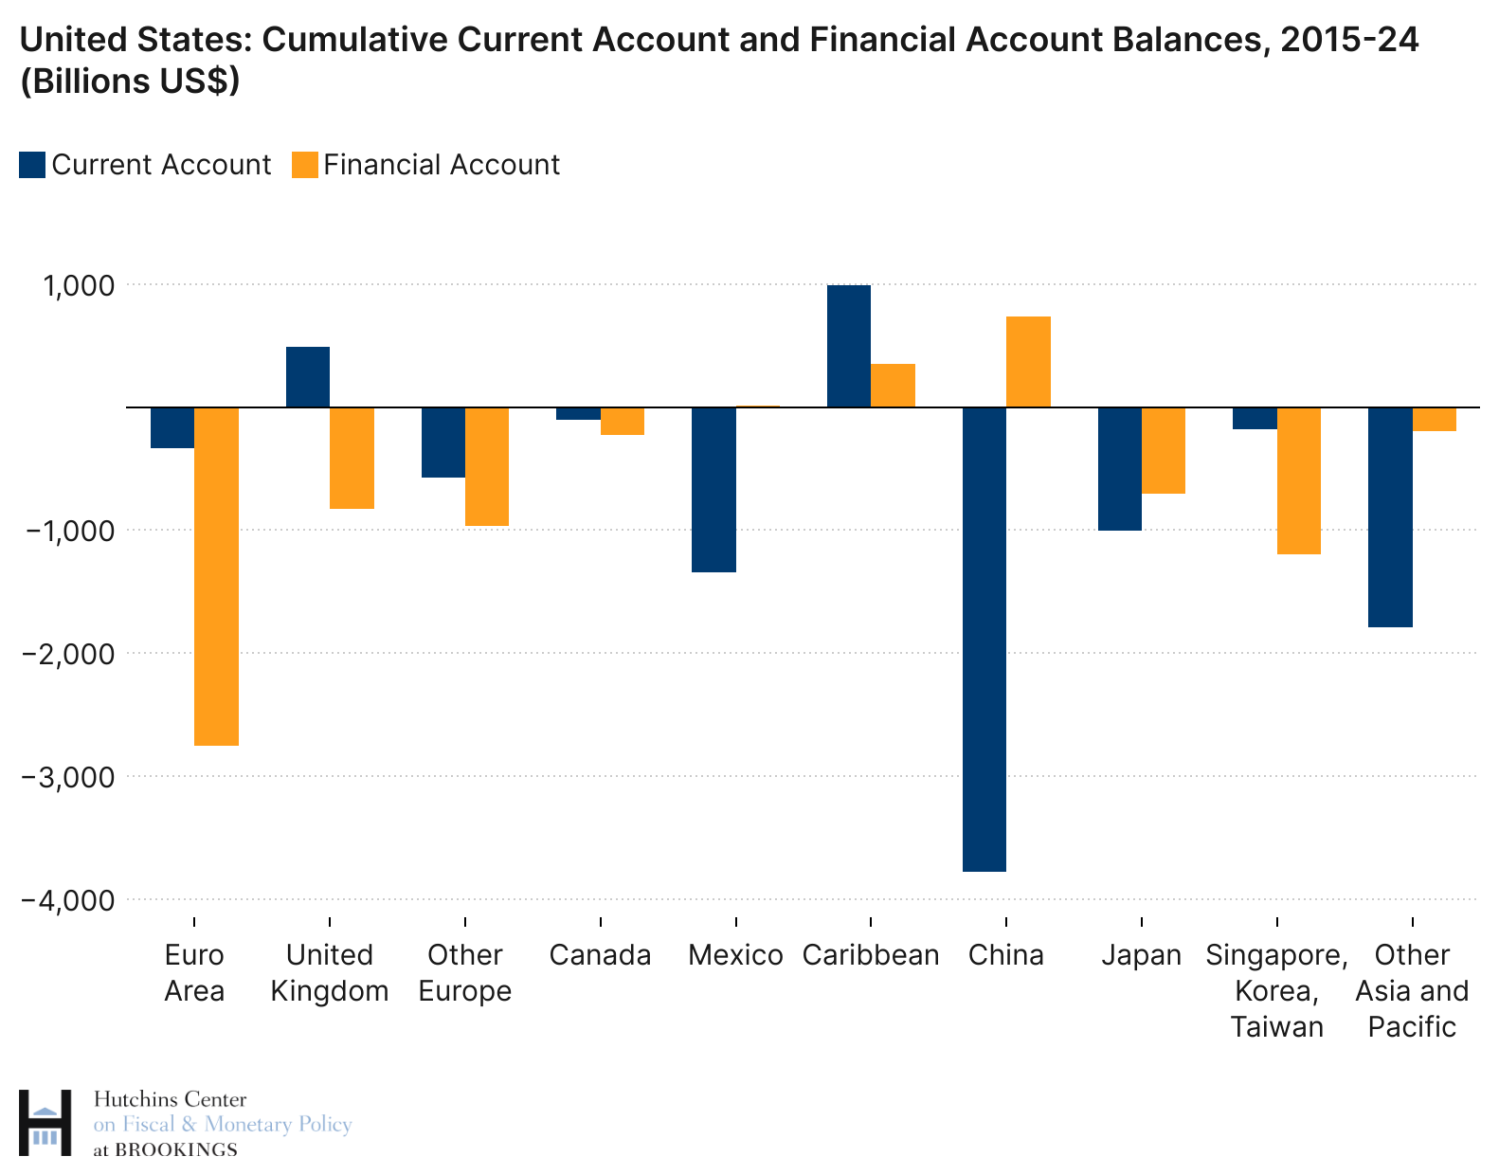
What underpins the different dynamics between Europe and China? Since the global financial crisis, China has diversified its holdings of foreign assets, shifting away from the U.S. and making loans and foreign direct investment in emerging and developing economies. The true allocation of China’s holdings is obscured in U.S. statistics because it holds some U.S. bonds in custody outside the U.S. Some are reportedly at Euroclear in Belgium and recorded as euro area holdings in U.S. data. But even reallocating estimates of such holdings to China, the broad pattern showed by the chart remains unchanged.
For Europe, the U.S. is a major destination of portfolio investment in both bonds and equities, with investment funds and institutional investors such as pension funds (plus the Norwegian sovereign wealth fund) playing an important role.
How can this disconnect between bilateral current account and net financial flows happen in practice? Simply, China can invest its surplus dollars in European financial assets, or in loans to emerging and developing economies that buy goods from Europe. In turn, European countries can reinvest the proceeds in U.S. assets. Incidentally, this evidence on net financial flows also casts doubt on a simplistic interpretation of the U.S. current account deficit as arising from China’s desire to buy U.S. assets.
Mexico and some Asian emerging economies (such as Vietnam) show large trade surpluses with the U.S., but don’t of accumulate net financial claims. This is partly because these economies are important nodes at the end of U.S.-directed supply chains—exporting goods to the U.S. that have significant content from other countries. This means that their total exports exceed substantially the value added produced in the country, and hence their proceeds are spent to an important extent on the inputs necessary for such exports. Indeed, Mexico ran an overall trade deficit during the past 10 years while running a bilateral surplus vis-à-vis the U.S.
To clarify these dynamics, we compare the current account (the most comprehensive trade measure) with the balance on goods (used in the Trump administration’s tariff calculations). Our second chart shows the various components of the current account balance of the U.S. vis-à-vis other countries and regions. It makes clear that U.S. deficits on the trade balance in goods are offset in part by surpluses on trade in services. But it is useful to also consider the balance on investment income, and particularly so for the regions with which the U.S. is running an investment income surplus.
Significantly, the U.S. earns more investment income from Europe than vice versa, even though European residents own more U.S. assets than vice versa. Why? Profit-shifting by U.S. multinationals via low-tax jurisdictions like Ireland and the Netherlands, which occurs through trade invoicing strategies and shifts in intellectual property location. When adjusting for services and profit shifting, the euro area’s surplus with the U.S. shrinks by around 80% compared to the balance on goods.
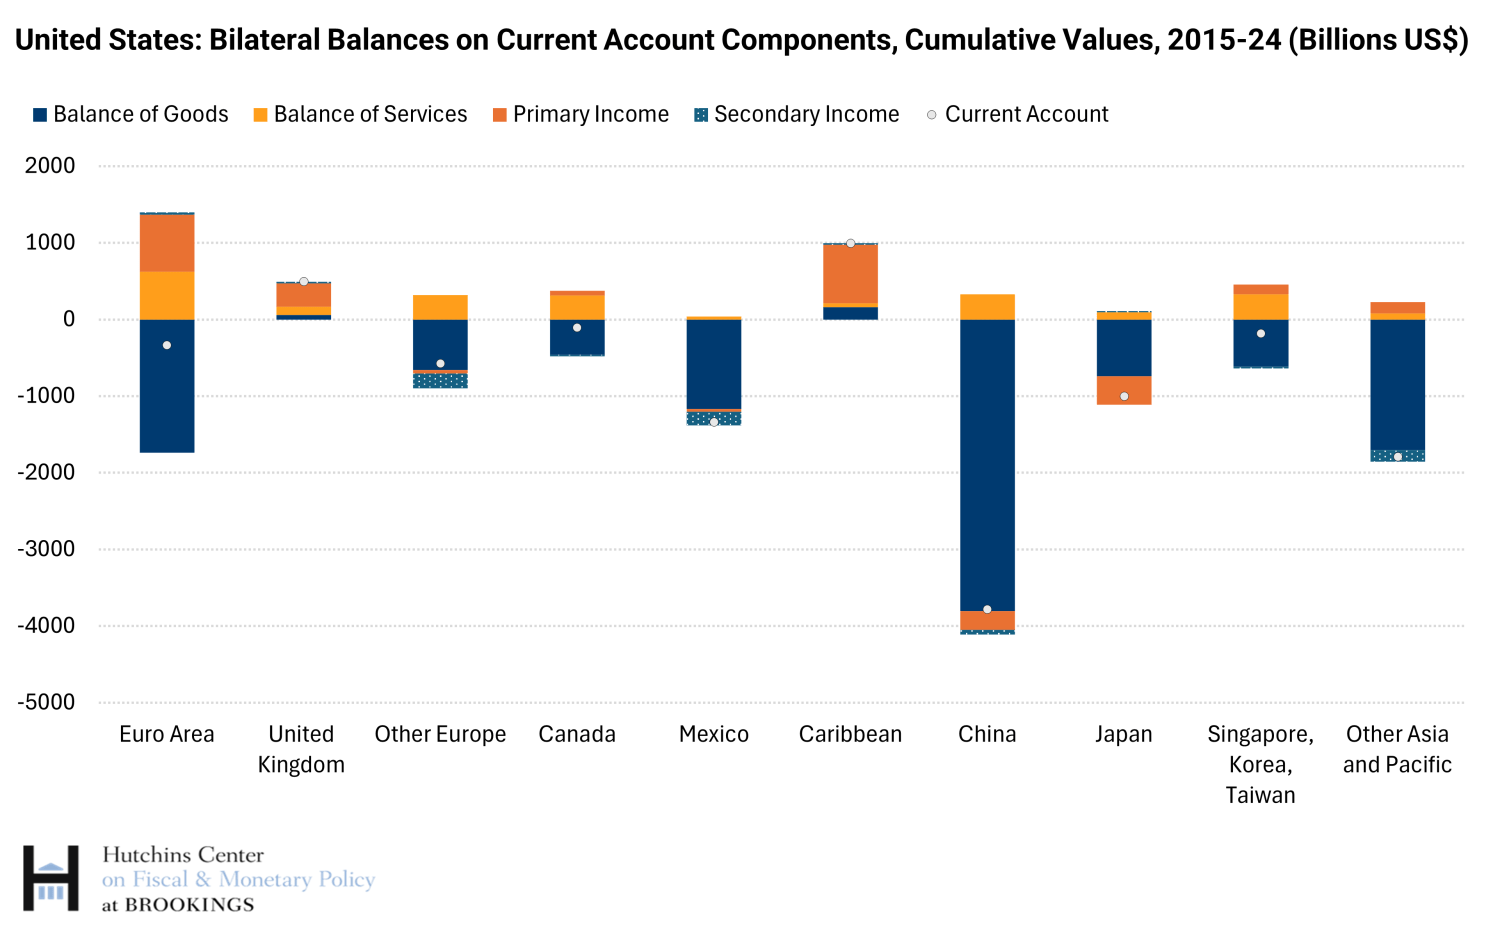
Another notable case are the Caribbean countries with which the U.S. runs a large investment income surplus (equivalent to about 70% of these economies’ aggregate GDP each year). As the chart shows, this arises almost entirely from investment income—and it is again driven by U.S. multinationals booking profits in these jurisdictions.
In sum: Against all countries, the U.S. current account trade balance and net financial flows match as a matter of accounting. But that’s not true at the bilateral level. Trade deficits have been large vis-à-vis China, but European investors have been the source of the largest financial flows to the U.S.
Author
Related Content


-
Acknowledgements and disclosures
The author thanks Maury Obstfeld and David Wessel for helpful comments.
The Brookings Institution is committed to quality, independence, and impact.
We are supported by a diverse array of funders. In line with our values and policies, each Brookings publication represents the sole views of its author(s).