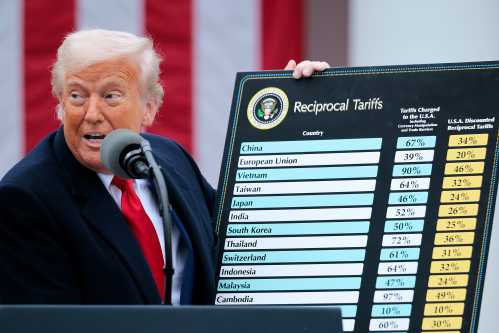


In 2025, Immigration and Customs Enforcement (ICE) sharply increased enforcement in cities across the U.S. This research paper estimates the ensuing local employment effects.
In surge cities, where arrests increased most, employment falls below its expected trajectory immediately after enforcement surges. The employment shortfall widens in the following months and shows no signs of recovery nearly one year after enforcement began.
The employment shortfall substantially exceeds direct arrests, a pattern consistent with an enforcement shock whose economic effects accumulate as workers withdraw, businesses face staffing disruptions, and local consumer demand weakens.
This report updates Shock, Awe, and Economic Fallout (SAEF) (2026) with additional data and an improved empirical design. The new evidence confirms the original finding that employment fell in the cities where enforcement surged most and shows that the shortfall continued to widen for as long as the data allow us to observe it, up to one year after an enforcement surge.
Findings
- Employment fell in the cities where enforcement surged most. In the cities where ICE enforcement surged, employment fell relative to the path those cities would likely have followed absent the surge.
- The shortfall reached 0.43% six months after the surge. The average employment shortfall in the 64 cities most affected by the enforcement surge was approximately 0.43% after six months. In a city with 3 million workers (about the size of Atlanta, Georgia), the average estimated effect corresponds to about 13,000 missing jobs. The best current evidence suggests that about half of the missing jobs would have been held by American-born workers (as shown in Appendix C).
- The effect shows no signs of recovery. After widening for six months, surge cities’ employment shortfall showed no signs of recovery. If anything, the effect continued to grow. Eleven months after the surge, the shortfall reached an estimated 0.69% for the limited number of cities where data exists.
- The employment shortfall exceeds arrests. The average job loss in surge cities is 0.43% of employment six months after the onset of enforcement, while excess arrests are only about 0.11% of the workforce, implying an arrest-to-job-loss ratio of one arrest associated with four jobs lost.
How 2025 enforcement disrupted local economies
A growing empirical literature has emerged around the 2025-2026 ICE enforcement surge, complementing this paper’s finding that community-facing enforcement generates employment losses well beyond the number of people arrested. That literature now spans multiple data sources, geographies, and methods but converges on a consistent conclusion: Visible, community-based enforcement depresses local economic activity through channels that extend far past direct removals.
The 2025 campaign—built around high volume, visible “shock and awe” tactics rather than the quieter, jail-based handoffs—intensified effects already documented in earlier enforcement episodes. Watson (2014) and Alsan and Yang (2024) found that enforcement produced a “chilling effect” whereby eligible immigrant households, including U.S. citizens, withdrew from programs like Medicaid out of fear of contact with government officials. East et al. (2023) found that Secure Communities (a 2008-2017 program, much smaller in scale than 2025 enforcement) lowered employment and wages for U.S.-born workers, as firms scaled back operations and local spending weakened. The far larger, more visible 2025 surge has magnified all of these channels.
Two new studies estimate the direct employment toll. Cox and East (2026) use Current Population Survey (CPS) data to show ICE surges reduce the employment rate of likely undocumented immigrants who remain in the U.S. by 1.3 percentage points, with negative employment spillovers to U.S.-born male workers, whose employment rate fell by 0.6 percentage points. Zooming into a single metro area, Sojourner and Rosenthal (2026) show that the enforcement surge in the Minneapolis-Saint Paul area caused a 2.8% decline in employment, a 1.9% decline in hours worked, and a 1.7% drop in in open business locations, equivalent to an estimated $106 million in lost wages.
Together, this body of work points to three mechanisms behind job losses that exceed direct removals.
First, fear drives workers to withdraw from the labor force even when they are not arrested. Cox and East’s results are themselves evidence of this: Because their CPS sample includes only people who remain in the country, the declines they measure reflect people choosing not to work rather than physical removal. De Balanzó, Rodríguez-Planas, and Roff (2026) identify visibility specifically as the trigger. Comparing areas where ICE surges consisted of arrests made in the community (“at-large”) to areas where the surge was concentrated in jail-based transfers that occur out of public view, they find that only the visible, community-based surges reduced credit card spending by 1.7 to 1.9 percentage points. Wright (2026) delves further into fear as a mechanism by showing that Spanish language and national news coverage of ICE arrests drove down foot traffic, even in the absence of, or prior to, arrests themselves.
Second, sudden worker absences can disrupt firm operations. Many businesses rely on teams of workers with job-specific knowledge, shared schedules, and interlocking tasks. When even a small number of workers are detained, stop showing up for work, or become difficult to recruit and retain, employers find themselves unable to operate at normal capacity. Firms respond by reducing hours, delaying expansion, reducing output, freezing hiring, or in some cases, closing their business outright. Sojourner and Rosenthal’s finding that 1.7% of Minneapolis-Saint Paul business locations closed after the local surge is direct evidence of this mechanism that cause job losses to exceed direct removals.
Finally, ICE enforcement suppresses local demand as consumers curtail everyday activity. Hernandez (2026) uses transaction and foot traffic data to show how disruption can spread through local demand suppression. He estimates that ICE operations in metro areas reduced weekly visits to establishments by 2.73% and consumer spending by 6.18% equivalent to $3 billion to $14 billion in lost spending nationally in the first year. Lester, Wilson, and Knaap (2026) document a similarly sharp, more localized pattern: Spending fell 20% to 25% in Los Angeles neighborhoods with large foreign-born populations following announcements of enforcement activity.
Evidence also suggests effects should not be expected to resolve quickly. Ciancio and García-Jimeno (2026) find that a 10 percentage-point increase in anticipated enforcement risk reduces consumption among Hispanic, foreign-born households by 5.3%. Their model suggests that only 42% of the potential consumption rebound would occur within a year of a complete cessation of enforcement. This result suggests that the economic effects of an enforcement surge can persist well after the arrests themselves subside, consistent with the pattern this paper documents: Surge cities’ employment shortfall kept widening for as long as it could be observed with no signs of recovery nearly a year after enforcement began.
Data and methods
With additional data, a more targeted definition of surge cities, and an improved identification strategy, this paper revisits the central question in Shock, Awe, and Economic Fallout (SAEF): What happened to employment in the cities where ICE enforcement surged relative to the path those cities would otherwise have followed?
A subsequent release of Quarterly Census of Employment and Wages (QCEW) data extends observable employment through December 2025,1 11 months after the earliest enforcement surges. These additional months allow us to estimate effects over a longer post-surge period and better assess whether surge cities showed evidence of recovery.
Alongside improved data, this analysis defines surge cities using increases in ICE arrests both in absolute terms and per worker. The intersection of the two captures both the chilling effect of absolute enforcement as well as the mechanical effect of direct labor-force removals. Finally, this analysis strips employment data of seasonal patterns and explicitly models surge cities’ upward employment trend prior to the ICE arrest surges, relative to control cities over that same period, and then extrapolates that trend forward to build the post-surge counterfactual against which 2025 surge-city employment is compared. Unless otherwise noted, methods and definitions follow those described in SAEF.
Defining surge cities
We define surge cities using the intersection of two rules: Cities must rank in the top quartile of enforcement growth both in absolute arrests and in arrests per worker, relative to each city’s own 2024 baseline.
This definition captures two effects. The absolute arrests rule captures the chilling effect: The visible presence of ICE agents in communities caused immigrant workers to withdraw from public life, reducing economic activity well beyond the workers directly arrested. The per worker arrest rule captures a second, more mechanical channel: Arrests remove people from the labor force directly. That channel is strongest where arrests are large relative to a city’s population.
This intersection definition is more targeted than either measure alone, and it is the specification we carry through the paper. Of the 341 metropolitan areas in our updated sample, 86 fall in the top quartile of one of the two measures—absolute arrest growth or per worker arrest growth—and 64 of those 86 rank in the top quartile on both, forming our surge group. The remaining metropolitan areas serve as controls. Results using absolute arrests only or per worker arrests only are reported as robustness checks and point in the same direction.
Adjusting for seasonality
SAEF’s original comparison relied on the assumption that surge and comparison cities share the same normal seasonal pattern so that seasonality cancels out of the treatment-control difference. In fact, surge cities tend to be larger and more economically diversified, while comparison cities show sharper seasonal swings. Since estimated effects are modest relative to normal month-to-month movement in city employment, accounting for seasonal patterns isolates the enforcement effect.
We adjust for seasonality using each city’s month fixed effects estimated on pre-2025 data. This is the standard approach, but it does not adjust for seasonal patterns which may also evolve year over year. To address this, we adjust employment data using the Census Bureau’s X-13ARIMA-SEATS (X-13). X-13 removes estimated, predictable seasonal variation, including seasonal patterns that grow or decline year over year. We report results using the X-13 adjustment. Appendix E describes the seasonal adjustment in more detail, and Table 3 shows both adjustments produce comparable estimates.
Estimating the employment effect
We use the Callaway and Sant’Anna (CS) staggered difference-in-differences estimator, which aligns each surge city according to the month its local enforcement surge began and compares its employment path to control cities.
The CS event study (Figure 1) shows employment in surge metros was on a modestly upward path relative to comparison metros before enforcement intensified. That path turns downward the same month enforcement arrives, and surge-city employment falls relative to comparison metros thereafter.
To test whether these pre- and post-surge trajectories are statistically distinguishable from each other and from ordinary month-to-month variation, we fit a piecewise-linear (“trend-break”) model to the CS event-study estimates, spanning the year before the local surge through six months after, with the slope allowed to change at enforcement onset. This tests whether the effect accumulates over time, not simply whether employment fell after enforcement arrived. For example, a single post-surge dip would be more consistent with a short-lived hiring pause, while a compounding effect points to workers continuing to withdraw, firms facing ongoing staffing gaps, and local demand continuing to weaken.
The trend-break analysis also identifies a distinct pre-surge trend, which forms our counterfactual under the assumption that absent the enforcement surge, employment in surge metros would have been expected to continue along that relative path. We estimate this trend using pre-surge CS event-study coefficients.
Our headline measure is the deviation from this linear extrapolated pre-surge trend six months after a city’s local surge began, the point at which all 64 surge cities can be observed. We also report the estimates at 10 and 11 months after onset, which show whether the effect keeps accumulating but rely on a smaller set of early-treated metros and should be interpreted more cautiously.
Appendices A and B report tests designed to rule out alternative explanations for the employment shortfall in surge cities: Results hold when counterfactuals are built from synthetic controls rather than extrapolated trends. The estimated trend break is fit best at and immediately after the actual surge onset rather than at other points in the window. Randomly assigning cities to surge and control groups produces an effect of similar magnitude in only one of 200 draws.
Finally, following De Balanzó, Rodríguez-Planas, and Roff (2026), we test whether effects differ between ICE arrests made in the community (“at-large”) and arrests of people already in criminal-justice custody (CAP/jail transfers). At-large arrests, the visible arrests our fear-and-disruption channel predicts should matter most, have a substantially larger effect than the less visible CAP/jail arrests.
Results
The 2025 ICE enforcement surge caused formal employment to fall in the cities where enforcement was most acute. The effect appears at the time of local enforcement onset, grows over subsequent months, and is concentrated in places that saw large increases in at-large arrests, both in absolute terms and per worker.
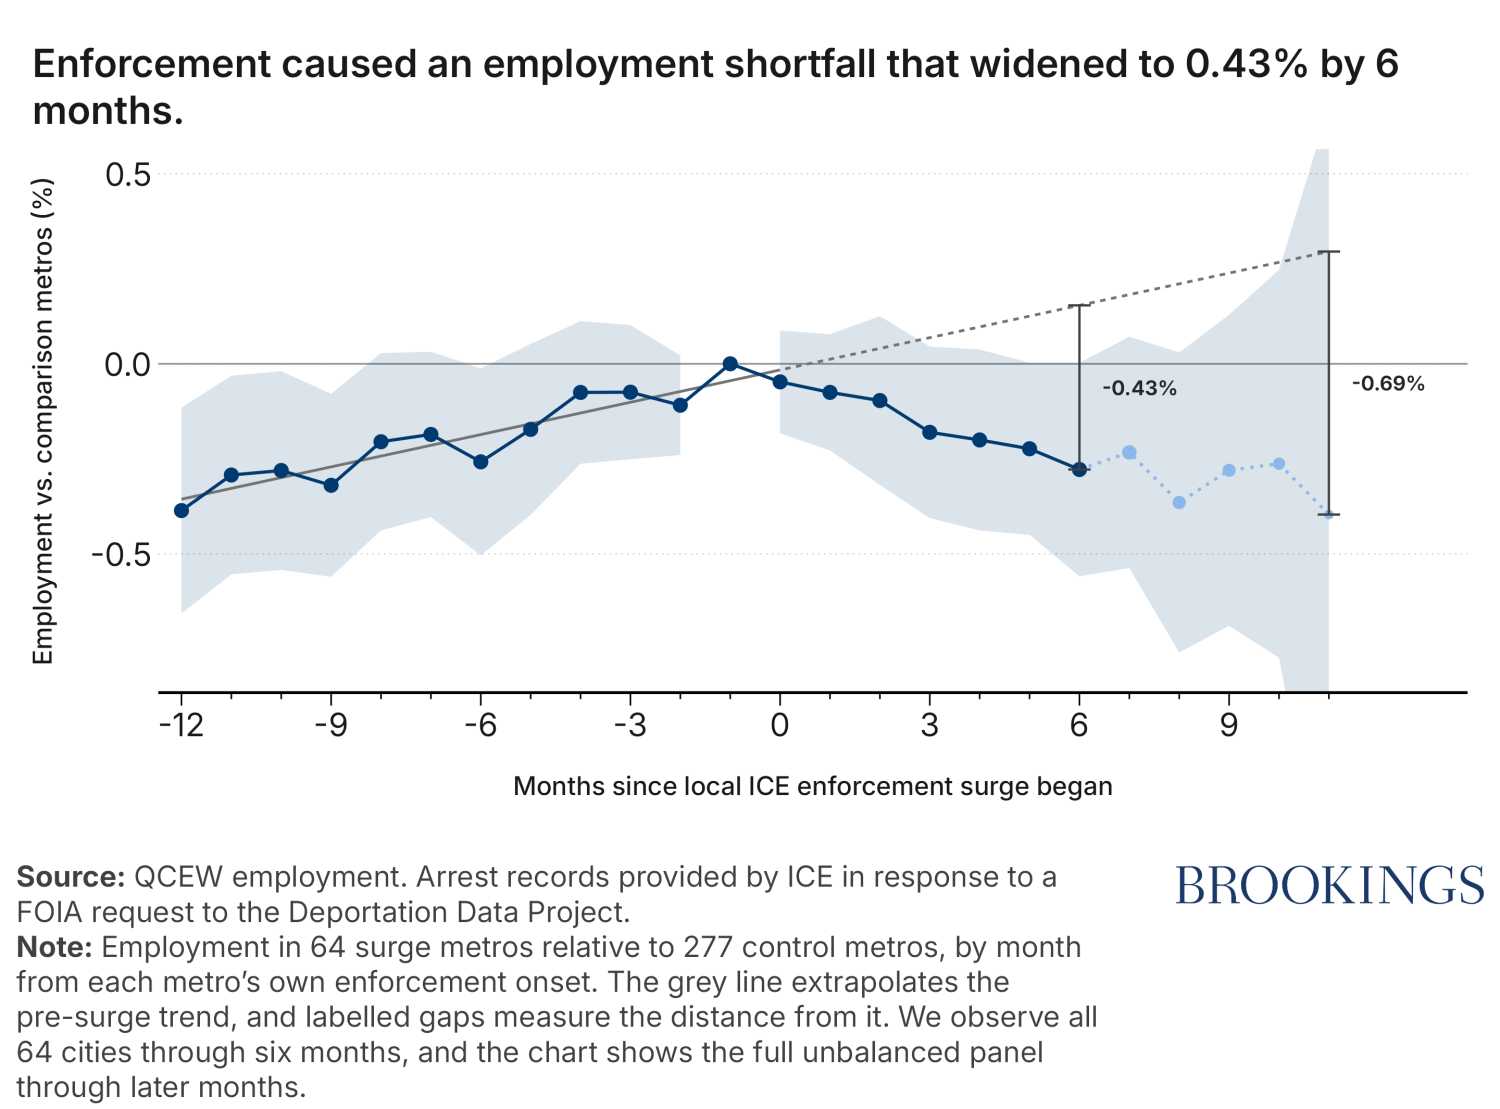
Figure 1 traces employment in surge cities relative to comparison cities from 12 months before a local surge to 11 months after. In the pre-period, the dots hug the dotted trend line closely: The relationship is essentially linear, and there is no sign of the estimates drifting apart from the trend before enforcement arrives.
Six months after the onset of a local enforcement surge, employment in surge cities dropped 0.43% below its estimated no-surge trajectory, shown as the dashed line in Figure 1. By 11 months post surge, the estimated shortfall grew to 0.69% below the counterfactual path. The confidence interval widened at 11 months because only 11 of the 64 surge cities could be observed by then, so the later estimate should be interpreted with caution. Nonetheless, the estimate is a continuation of a trajectory that widens the gap from the counterfactual path with each additional month post surge.
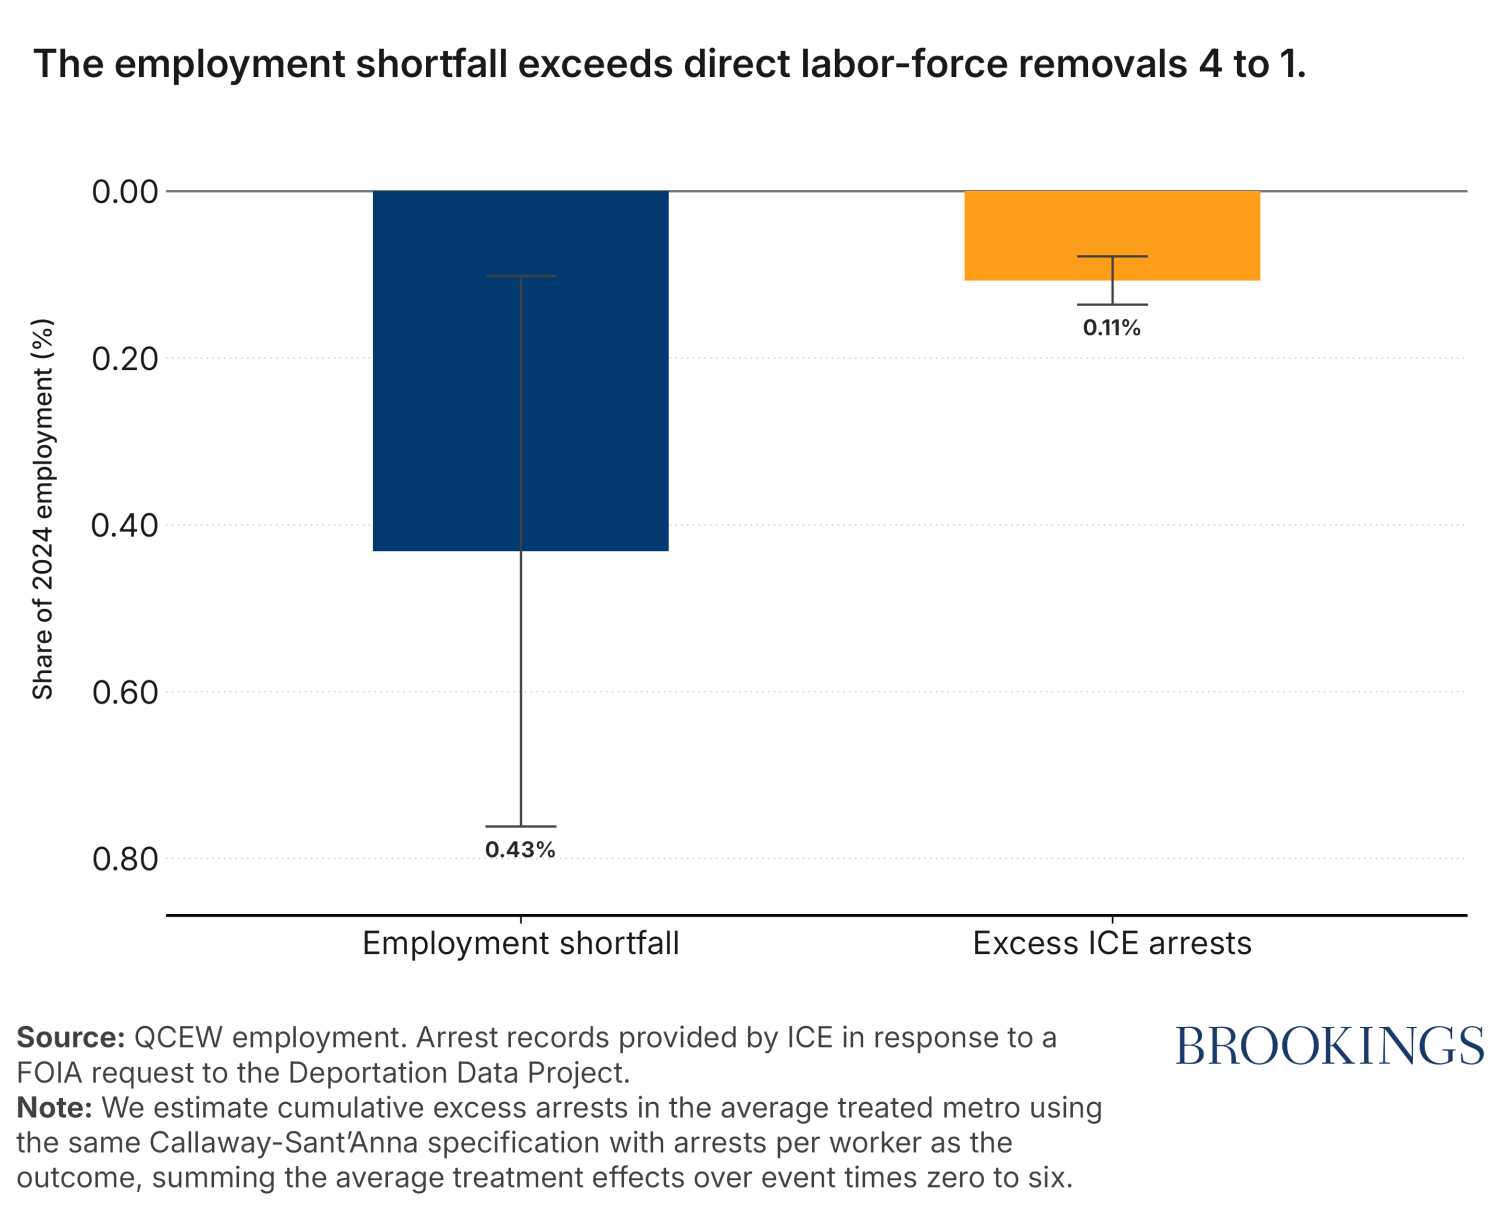
Figure 2 shows that estimated employment effects are substantially larger than the number of people arrested. It compares the employment shortfall to a matched measure of cumulative excess arrests per worker, both expressed as a percent of each city’s employment and using the same comparison cities and CS difference-in-differences design. See Appendix D for details on this calculation.
Six months post surge, the average surge city’s employment stood 0.43% below its expected path, while excess arrests over the same window equaled just 0.11% of the average city’s employment. By 11 months, the effect (among the 11 cities whose local surge began in January 2025) widened to 0.69%.
If the employment drops were caused solely by the arrested workers being removed from their jobs, then each excess arrest would correspond to roughly one lost job, under the generous assumption that every person arrested held a payroll position. But the actual employment shortfall is about four times larger than the number of excess arrests. That gap is likely an undercount of the true effect since many of those arrested were probably informal sector workers, self-employed, recent arrivals, or otherwise outside the formal labor market to begin with.
This ratio is consistent with a broader mechanism: Arrests—and the broader disruption that came with them—compound into broader labor withdrawal, business disruption, and weaker consumer demand well beyond the workers who were actually detained. Figure 3 supports this interpretation, showing that the excess job loss was driven by visible ICE enforcement in workplaces and communities, consistent with the fear and chilling effects described earlier.
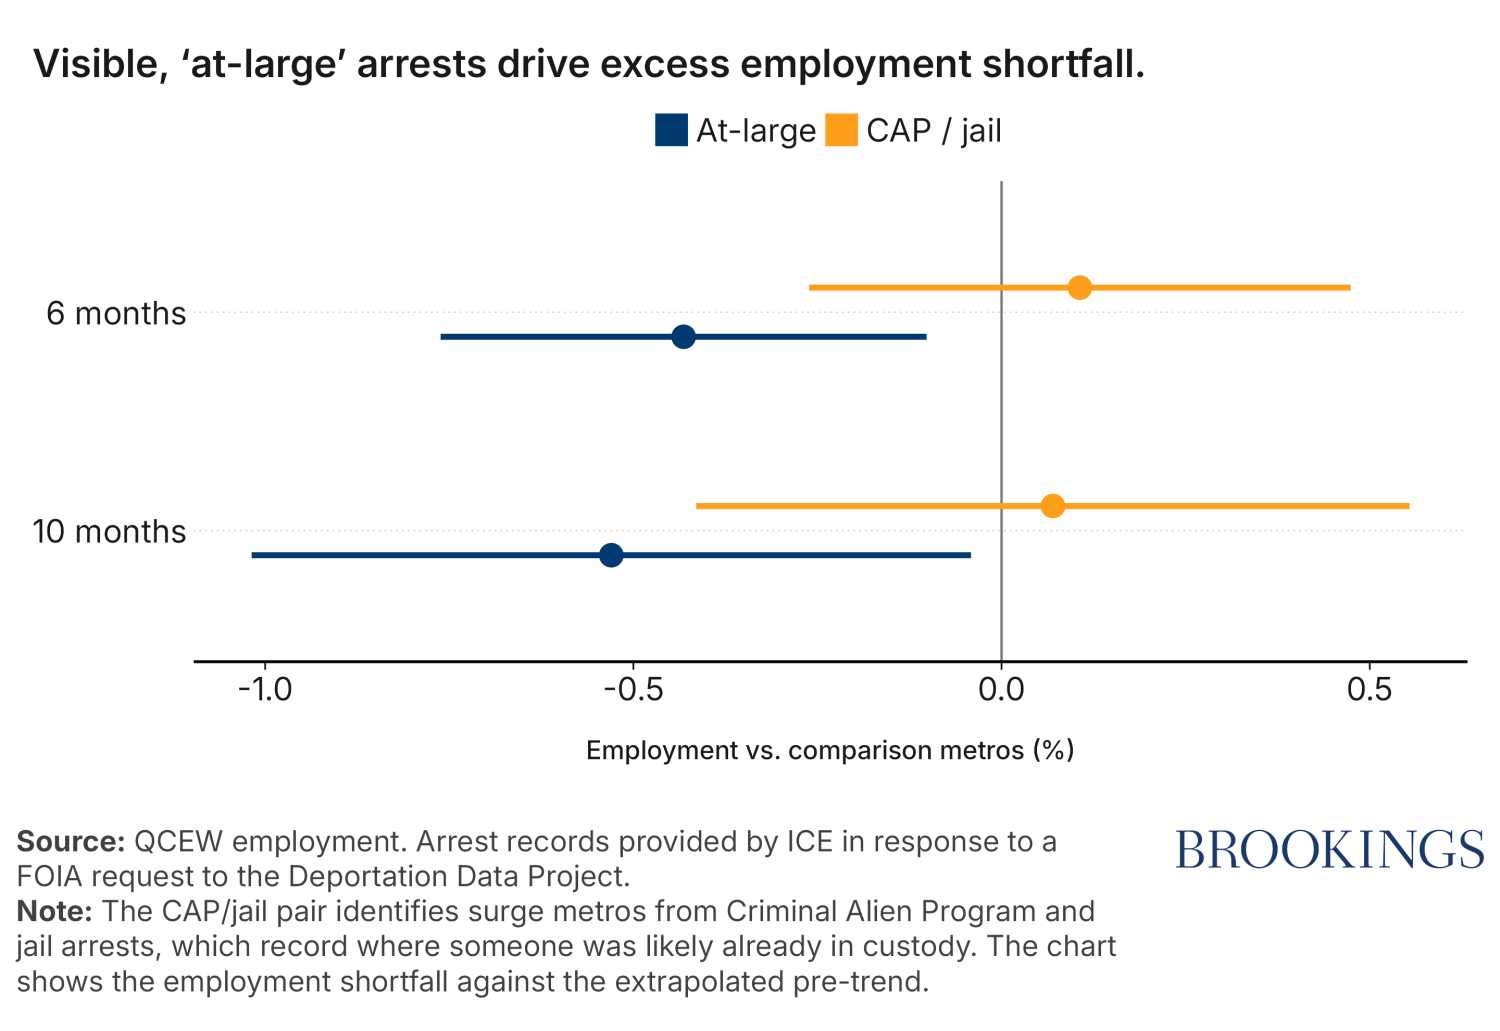
ICE arrests come in two broad types: (1) “at-large” arrests made in the community, at worksites, homes, and traffic stops, where neighbors, coworkers, and customers can see them and (2) jail-based transfers through the Criminal Alien Program (CAP), where custody changes hands out of public view. Our preferred specification defines surge cities using increases in at-large arrests, reflecting the expectation following De Balanzó et al. (2026) that employment effects are tied to visible, community-based enforcement rather than less-visible CAP arrests. Consistent with this, Figure 3 suggests that six and ten months post-surge, the employment shortfall was larger in the 64 cities defined by at-large arrests rather than with jail-based, CAP arrests.
Conclusion
The 2025 ICE enforcement surge caused a meaningful and persistent employment decline in the cities where it intensified the most. Six months after a local surge began, payroll employment fell 0.43% below its expected path. Data through December 2025 show no sign of recovery.
This employment effect is roughly four times larger than excess arrests. In other words, the direct labor market removals cannot explain the job losses observed. Instead, knock-on effects from the enforcement shock appear to have caused additional job losses as workers withdrew from public life, employers struggled to replace them, and households cut spending.
-
References
Alsan, M., & Yang, C. (2024). Fear and the safety net: Evidence from Secure Communities. Review of Economics and Statistics, 106(6),1427-1441. https://doi.org/10.1162/rest_a_01250
Callaway, B., & Sant’Anna, P. H. C. (2021). Difference-in-differences with multiple time periods. Journal of Econometrics, 225(2), 200–230. https://doi.org/10.1016/j.jeconom.2020.12.001
Ciancio, A., & García-Jimeno, C. (2026). Anticipating state action: Risk perceptions and consumption under immigration enforcement. SSRN. https://dx.doi.org/10.2139/ssrn.6299879
Cox, E., & East, C. N. (2026). Labor market impacts of ICE activity in Trump 2.0. NBER Working Paper No. 35129. https://doi.org/10.3386/w35129
De Balanzó et al. (2026). Immigration enforcement visibility and consumer spending. IEB Working Paper 2026/10. https://ieb.ub.edu/wp-content/uploads/2026/06/Doc2026-10_ok.pdf
East, C. N., Hines, A. L., Luck, P., Mansour, H., & Velásquez, A. (2023). The labor market effects of immigration enforcement. Journal of Labor Economics, 41(4), 957-996. https://doi.org/10.1086/721152
Escobari, M., Seyal, I., & Beach, P. (2026). Shock, awe, and economic fallout: The employment effects of ICE enforcement in US cities. Brookings Institution. https://www.brookings.edu/articles/ice-enforcement-employment-effects-us-cities/
Hernandez, E. (2026). ICE-ing the economy: Immigration enforcement under Trump 2.0. SSRN Working Paper. https://dx.doi.org/10.2139/ssrn.6759278
Lester, T. W., Wilson, M., & Knaap, E. (2026). The chilling effect of ICE enforcement: Evidence from high-frequency mobility and spending data in the Los Angeles region. https://bpb-us-e2.wpmucdn.com/sites.uci.edu/dist/6/5832/files/2026/03/Chilling-Effect-of-ICE-in-LA-LWK.pdf
Lightcast. (2026). Monthly metro employment series [dataset].
Rambachan, A., & Roth, J. (2023). A more credible approach to parallel trends. Review of Economic Studies, 90(5), 2555–2591. https://doi.org/10.1093/restud/rdad018
Sojourner, A., & Rosenthal, A. (2026). Impact of the DHS agent surge on Minneapolis–Saint Paul Metro Area Labor Outcomes. W.E. Upjohn Institute / North Star Policy Action. https://northstarpolicy.org/labor-outcomes
U.S. Immigration and Customs Enforcement. 2025. Arrests with Detentions [administrative data]. Provided in response to a Freedom of Information Act request to the Deportation Data Project. Berkeley, CA, and Los Angeles, CA: University of California, Berkeley and University of California, Los Angeles. https://deportationdata.org/data/ice.html
Watson, T. (2014). Inside the refrigerator: Immigration enforcement and chilling effects in Medicaid participation. American Economic Journal: Economic Policy, 6(3), 313-338. https://doi.org/10.1257/pol.6.3.313
Wright, G. C. (2026). Attention and the economic response to immigration enforcement [Working paper]. University of California, Merced. https://gregcwright-econ.github.io/files/information_shocks_ice_enforcement.pdf
Zipperer, Ben. “Trump’s Deportation Agenda Will Destroy Millions of Jobs: Both Immigrants and U.S.-Born Workers Would Suffer Job Losses, Particularly in Construction and Child Care.” Economic Policy Institute, July 10, 2025. https://www.epi.org/publication/trumps-deportation-agenda-will-destroy-millions-of-jobs-both-immigrants-and-u-s-born-workers-would-suffer-job-losses-particularly-in-construction-and-child-care/.
Authors
-
Acknowledgements and disclosures
The authors thank Michael Clemens for thought partnership on methods as well as Pierre Nguimkeu and Greg Wright for helpful comments. Giuseppe Grasso, Chidozie Ezi-Ashi, and Carlos Daboin provided outstanding research assistance, including fact-checking, code review, and replication of our findings. All errors remain our own.
-
Footnotes
- We use monthly employment estimates from Lightcast, a labor market data firm. Lightcast builds its estimates primarily from the QCEW.
The Brookings Institution is committed to quality, independence, and impact.
We are supported by a diverse array of funders. In line with our values and policies, each Brookings publication represents the sole views of its author(s).