

According to the Census Bureau, 14.3 percent of Americans were living in poverty in 2009. For the past several years, we have performed an analysis in which we simulated what would happen to the poverty rate over the next several years based on projections of the unemployment rate and the estimated relationship between the poverty rate and the unemployment rate. [2] We provide a brief update to that analysis here. The bottom line of this analysis is that the recession is likely to have a dramatic impact on poverty over the next several years.
Our earlier simulations suggested that the overall poverty rate would increase from 12.5 percent in 2007 to nearly 16 percent by 2014 and that the child poverty rate would increase from 18 percent in 2007 to nearly 26 percent in 2014, adding about 10 million people total and 6 million children to the ranks of the poor by the middle of the current decade. Despite the fact that our simulation accurately predicted the poverty rate for 2009, we emphasize that there is a strong possibility that the estimates we present for future years are conservative for several reasons. First, both CBO and OMB estimates of future unemployment rates have become somewhat more pessimistic since last year, especially for 2012 and beyond. Second, the length of the downturn in economic activity and its impact on labor force participation are likely to further exacerbate the poverty problem.
In light of the expected increases in poverty rates, we believe that programs such as Food Stamps and TANF that can help to buffer the effects of the recession on lower-income families should be maintained or increased in these difficult economic times. Recent research using an alternative measure of poverty that includes more government benefits demonstrates that these programs have made a big difference in protecting the poor from greater destitution. [3]
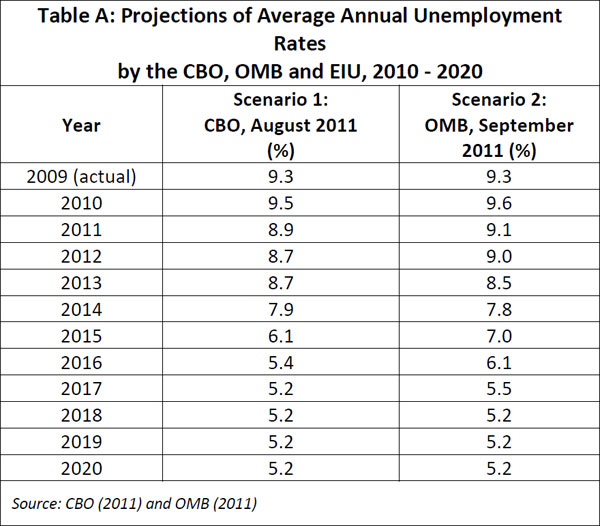
With the economic recovery stagnating, projections of the unemployment rate over the next 5 to 10 years tell a story of lingering high unemployment (see Table A). How will these elevated levels of unemployment affect poverty?
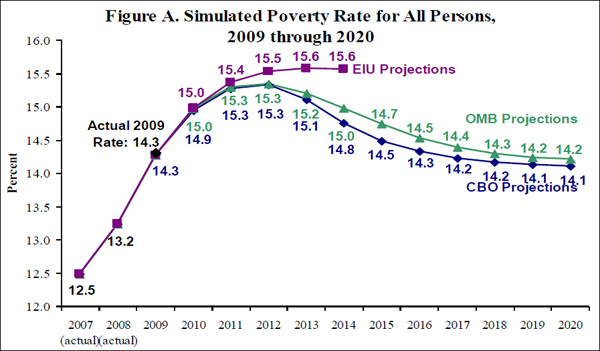
Our analysis from last year tells a depressing story (see Figure A). Comparing an overall poverty rate of 12.5 percent in 2007 to a likely rate of 15.6 percent in 2014 suggests that the recession will add nearly 10 million people to the ranks of the poor by mid-decade. [4]
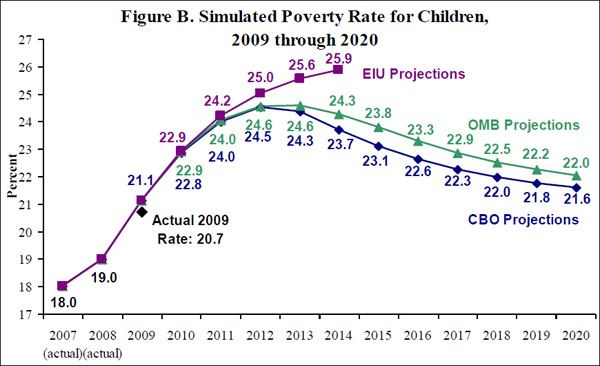
The outlook for children is even worse. We find that the poverty rate for children will rise rapidly over the next few years, reaching its peak in 2014 at just under 26 percent (see Figure B). Comparing a child poverty rate of 18 percent in 2007 to a likely rate of 26 percent in 2014 means that the Great Recession will have added about 6 million more children to the ranks of the poor by mid-decade. [5]
Given the likelihood that the current slowdown will persist well into the coming decade and concerns that the structural unemployment rate may be increasing as the result of the length and depth of the recession, as worrisome as these projections are, they may actually be slightly optimistic. Thus, our poverty rate projections should be viewed as conservative estimates of how much higher the poverty rate will go and, equally important, how long these higher poverty rates will endure.
Last year we wrote that the recession is likely to have a severe and long-lasting impact on poverty in the United States. Given the stagnant state of the recovery and the new, more pessimistic projections of unemployment over the next several years, we believe this is truer today than it was a year ago.
Footnotes
[2] Monea and Sawhill (2009)
[3] Isaacs (2011)
[4] According to the U.S. Census Bureau (2009a), the U.S. population in 2014 will be about 318.5 million (note that we use the constant net international migration population projection series). Thus, we estimate that there will be nearly 50 million people in poverty in that year. In contrast, if the poverty rate had remained at its 2007 level of 12.5 percent, there would have been just under 40 million people in poverty in that year. Note that this analysis does not take into account population growth between 2007 and 2014. Taking this consideration into account suggests an increase in the number of people in poverty of about 13 million over this time period, as there were about 37 million people in poverty in 2007 (U.S. Census Bureau, 2010).
[5] According to the U.S. Census Bureau (2009b), there will be about 76 million children living in the U.S. in 2014 (note that we use the constant net international migration population projection series). Thus, we estimate that there will be nearly 20 million children in poverty in that year. In contrast, if the poverty rate had remained at its 2007 level of 18 percent, there would have been about 14 million poor children in that year. Note that this analysis does not take into account population growth between 2007 and 2014 and that taking this consideration into account suggests an increase in the number of children in poverty of about 7 million over this time period, as there were about 13 million poor children in 2007 (U.S. Census Bureau, 2010).
Resources
Blank, Rebecca M. 2009. “Economic Change and the Structure of Opportunity for Less-Skilled Workers.” In Changing Poverty, Changing Policies, Maria Cancian and Sheldon H. Danziger, eds. New York: Russell Sage Press.
Congressional Budget Office. 2011. “The Budget and Economic Outlook: An Update.” Washington, D.C.
Economist Intelligence Unit. September 8, 2010. Country Data for the United States.
Isaacs, Julia. August 8, 2011. “Better Data, Better Outcomes: How Public Policy is Helping Poor Children.” Spotlight on Poverty and Opportunity. http://www.spotlightonpoverty.org//users/spotlight_on_poverty/documents/Isaacs_Spotlight_08082011.pdf (accessed September 12, 2011).
Monea, Emily and Isabel Sawhill. 2009. “Simulating the Effect of the ‘Great Recession’ On Poverty.” The Brookings Institution. https://www.brookings.edu/papers/2009/0910_poverty_monea_sawhill.aspx (accessed September 14, 2010).
Office of Management and Budget. 2011. “Mid-Session Review: Budget of the U.S. Government: Fiscal Year 2011.” Washington, D.C.
U.S. Census Bureau. 2010. “Poverty Status, by Age, Race and Hispanic Origin.” http://www.census.gov/hhes/www/poverty/data/historical/hstpov3.xls (accessed September 14, 2010).
U.S. Census Bureau. 2009a. “Projections of the Population and Components of Change for the United States: 2010 to 2050.” http://www.census.gov/population/www/projections/files/nation/summary/NP2009-T1-C.xls (accessed September 14, 2010).
U.S. Census Bureau. 2009b. “Projections of the Population by Selected Age Groups and Sex for the United States: 2010 to 2050.” http://www.census.gov/population/www/projections/files/nation/summary/NP2009-T2-C.xls (accessed September 14, 2010).
The Brookings Institution is committed to quality, independence, and impact.
We are supported by a diverse array of funders. In line with our values and policies, each Brookings publication represents the sole views of its author(s).