As of April 2, 2025, FEMA has removed the information on Community Disaster Resilience Zones from its website. It is unclear if this is temporary or permanent.
On September 6, 2023, the Federal Emergency Management Agency (FEMA) designated 483 census tracts as Community Disaster Resilience Zones (CDRZs). The designations followed Congress’ amendment of the Robert T. Stafford Disaster Relief and Emergency Assistance Act to mandate that FEMA take a “data-based approach” to locate and assist communities “most at risk to natural disasters and climate impacts.”
While communities at high risk for disasters desperately need assistance to become more resilient, the design of CDRZs excludes some of the most vulnerable communities across the U.S., and in particular, many majority-Black and Latino or Hispanic communities. Analyzing census data in combination with the National Risk Index and the Climate and Economic Justice Screening Tool (both of which were used in the CDRZ selection process), this report explores the distribution of social vulnerability and racial demographics across CDRZs. By relying on disaster risk data driven by estimates of property damages, FEMA’s selection process for CDRZs underemphasizes social vulnerability and prioritizes property over people.
These disparities in selection are likely to reproduce inequities already present in disaster management policy. CDRZs represent a major effort to invest resources for resilience initiatives in communities that need them most. However, if there are racial inequities in the selection of these zones, then CDRZs will act as a continuation of disinvestment in Black and Latino or Hispanic communities, further perpetuating the racial wealth gap. While FEMA has designated an additional 284 CDRZs for tribal nations and territories (going some way toward making the selections more equitable), in future tranches, FEMA has an opportunity to adopt a selection process that centers social vulnerability and targets communities that have been historically disadvantaged. More broadly, disaster management agencies—particularly at the state and local levels—should act on the general lesson that targeting programs to address social vulnerabilities makes for more effective disaster management policy.
What are Community Disaster Resilience Zones and how were they selected?
CDRZs are supposed to build disaster resilience in the U.S. by providing geographic focus for financial and technical assistance from public, private, and philanthropic agencies and organizations. Investments are meant for the planning and implementation of projects in the most at-risk and in-need jurisdictions to help reduce the impact of climate change and other natural hazards.
For example, a CDRZ designation lowers the barriers for communities to access Building Resilient Infrastructure and Communities (BRIC) grants, and increases the benefit of the grant by raising the federal cost share. Though the initial implementation has had relatively limited direct benefits, the broader ambitions of the amendment is to crowd in philanthropic and private capital by signaling need to mission-based investors and lowering the cost of investment for private capital. The act may also be more expansively used to target disaster risk reduction assistance in future federal or state policies. In this way, CDRZs could share some characteristics with Opportunity Zones, which provided investors with tax breaks and other incentives to invest in economically distressed communities. According to the legislation, CDRZs will be selected each year, and designated for a period of five years in total.
To select the CDRZs, Congress directed FEMA to take a data-based approach, which ensured that there was at least one CDRZ in each state, spread across urban, rural, coastal, and inland areas. FEMA has described their selection methodology as follows:
- Using the National Risk Index (NRI) to identify census tracts that are in the top 50 nationally or within 1% of the NRI scores within the state.
- Removing all census tracts that were not classified as disadvantaged by the Climate and Economic Justice Screening Tool (CEJST), unless this resulted in no designations in the state.
This methodology has several limitations that have biased the first round of CDRZs away from some of the most vulnerable communities.
First, the NRI overemphasizes property values and underemphasizes social vulnerability when estimating risk. This means that many of the census tracts categorized as at the highest risk are high-income neighborhoods or commercial corridors. Several organizations identified this limitation during the public solicitation process in the methodology design phase. Indeed, according to the Southern Environmental Law Center, estimates of property values “drive over 80% of the expected annual loss in tracts designated as high and very high risk.” While the NRI includes data on social vulnerability and resilience to offset the effect of property values, it is well documented that these factors are less influential on NRI scores. Several of the public comments emphasized the need to either adapt the NRI to weight social vulnerability higher or supplement it with additional datasets.
Second, the legislative mandate to include “fairness” in geographic distribution is likely to come at the expenses of targeting the most vulnerable communities. In this context, “fairness” is geographical representation of states, including considerations for rural versus urban areas. For example, the requirement to include at least one CDRZ in each state means that some CDRZs are not identified as disadvantaged by the CEJST nor have a very high NRI score. Research has shown that the zones are significantly more rural than the national average, particularly for states in the Midwest.
CDRZs miss many of the most vulnerable census tracts
FEMA’s methodology to select CDRZs demonstrate limitations that hamper how effective the zones are at capturing the most in-need census tracts. To understand how effective the process was at capturing social vulnerability, this report compares CDRZs with census tracts identified as disadvantaged by the Climate and Economic Justice Screening Tool (CEJST), designed by the Council on Environmental Quality. In contrast to the NRI, the CEJST provides a more comprehensive picture of social vulnerability. The CEJST identifies census tracts as disadvantaged if they exceed at least one of eight critical thresholds across categories such as climate change, energy, health, housing, legacy pollution, transportation, water, wastewater, and workforce development. While the CEJST includes an estimate of loss and damage from disasters, these are treated as a category of risk alongside the other indicators.
This is an important distinction because social vulnerability can have a large effect on the severity of disaster impacts and the success of post-disaster recovery. Developing disaster policy is complex because risk emerges not just from disasters themselves, but in combination with underlying social and economic conditions. The CEJST critical thresholds were designed to capture this dynamic production of risk. Indeed, the factors listed above describe the social vulnerability profile of each census tract, providing a nuanced overview of the diverse factors that amplify climate change and disaster impacts. Factors such as housing insecurity and underlying health conditions mean that even small disasters can have substantial impacts, displacing a household or even pushing them into poverty. Unlike the NRI, which provides one overall risk score centered around damage to assets as a proxy for social and economic impacts, CEJST provides a sliding scale of vulnerability. This measure is more accurate and dynamic, showing how many categories of vulnerability a community scores highly in, and which categories are driving vulnerability.
Map 1 below demonstrates how CDRZs miss many of the most vulnerable census tracts when taking a more dynamic measure of social vulnerability. The map shows CDRZ locations in the contiguous U.S. outlined in blue, while the shaded areas show which tracts the CEJST categorizes as disadvantaged. Tracts shaded in light green are disadvantaged but below the average number of critical thresholds surpassed for all disadvantaged tracts. These tracts are considered vulnerable compared to all other tracts in the U.S., but less severely compared to the most vulnerable. Tracts that surpass a total number of critical thresholds above the average are shaded in gradations of yellow, with darker yellow indicating highly vulnerable tracts that scored one and two standard deviations from the mean. These census tracts can be considered highly vulnerable. Note that there are also CDRZs in Puerto Rico, Hawaii, and Alaska, but these were excluded from the analysis for simplicity. Moreover, this analysis excludes the 284 CDRZs that FEMA announced on January 10, composing tribal nations and territories, as these were selected based on tribal status rather than data for risk.
While the majority (84.1%) of all CDRZs are identified as disadvantaged, the number of critical thresholds surpassed for CDRZs is, on average, lower than most disadvantaged tracts. The average number of surpassed thresholds for CDRZs is 3.74 (out of a possible eight), and for disadvantaged tracts, it is 4.38.
Locations of CDRZs and CEJST ‘disadvantaged’ communities
Jump to a metro area
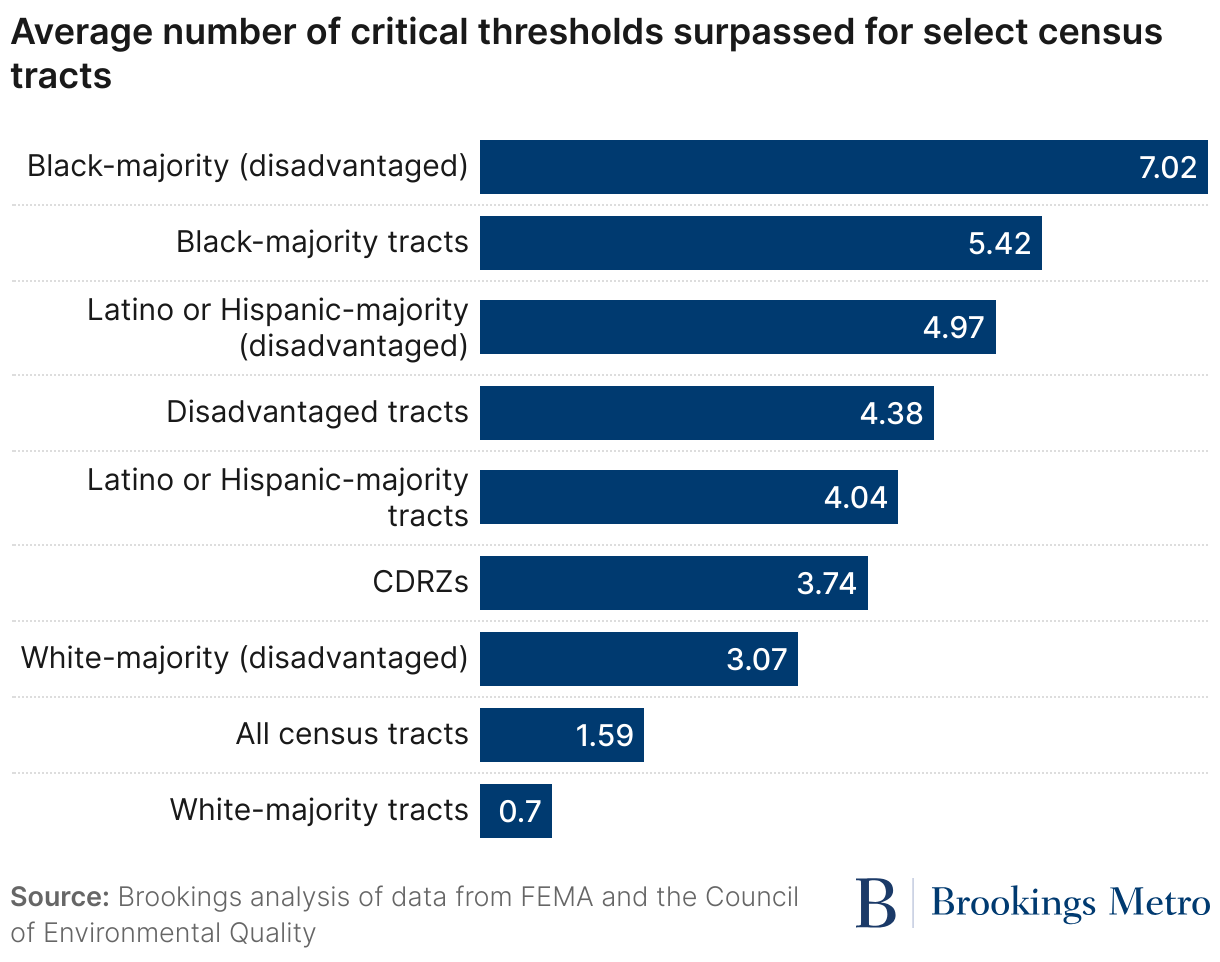
Not only are some of the more vulnerable census tracts excluded, but these also tend to be Black- and Latino or Hispanic-majority communities. This is because these census tracts are more likely to have higher rates of social vulnerability but lower property values, and at least partially reflects the cost of mandating that FEMA maintain geographic fairness rather than selecting the most vulnerable tracts. For example, 77.2% of all 6,206 Black-majority census tracts are categorized as disadvantaged, compared to 81.27% of Latino or Hispanic-majority census tracts and 22.73% of white-majority tracts. Figure 1 shows that for Black-majority census tracts, the average number of critical thresholds surpassed was 5.42 on average, and 7.02 for tracts identified as disadvantaged—higher than the CDRZs and the white-majority census tracts identified as disadvantaged. For white-majority tracts, the average number of critical thresholds surpassed was substantially lower, at 0.7.
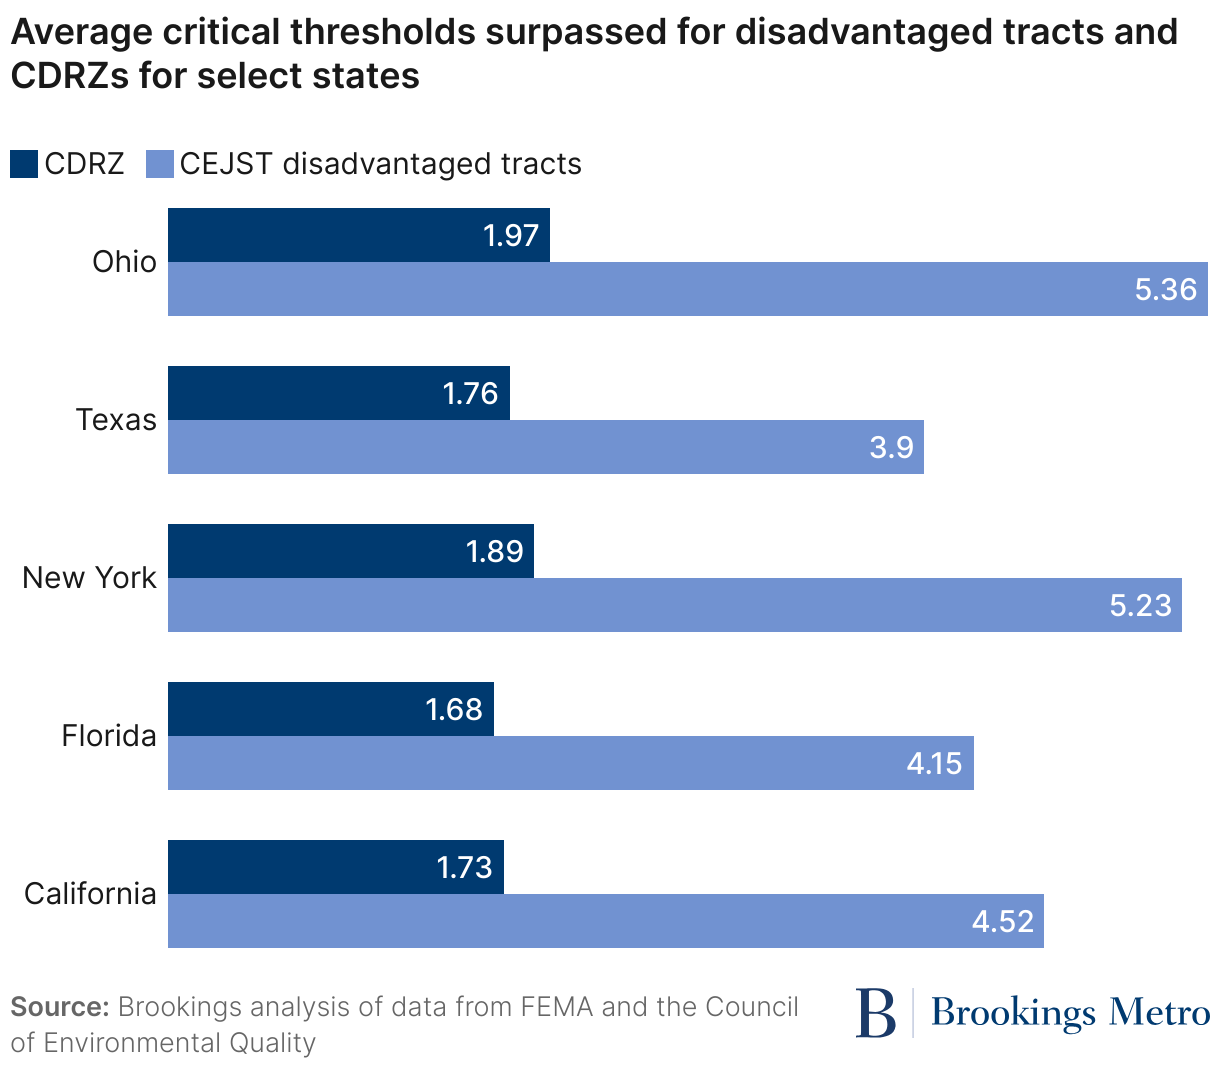
In some states, including Colorado, Massachusetts, and Delaware, the average number of critical thresholds surpassed is substantially higher for non-CDRZ census tracts. In the four CDRZs in Massachusetts, for example, only one critical threshold has been surpassed, yet the average number of thresholds surpassed for disadvantaged tracts in the state is close to five. While it is difficult to determine representative averages for CDRZs within each state because of small sample sizes (some states only have one CDRZ), looking across the five states with the largest number of CDRZs, it is clear that CDRZs are capturing tracts with lower levels of social vulnerability at the state level. For example, Figure 2 shows the average number of thresholds surpassed for CDRZs, all census tracts, and disadvantaged tracts in California (where there are 55 CDRZs), Florida (32), New York (24), Texas (32), and Ohio (23). Ohio has the greatest disparity between the two, with disadvantaged tracts having an average of 5.36 thresholds surpassed compared to 1.97 for CDRZs.
CDRZs underrepresent Black- and Latino or Hispanic-majority communities nationally and across most states
Underemphasizing social vulnerability when selecting census tracts has substantial impacts on the racial demographics of CDRZs, and thus, the capacity of the CDRZ designation to advance goals on racial justice. Figure 3 shows the average total number of thresholds surpassed by the percentage of nonwhite residents in a census tract, demonstrating that social vulnerability is highly correlated with race. For census tracts with over 90% nonwhite residents, the average total number of thresholds surpassed is 6.32, compared to 0.81 for tracts with less than 1% nonwhite residents.

Nationally, about 0.66% of all census tracts are CDRZs, covering areas where roughly 2,180,167 Americans reside. The census tracts covered by CDRZs are, on average, more racially diverse than the nation as a whole, with 16.57% of individuals living in CDRZs identifying as Black, and 19.77% identifying as Latino or Hispanic (Figure 4).
However, compared to the racial demographics of CEJST disadvantaged tracts, CDRZs include less racial and ethnic diversity than would be expected. Census tracts categorized as disadvantaged have higher shares of Black and Latino or Hispanic residents. For example, 77.2% of all Black-majority and 81.27% of all Latino or Hispanic-majority census tracts across the U.S. are categorized as disadvantaged, yet only 10.46% and 12.55% of CDRZs are Black- or Latino or Hispanic-majority, respectively.

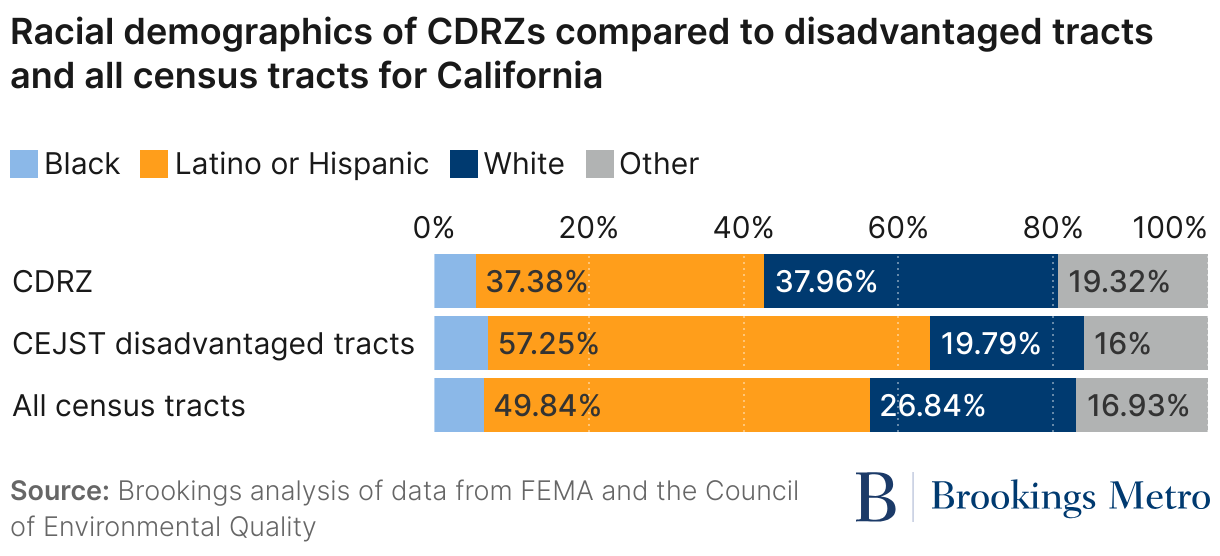
These disparities are consistent across most states. In 26 (or 53% of states in the contiguous U.S. plus Washington, D.C.), CDRZs have fewer nonwhite residents compared to the state average, and in 47 states, there are fewer nonwhite residents compared to the average for census tracts identified as disadvantaged. In some states, these disparities are more pronounced. Figure 5 shows the racial demographics of CDRZs, CEJST disadvantaged census tracts, and all census tracts for states with the highest number of CDRZs. In California, for example, Black and Latino or Hispanic residents comprise 64% of all residents in disadvantaged tracts, but only 43% of residents in CDRZs. In other words, while in most cases CDRZs reflect the racial demographics of the state, they include fewer nonwhite residents than the most vulnerable census tracts.


CDRZs and proportion of Black and Latino or Hispanic residents by census tract
Jump to a metro area
Is the CDRZ model repeating some of the Opportunity Zones program’s mistakes?
The Opportunity Zones (OZ) program was somewhat of a precursor to the CDRZ model, and holds lessons for where and how a place-based model to attract investment can go wrong. At the end of 2017, Congress passed, and President Donald Trump signed into law, the Tax Cuts and Jobs Act, which created the OZ program. It offered investors tax benefits for investing unrealized capital gains in “distressed” areas. The OZ program was meant to address market failures and spur development in undercapitalized communities that have long struggled to draw in investment.
While a substantial amount of investment has flowed to OZs under the program, aside from potentially important effects on residential real estate, it is unclear whether these dollars represent additional investment that would not otherwise have occurred. Ultimately, the evidence on benefits to residents living within OZs is limited.
This is partly because of the structure of the Tax Cuts and Jobs Act, which enabled each state governor to propose up to 25% of the total number of Low-Income Community (LIC) census tracts to be designated as OZs, with an additional 5% of OZs chosen that are contiguous non-LICs. While seemingly a fair process, governors were allowed a high degree of discretion in selection. Studies have shown that governors tended to propose tracts where voters aligned with their own political party, and in already gentrifying areas with higher home prices and higher levels of educational attainment.
The data for CDRZ selection indicate a similar pattern in many states, even though the process was data driven and, for better or worse, did not involve state or local governments in the designation process Importantly, the OZ experience demonstrates the need for better accounting of outcomes. Across the more than 8,700 zones, the federal government neglected to collect project information, instead relying on self-reporting by advocacy groups and others. For a place-based model for disaster policy to be effective, it requires stronger mechanisms for reporting, monitoring, and evaluation—all currently absent from the CDRZ amendment.
If successful in shifting patterns of resilience funding, the CDRZ designation is likely to perpetuate racial disparities
The CDRZ designation is a potential lifeline for communities at the forefront of disasters. As the intensity and frequency of extreme weather increase, more and more communities are contending with inefficient infrastructure and underlying social challenges that are amplifying the risks a disaster will cause pronounced loss and damages, displace households, and entrench poverty. By reducing the barriers to federal funding and signaling need to the philanthropic and corporate community, CDRZs are a powerful tool to raise the resilience of the country’s most vulnerable communities.
However, as this report has shown, the first tranche of CDRZ designations has missed many of the most vulnerable communities. This has real consequences for climate resilience and racial justice. The CDRZ designation could impact which communities are prioritized for investments in disaster resilience, shaping the landscape of disaster vulnerability and risk across the U.S. and potentially leaving highly vulnerable, but non-CDRZ communities, behind. While it is possible that having at least one CDRZ within a county could generate spillover effects for other tracts, we currently do not have data to assess whether this is a likely outcome.
For CDRZs, there are other questions around implementation. Some researchers have shown that CDRZs typically span more than one government type, and there are open questions around which types of organizations will be involved in applying for funds, how activities will be integrated with other investments across the state and local level, and the extent to which CDRZs will be supported in cases where local capacity is limited. Crucially, it is unclear how aware public leaders at the state and local level are of CDRZs, even among local decisionmakers operating in areas that fall within a CDRZ designation.
Several equity concerns have also been raised about the CDRZ program from public comments, including:
- Risk of exacerbating inequities. There are concerns that the program has the potential to either remediate or exacerbate historic inequities in funding access and exposure to climate impacts.
- Overemphasis on property values. The use of Expected Annual Loss from the NRI in determining CDRZs may favor areas with high property values, potentially at the expense of human impacts.
- Urban-rural disparities. Urban areas with more resources and experience may be better positioned to secure funding, potentially disadvantaging rural communities.
- Administrative burdens. Compliance and reporting requirements may be challenging for low-capacity communities, potentially leading to more funding going to affluent areas.
- Displacement concerns. There are worries about potential gentrification and displacement impacts of resilience projects in CDRZs.
Furthermore, the community resilience component of the NRI, which is measured at the county level, has the unintended effect of averaging out and minimizing the social vulnerability of specific census tracts within a county. This can result in highly vulnerable communities being overlooked if they are located in a county with high overall resilience.
Overlooking a vulnerable community: The case of Independence Heights, Houston
The approach FEMA has taken to select CDRZs was top down and locally disengaged, resulting in many vulnerable communities not being included. Houston’s Independence Heights, a historically Black-majority neighborhood, is one of those missed communities. Each of the four census tracts that compose the neighborhood are considered disadvantaged by the CEJST, with the neighborhood exceeding an average of 5.5 thresholds. And the identity of Independence Heights, the first Texas municipality incorporated by African Americans, has been slowly eroded by displacement and gentrification following decades of disinvestment.
Honorary Mayor Tanya Debose—a descendant of the town’s original residents and executive director of the Independence Heights Redevelopment Council before her passing in January 2025—witnessed legacy residents, largely Black and low-income, being priced out. The process began after the city of Houston annexed Independence Heights in 1929, and has recently accelerated. Independence Heights went from 60% non-Hispanic Black residents in 2000 to 33% in 2019. While the neighborhood is still above the citywide percentage of just over 20% non-Hispanic Black residents, the demographic composition of the city is drastically different.
Although Independence Heights has a neighborhood resilience plan, according to Debose, it does not contain input from residents who dedicated significant time to the planning process. This failure means that the plan poorly addresses local needs. What is most significantly missing are any plans to adapt infrastructure to mitigate the burden of flooding due to a highway built through the middle of the neighborhood during the construction of the interstate highway system in the mid-20th century under the Federal-Aid Highway Act of 1956. Planners routed highways like this one through Black neighborhoods, labeling them as “blighted” areas, which led to large-scale displacement and flooding issues due to the disruption of natural drainage patterns, leaving these communities disproportionately vulnerable to flood damage. Indeed, according to the CEJST, two of the census tracts in the neighborhood are above the 96th percentile for flood risk. That is exacerbated by other social factors such as poor health, with each tract above the 96th percentile in diabetes risks, heart disease, and low life expectancy. The damage caused by these and other urban planning decisions have depressed local property values, reduced investment within the community, and created the conditions for gentrification.
The case of Independence Heights demonstrates a community that should be a prime candidate for a CDRZ designation. By missing communities like this one that have borne decades of damages from policy legacies, the CDRZ program risks entrenching—rather than alleviating—inequities in exposure to risk. Policies like CDRZs should be tools for communities to access vital federal and private sector funding to strengthen the assets in their communities in ways that benefit residents. Instead, as our analysis shows, by sidelining these highly vulnerable communities in the distribution of federal resources, CDRZs are also inadvertently contributing to mechanisms of disinvestment and, ultimately, displacement.
FEMA has an opportunity to take a more equitable approach in the next round of CDRZ designations
FEMA is expected to continue making CDRZ designations over 2025 and beyond. The next round (the third) is an opportunity to remedy some of the failings of the first round by adopting an approach more deeply rooted in a commitment to equity. It can do this through placing a greater emphasis on social vulnerability by complementing the NRI with other data sources, including a greater reliance on CEJST-type tools that capture social vulnerability. With federal actions reducing public access to data on environmental justice, one option is the Environmental Defense Fund and Texas A&M University’s Climate Vulnerability Index, a comprehensive tool that combines climate risk and social vulnerability data.
Moreover, rather than considering social vulnerability as a binary, FEMA and other state and local agencies could prioritize resilience investments in communities that have higher rates of multiple vulnerability categories. The case study of Independence Heights is not only a reminder of the necessity for data that can identify the most in-need communities, but also the need for procedural justice. Resilience efforts in communities need to not only include those residents, but also incorporate their knowledge of local risks and priorities. Residents are often best placed to understand the challenges they face when a disaster occurs and how funding could be used to address those risks.
FEMA should also take greater steps to engage more intentionally with communities designated as CDRZs to avoid the failures of Opportunity Zones, including by:
- Expanding community capacity to take advantage of funding.
- Tracking the types of programs that were developed because of the CDRZ designation and making that information publicly available.
- Assessing the CDRZ designation benefits, including the distribution of those benefits across communities.
Taking these actions, FEMA can help ensure that this new approach to disaster resilience funding reduces, rather than exacerbates, underlying inequities in disaster impacts and access to funding, particularly along lines of race and ethnicity. Local and state agencies can also learn from this policy, centering social vulnerability in future programs. Ultimately, policies are inherently shaped by the values and priorities of those who create and implement them. In the absence of deliberate and intentional planning that centers equity and justice, existing social and racial inequities are replicated and often exacerbated, further marginalizing vulnerable communities.
This report is dedicated to the legacy of Mayor Tanya Debose, executive director of the Independence Heights Redevelopment Council.
Authors

The Brookings Institution is committed to quality, independence, and impact.
We are supported by a diverse array of funders. In line with our values and policies, each Brookings publication represents the sole views of its author(s).