Sub-Saharan Africa’s GDP growth forecasts are down. In its latest forecasts of the region’s economies, the IMF revised its 2016 growth estimates down to 3.0 percent from 4.3 percent six month ago (Figure 1). The last time the region achieved a similar growth rate was in 1999 (2.8 percent).
Importantly, the expected slowdown largely reflects the impact of more difficult external economic environment on African economies and, in particular, the effects of a sharp drop in commodity prices, the slowdown in China, and of tighter financial conditions.
Figure 1. Sub-Saharan Africa real GDP growth forecasts
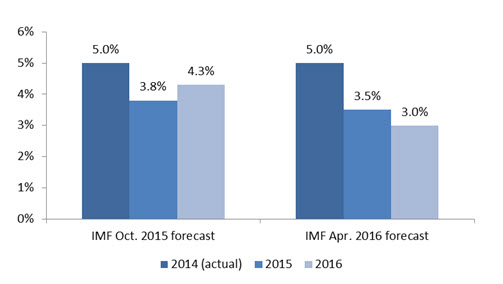
Source: IMF World Economic Outlook, April 2016 and Sub-Saharan Africa Regional Economic Outlook, October 2015
The lower growth forecasts are on the back of a long robust growth period in the region. Between 2004 and 2011, sub-Saharan Africa experienced 6.2 percent growth. Since 2012, however, growth in the region slowed down to 4.5 percent between 2012 and 2015. Africa is not alone, though: This pattern of boom and subsequent slowdown was observed in every emerging region in the globe. This doesn’t mean that these changes are insignificant, though. If the IMF forecasts for 2016 materialize, sub-Saharan Africa will experience a growth reversal of 2 percentage points in 2012-2016 compared to 2004-2011.
Figure 2. Growth in Sub-Saharan Africa (annual GDP growth, in real terms)
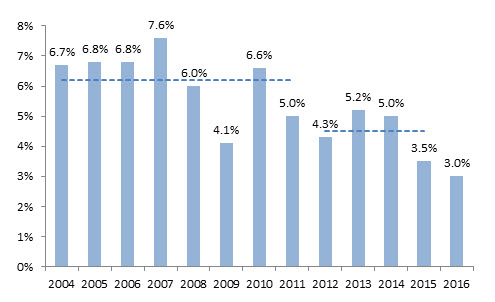
Source: IMF World Economic Outlook
But how much of the region’s growth is driven by external factors?
To answer this question, the Africa Growth Initiative has partnered with Brookings-CERES Economic and Social Policy in Latin America Initiative (ESPLA) to study the role of external factors in explaining output fluctuations in sub-Saharan Africa. The analysis focuses on the seven largest economies (SSA-7), which account for three quarters of sub-Saharan Africa’s GDP (Angola, Ghana, Kenya, Nigeria, South Africa, Ethiopia, and Tanzania). For this more detailed analysis, see here.
The key, initial findings of the study are:
Almost half of sub-Saharan Africa’s output fluctuations since 1998 can be explained by a small set of external factors—namely, GDP growth in G-7 countries, GDP growth in China, oil and non-oil commodity prices, and borrowing costs for emerging economies in international capital markets.
Figure 3 illustrates that this small set of external variables help explain about 44 percent of sub-Saharan Africa’s output variance. As a result, both the boom experienced between 2004 and 2011 and the sharp deceleration observed since 2012 can, to a large extent, be attributed to significant changes in the external environment, from extremely favorable in the former period to more adverse in the latter.
Figure 3. Sub-Saharan Africa’s Business Cycle: The Role of External Factors (annual GDP growth, in real terms, for SSA-7)
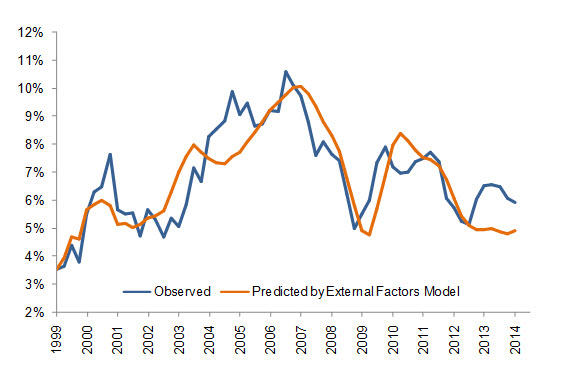
Data sources: IMF and authors’ calculations.
Note: Predicted GDP growth corresponds to the prediction of a vector error correction model using only the observed external factors from Q1.1998 to Q4.2014. For technical details, see “Booms and Busts in Latin America: The Role of External Factors” (Izquierdo, Romero and Talvi 2008).
Key downside risks for sub-Saharan Africa’s growth include a sharp slowdown in China’s growth, a further decline in commodity prices, and a tightening in international financial conditions for emerging economies. Whereas permanently lower commodity prices and tighter financial conditions for emerging economies would only have temporary effects on sub-Saharan Africa’s output growth, a permanent Chinese slowdown would have a larger and persistent effect, as seen in Figure 4.
Figure 4. Counterfactual Scenarios for SSA Growth (annual GDP growth, in real terms, in SSA-7)
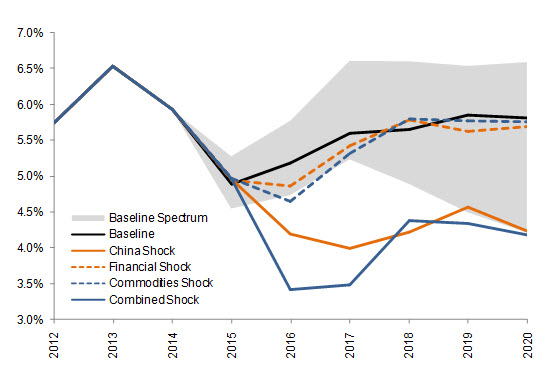
Data sources: IMF and authors’ calculations.
Note: The baseline scenario corresponds to the prediction of the model when external factors are assumed to evolve according to market expectations. The China shock is a reduction in growth from 6.5% to 4%; the financial shock is an increase of 300 bps above baseline EMBI+ levels; the commodities shock is a price fall of 20% below baseline levels; the combined shock combines all of the above simultaneously.
Given the importance of external factors in explaining output fluctuations in sub-Saharan Africa, a key policy recommendation is that in order to properly evaluate a country’s fundamentals, policymakers should work with structural indicators of sustainability. For instance, the structural fiscal and current account balances are the fiscal and current account positions that would result when the key external drivers of the business cycle of sub-Saharan Africa such as commodity prices are computed at their long-run values.
Fiscal sustainability refers to the ability to run fiscal deficits and pile up public debt without compromising a country’s perceived solvency. Figure 5 shows that during the boom period (2004-2011), the observed fiscal balance was consistently above the structural fiscal balance and thus conveyed the impression that the fiscal position was stronger than it actually was. As commodity prices declined and output growth decelerated during the cooling-off period (since 2012), the observed fiscal balance began moving towards the structural fiscal balance, revealing that the underlying fiscal position was actually weaker than the observed one.
Figure 5. Structural Fiscal Balance (% of GDP)
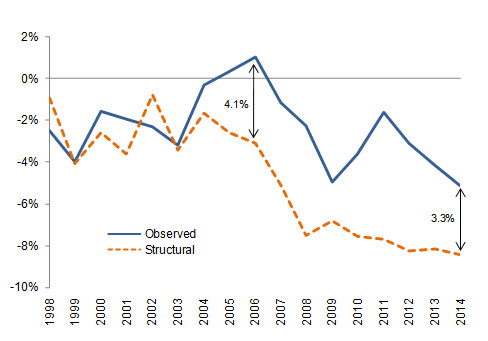
Data sources: IMF and authors’ calculations.
Note: The structural fiscal balance is calculated by performing a linear estimation on observed fiscal revenues between 1998 and 2003, before the boom began, and extrapolating from then on.
External sustainability refers to the ability to sustain excess spending over income with external capital inflows. Figure 6 shows that during the boom period (2004-2011), the observed current account balance was consistently above the structural current account balance and thus conveyed the impression that the external position was stronger than it actually was. As commodity prices declined during the cooling-off period (since 2012), the observed current account balance began moving towards the structural current account balance, revealing that the underlying external position was actually weaker than the observed one.
Figure 6. Structural Current Account Balance (% of GDP)
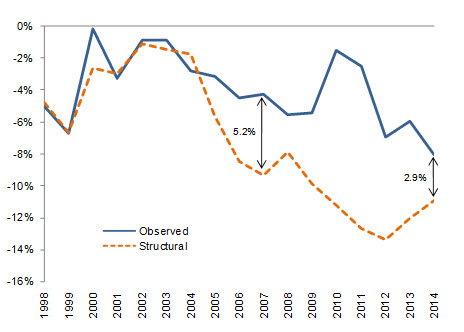
Data sources: IMF and authors’ calculations.
Note: The adjusted current account balance is calculated by using the average of export and import prices observed between 1992 and 2003, before the boom began.
These findings shed some light on the “Africa Rising” narrative—the recent economic boom cycle in sub-Saharan Africa. In particular, they highlight the important role of external factors, which accounted for almost half of the region’s output fluctuations. They also point to the need for policymakers to be cautious in boom periods and rely on structural economic indicators that are less sensitive to the boom-bust cycle of external factors such as commodity prices.
In Foresight Africa: Top Priorities for the Continent in 2016 publications, we have highlighted some policy responses to changes in the external environment. These policy responses include a mix of short-term and medium-term measures such as fiscal, monetary, and exchange rate policy to absorb external shocks as well as increased domestic revenue mobilization and structural reforms to diversify African economies away from commodities.
Indirectly, the findings above emphasize the important role of domestic policies in explaining Africa’s growth. If external factors explain half of output fluctuations, then it is crucial to make sure we get “the other half” of domestic factors right. Now that we are in a bust cycle, the political appetite for policy reforms should be higher. Now is the time for implementation.
The Brookings Institution is committed to quality, independence, and impact.
We are supported by a diverse array of funders. In line with our values and policies, each Brookings publication represents the sole views of its author(s).


Commentary
How much of sub-Saharan Africa’s growth slowdown is being driven by external factors?
April 21, 2016